The $1T Trade Deficit Myth: Why Tariffs Won’t Fix the U.S.-China Economic Relationship
Words: 1,495 Time: 6 Minutes
- The Trade Goal: Is the objective still "free and fair" commerce?
- The Deficit Delusion: Why a $1T trade gap with China isn"t a "loss."
- Market Timing: Why finding a bottom is a process of months, not weeks.
For the past few weeks, we have watched the administration double down on a high-stakes trade strategy. However, history shows there are rarely winners in a tariff war—only losers. Perhaps the biggest loser of all will be the U.S. consumer, who will ultimately be forced to pay higher prices for almost all imported goods.
Is that really the goal?
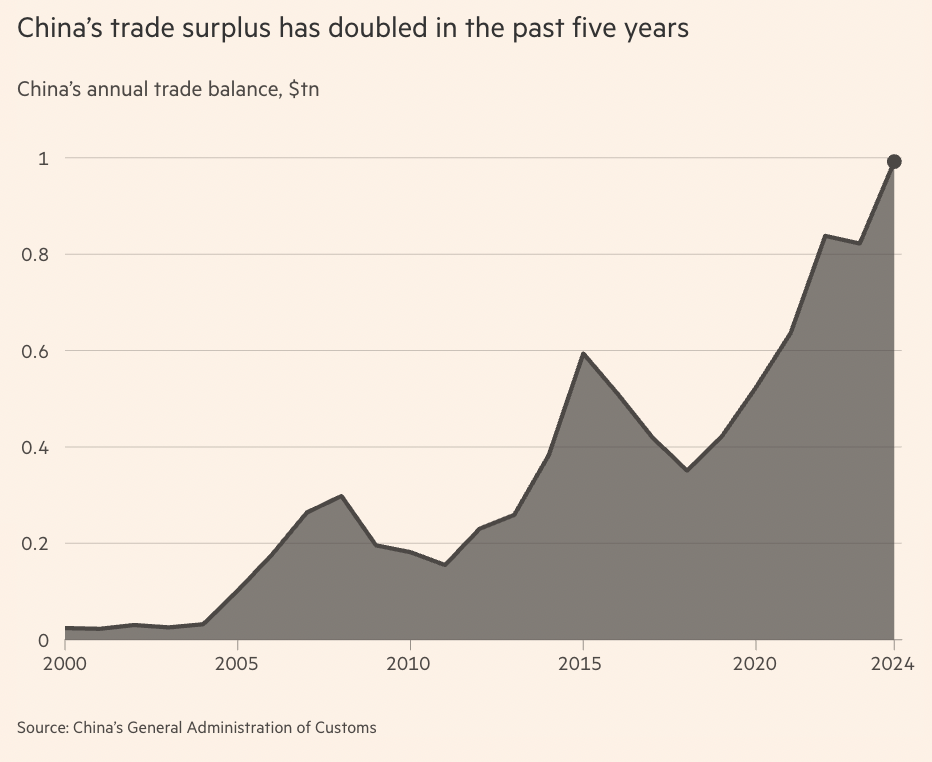
From the President"s perspective, the U.S. has been "ripping the US off" for decades. He frequently points to the ~$1T trade deficit with China—a figure that has doubled in just five years—as proof of an unfair relationship.
While there is a valid point regarding China making U.S. goods more expensive through their own trade barriers, the focus on the trade deficit itself is often a misunderstanding of how global finance works.
Understanding the U.S.-China Trade Engine
Before we look at the grievances, we need some context. China currently manufactures roughly 33% of all goods globally. Over the last forty years, it has cemented itself as the world"s factory—a scale and breadth that very few countries can even hope to replicate.
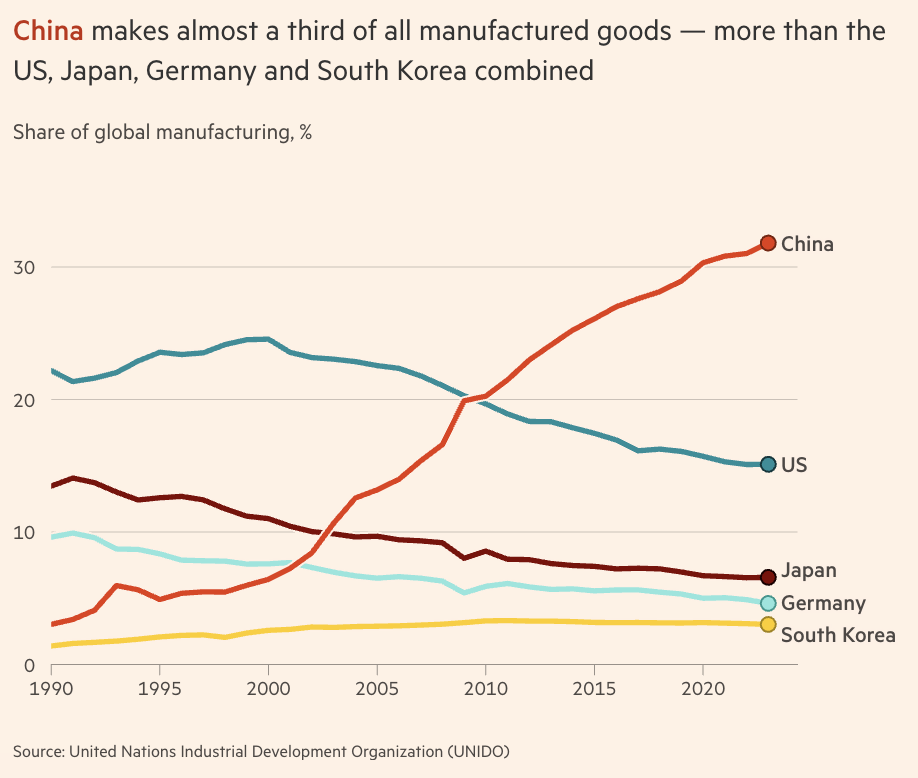
Source: Financial Times
Combined with an insatiable U.S. appetite for affordable products, this has led to a $1 trillion trade gap. Essentially, the U.S. buys far more from China than China buys from us. This difference is what we call the "trade deficit."
In simple terms: A trade deficit occurs when a country"s imports exceed its exports. It is the "negative balance" on the trade ledger for goods and services.
The administration wants this number reduced to zero. However, the President rarely explains the other side of that ledger. Basic economics tells us that when a country sells more than it buys, it must do something with the cash it receives.
The U.S. dollars China earns from trade must inevitably find their way back to the U.S. in the form of investment, bond purchases, or bank deposits. China currently holds nearly $1T in U.S. debt. They can"t spend those dollars in China; they have to invest them back into our system. It is difficult to argue the U.S. is being "ripped off" when China is effectively reinvesting its trade profits back into U.S. assets.
For every dollar of deficit in goods, there is a corresponding surplus in the investment account. They balance each other out.
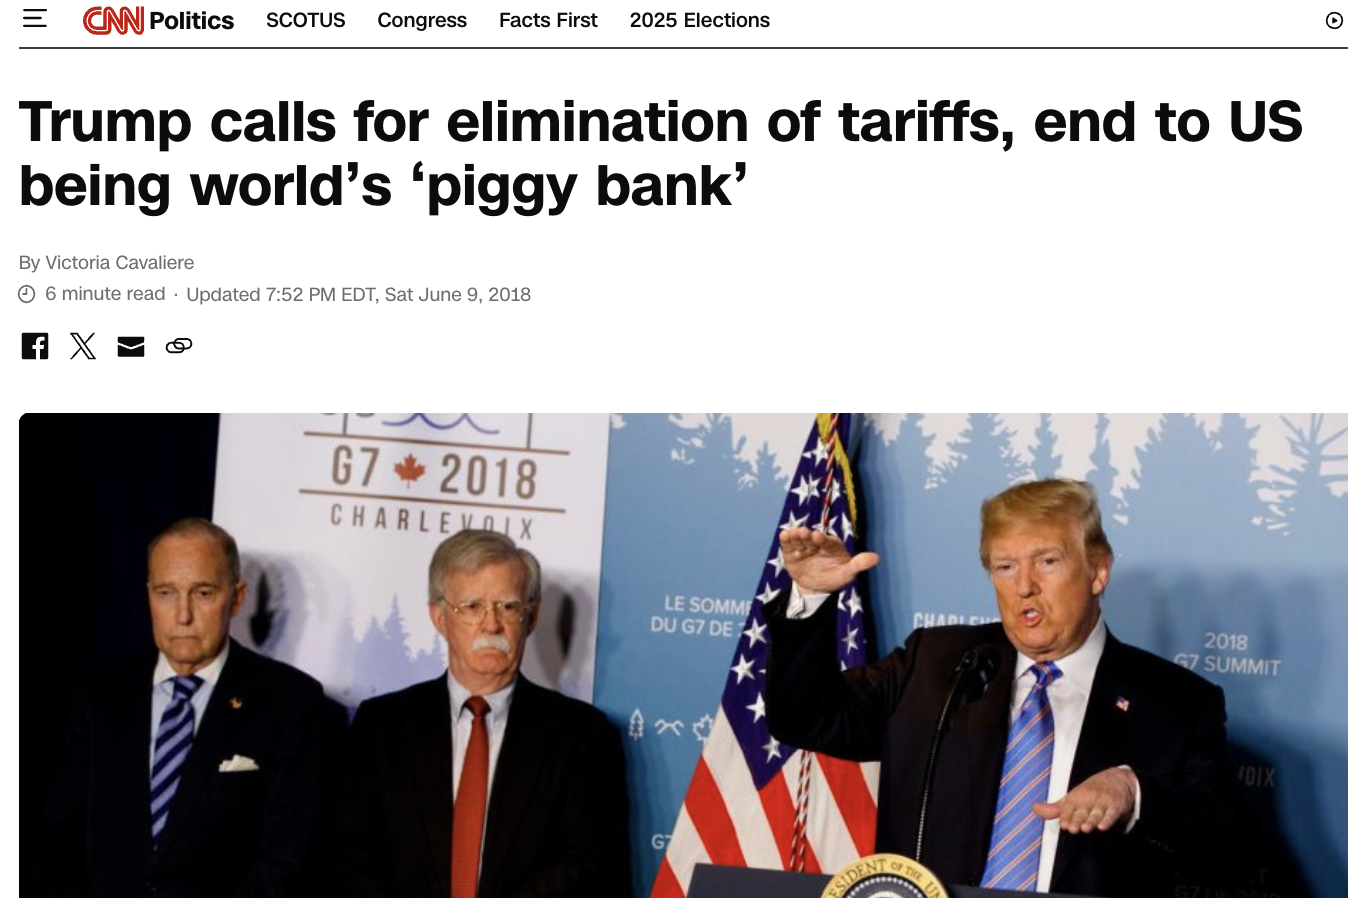
However, the administration is correct about one thing: the unfair taxing of U.S. goods entering China. These barriers should be reduced to create a level playing field. If both nations lowered their tariffs to zero, global growth would accelerate and everyone would benefit. This appeared to be the President"s own stated objective during the 2018 G7 summit:
"We should eliminate tariffs and subsidies, because that would be true free trade."
If that remains the goal, it"s a win for the market. If not, the likelihood of a deep recession only increases as demand for goods starts to fall under the weight of rising costs.
Why Finding a Bottom Takes Time
When the S&P 500 dipped toward 4,800 last week, I suggested it was an opportunity to start building positions in quality companies for the long haul. However, I didn"t establish full positions yet. Market bottoms are usually a process, not a single event.
Why? First, fear doesn"t evaporate overnight. It takes time for certainty to return to the market. Second, traders often test the lows multiple times to see if they hold. This creates the sideways "range-building" action we expect to see before a true recovery.
- The 2008 Financial Crisis bottomed after months of selling, despite several 10% rallies.
- The 2002 Dot-com crash took years of grinding lower before the final floor was set.
I expect the current market to follow a similar path. Let"s look at the weekly chart after the recent rebound:
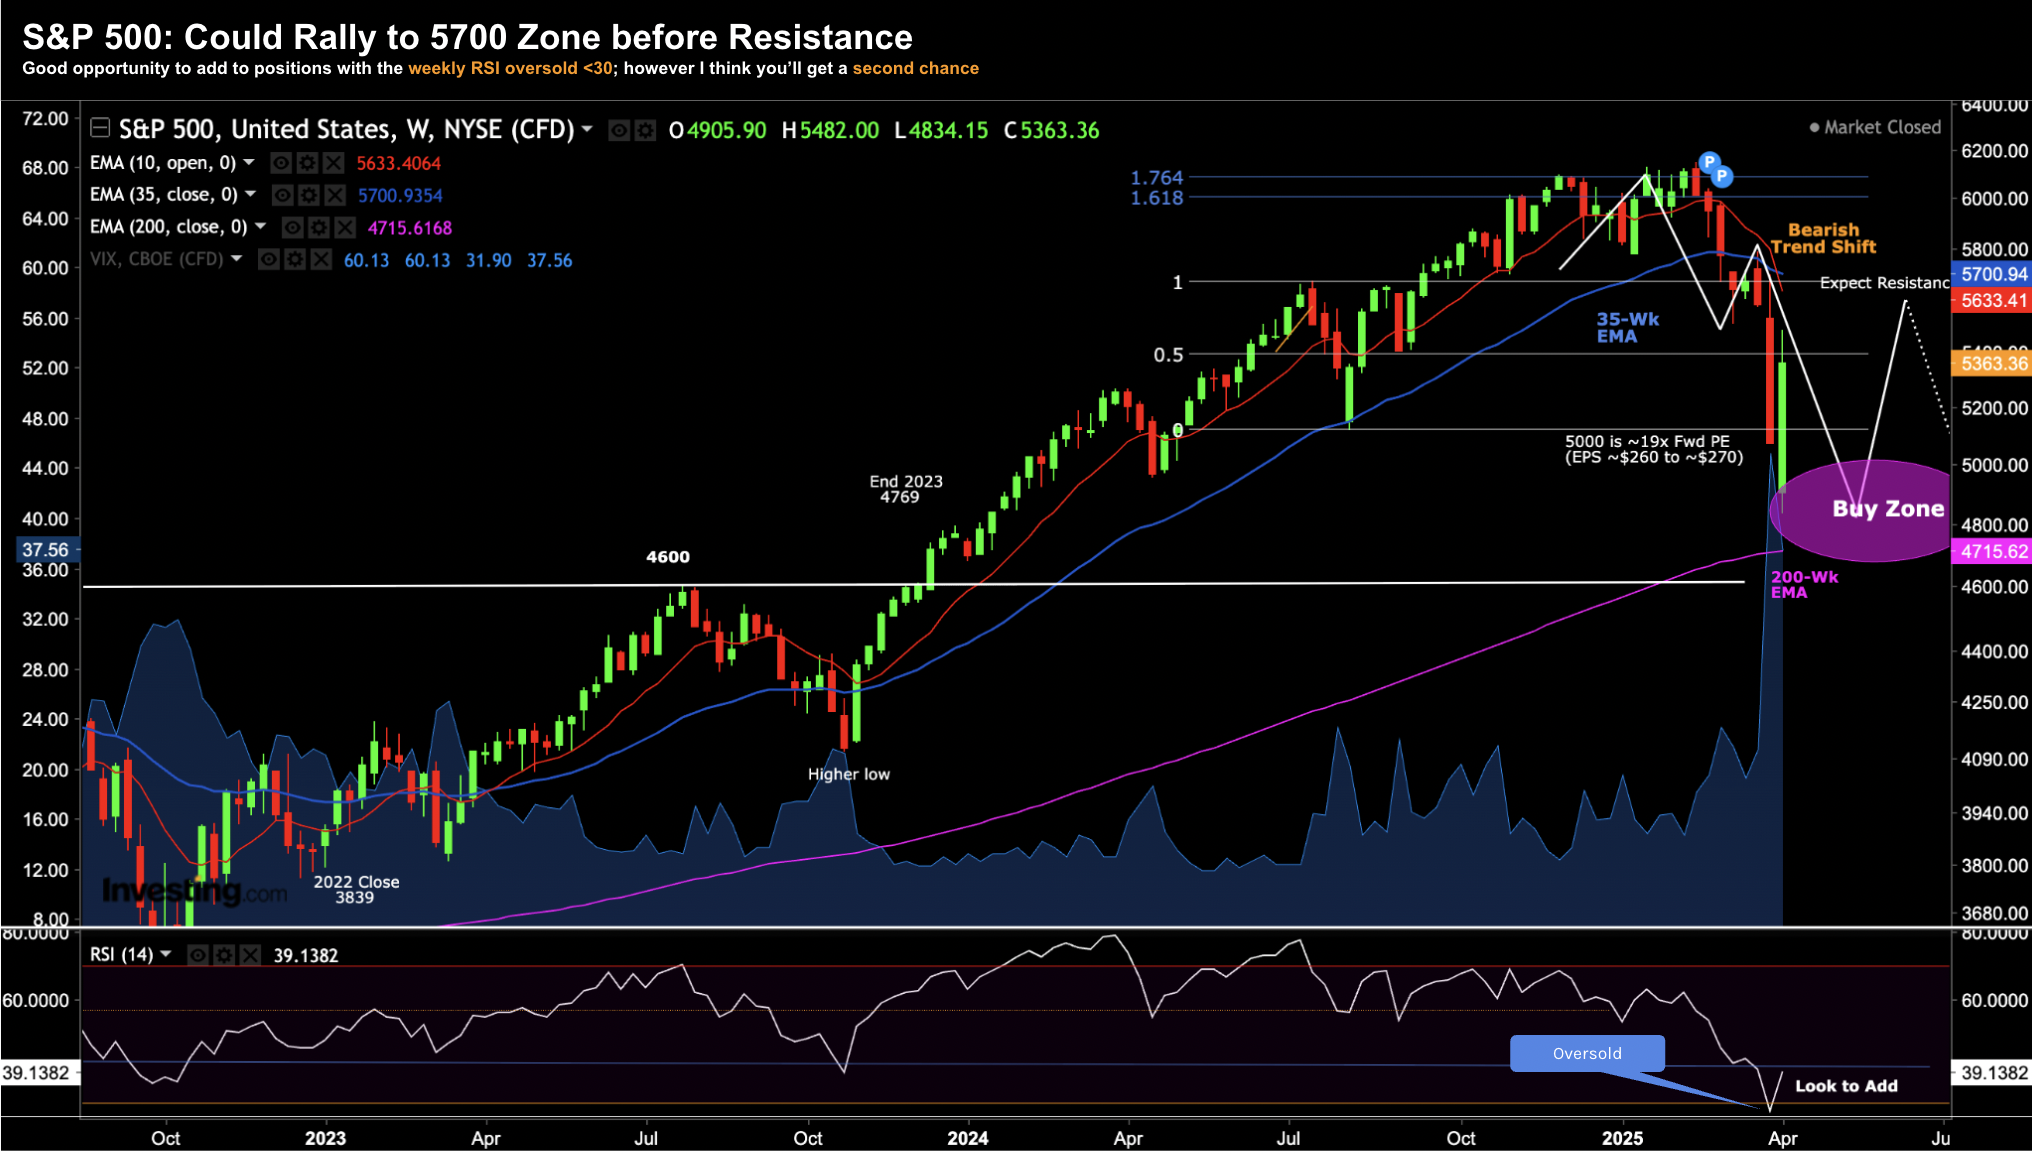
Technical Outlook: April 12, 2025
- The S&P 500 hit the 200-week moving average (pink line) exactly where we expected it to find a floor.
- The weekly RSI dropped below 30, which is historically a high-probability zone to start building long-term exposure.
- However, the short-term trend is now below the long-term trend (the "death cross" on the weekly). This usually indicates a longer bearish phase where rallies are sold.
- Expect a bounce toward the 5,700 zone, where we will likely see significant resistance as traders take profits on the rally.
If you"re holding speculative stocks that benefited from the bounce, consider using any further strength to reduce that exposure. I don"t believe the recent low of 4,834 will necessarily be the final low for the year. My concern now shifts to earnings for the remainder of 2025, where the "lag effect" of trade policy will start to show up on the balance sheet.
Strategic Summary
Navigating the market this year hasn"t been easy, but despite the panic, I chose to add to quality stocks when volatility spiked. It"s the opportunity I"ve been waiting for.
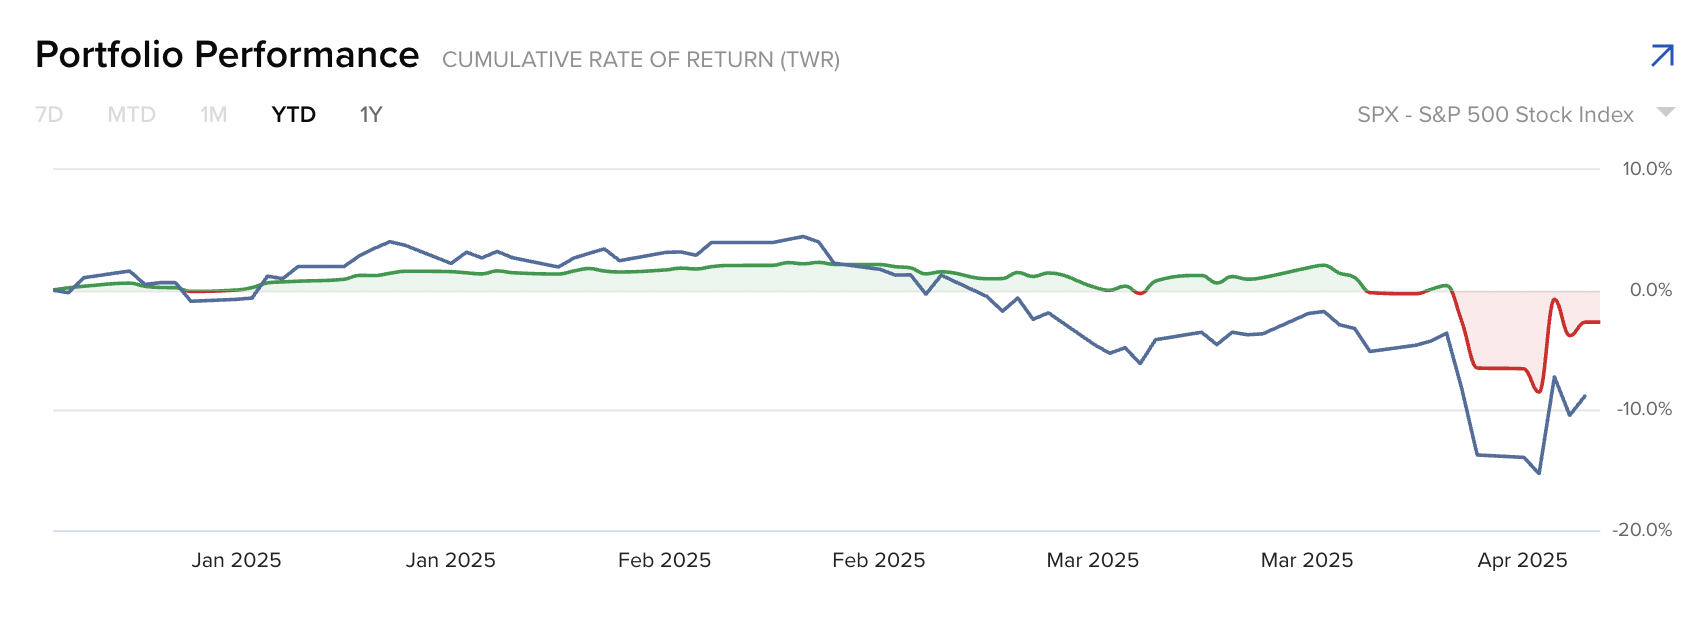
My decision last year to reduce exposure to the "Magnificent 7" was contrarian, but it has paid off. My year-to-date return is -2.5% compared to the S&P 500"s -8.8%.
I feel confident re-establishing initial positions in quality names with a 3-year horizon. Many of these valuations are now much more reasonable than they were six months ago.
In closing, I hope common sense will ultimately prevail in trade negotiations. The 90-day pause is a step in the right direction, but it doesn"t offer the certainty businesses need to make long-term capital investments. Expect more volatility in the months ahead as we wait to see if "free and fair" trade becomes a reality.