The TACO Trap: Why the S&P 500 Mean Reversion and the 5% Bond Yield are the Real ‘Sell in May’
Words: 1,715 Time: 7 Minutes
- Why I don"t pay too much attention to "Sell In May and Go Away"
- Long-term monthly bullish trend in-tact however momentum wanes
- Why Trump may want to prove he"s more than just a loud bark
"Sell in May and Go Away"
This old Wall St. adage has British origins – dating back to the London financial markets.
It suggests that investors should sell their holdings at the beginning of May and re-enter the market around November.
The idea is based on historical data showing:
- The May–October period tends to underperform compared to the November–April period (especially in the U.S. and Europe).
- This is largely attributed to lower trading volumes in summer; i.e., less institutional trading activity (~80% of all volume)
Some studies have found a mild seasonal effect supporting the pattern — especially in older market data.
However, in recent years, the trend is less reliable due to algorithmic (year-round) trading, globalization of markets and a greater presence of retail traders.
For example, selling your portfolio at the beginning of May this year would have seen you miss out on the strongest May since 1990.
The S&P 500 piled on 6.14% last month… something rarely seen in the absence of any monetary stimulus.
For example, when the S&P 500 traded ~4800 to 4900 – I suggested this was a good time to add risk (not reduce it)
More on when ideal times to buy (or sell) further in the post (hint: May has nothing to do with it)
For now I"m more focused on the risks. My goal is always not to lose money (first and foremost). These include (certainly not limited to):
- tariffs and their impact on consumption, earnings and inflation (even if "only" at a 10-15% blended rate); and
- higher bond yields (as a result of greater deficits and debts)
Both are unknowns and very difficult to quantify.
And whilst dimensioning the risks is complex (and far from an exact science) – it doesn"t mean they should be ignored.
But that"s what I think could he happening.
Monthly Trend Intact…
At the end of every month – I like to revisit the longer-term monthly trend.
This helps us detach from the noise and obtain perspective.
It does not focus on specific months to either buy or sell stocks.
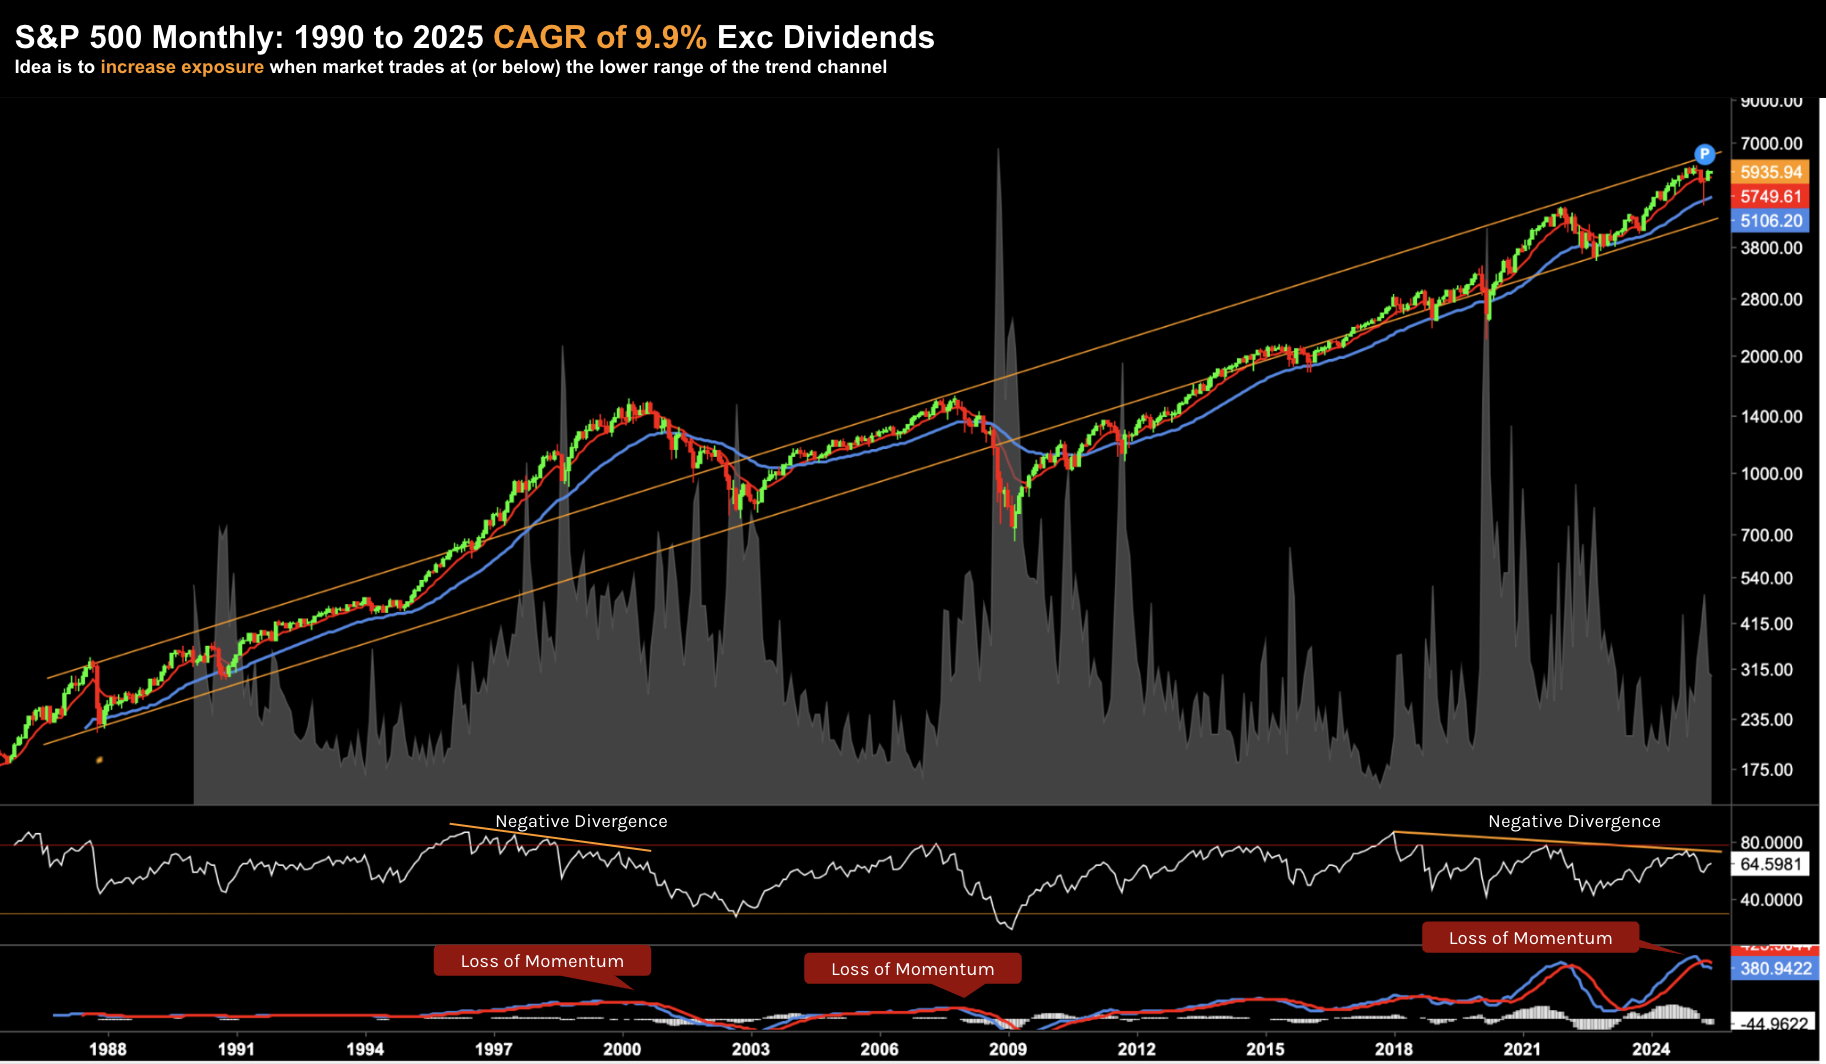
Now from 1990 to today – the S&P 500 has averaged a CAGR of 9.9% exclusive of dividends.
And if I was to expand this to represent 50-years – the CAGR falls to ~8.7% (exc. dividends) – with the Index trading around 90.1 in 1975
June 2 2025
US equities have handily outperformed every other asset class over this timeframe (e.g. property, gold, bonds, cash)
That said, your performance will largely be determined by when you enter (more on this shortly).
The two orange trend lines highlight the average ~10% gain over the past three decades (excluding dividends).
Now, the price will move both above (and below) this average.
For example, in 1998/99 investors were overly optimistic; and during 2008/09 too pessimistic.
But most of the time we will operate within this (rising) ~10% CAGR trend channel.
Based on this, the ideal time to increase exposure is when stocks trade below the mean (i.e., closer to the lower portion of the channel).
Again, the important point is returns are function of what you pay (and when you get out)
Let"s work through a couple of scenarios:
- Let"s say you bought the Index in early 1998 at 980 just above the upper range (but well below the dot.com peak of 1498) and held through today. The 26-year CAGR would only be 7.2% (exc dividends).
- However, if you bought at the peak of the bubble (~1498 at the start of 2000) – your 24-year CAGR would drop to only 5.9% (exc dividends)
- On the other hand, if bought the Index at ~968 late 2008 (i.e., below the trend-line but still well above the ultimate bottom of 666 in March 2009) and held – the CAGR is ~13.8% exc dividends. If you managed to get very lucky and bought at the bottom (difficult to do) – the CAGR is above 15%.
So how does this help us today?
At the time of writing, we"re trading at the upper end of the range.
And whilst that can continue for sometime (e.g. we saw this between 2003 and 2007) – I"m wary of the loss of momentum (and risk/reward).
For example, if you look at the rising trend between 2003 and 2007, the momentum indicators confirmed the trend (i.e., there was not negative divergence).
However, in November 2007, with the market just below its highs, the monthly MACD issued a bearish cross (i.e., similar to what we see today). The market eventually broke down over the next 10 months.
Two technical points to highlight:
- Negative divergence with the monthly Relative Strength Index (RSI) – similar to what we saw during 1997 to 2000; and
- A bearish cross with the monthly MACD (lower window) – similar to early 200; late 2007; and early 2022.
For clarity, neither the monthly RSI or MACD momentum indicators are perfect timing tools (nothing is).
Again, the market could continue to rally in the months (or years) ahead (especially on resolution of any significant trade deals).
However, my best guess is a level above 5,900 feels like a lower probability (longer-term) trade.
And There"s the (More Important) Fundamentals…
That"s the technical set up (for what it"s worth).
However I give far greater weight (e.g., 80%) to the fundamentals.
Ideally both the technical and fundamental picture lines up.
And I believe this is starting to take shape…
For example, over the past couple of weeks I"ve highlighted the (high) 22x forward multiple and lack of equity risk premium
And last week we learned how US growth is slowing.
During the first quarter – consumers slowed spending while goods imports plunged.
Inflation-adjusted (real) personal spending rose just 0.1% after rising 0.7% a month earlier, Bureau of Economic Analysis data showed.
The figures illustrate an undercurrent of anxiety among many American consumers about the economy after the weakest quarter for spending in nearly two years.
While higher duties on imports have yet to show up more broadly in higher goods prices, sentiment has slumped and the outlook for personal finances stands at a record low.
The modest rise in spending reflected an increase in services that more than offset a decline in durable goods outlays
We will see how this impacts earnings in coming months. More broadly, I see two primary headwinds investors need to handicap:
- Tariffs; and
- Higher Bond Yields
Let"s discuss if the market is potentially underestimating the risk.
Tariffs: Difficult to Discount
From mine, investors are becoming complacent about Trump"s tariff war.
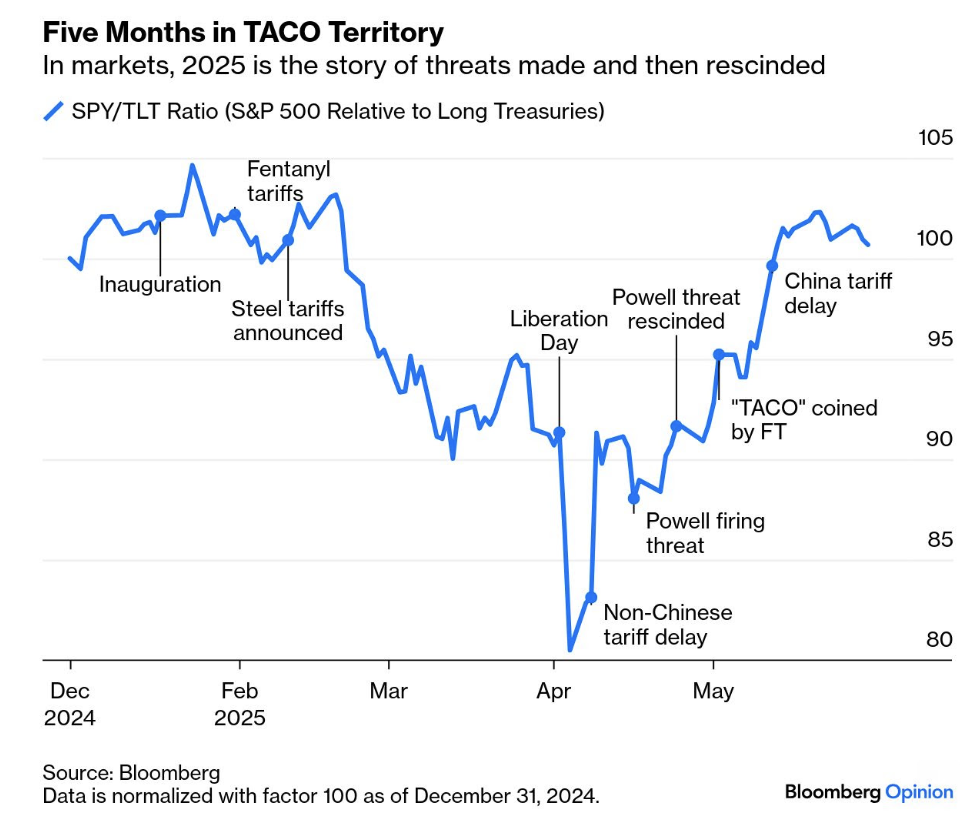
For now, it would appear traders are happy playing the "TACO Trade" (i.e., Trump Always Chickens Out).
But is this a game of chicken you want to play (i.e., buy stocks because the tariffs will be a non-event?)
To help frame the risk(s) – we received some language from FOMC minutes last week.
Fed governors have turned hawkish in recent months as inflation expectations start to rise.
They said inflation is "likely to be boosted" by the effects of higher tariffs – where "firms were generally planning to either partially or fully pass on tariff-related cost increases to consumers".
If correct – that will imply lower consumption (and growth).
They add:
"[Inflation expectation] could make firms more willing to raise prices — while tariffs on intermediate goods could contribute to a more persistent increase in inflation"… "Supply chain disruptions caused by tariffs also could have persistent effects on inflation"
For fun, let"s play the game and assume:
- Trade negotiations are "successful" and net-out at a blended (global) rate the realm of 10-15%
- With the US importing $3.8T in goods last year – this could see US consumers and companies forced to pay between ~$300B to $400B in tariffs.
Repeating the Fed"s language – they believe US companies will either partially or fully pass on the tariff related increases.
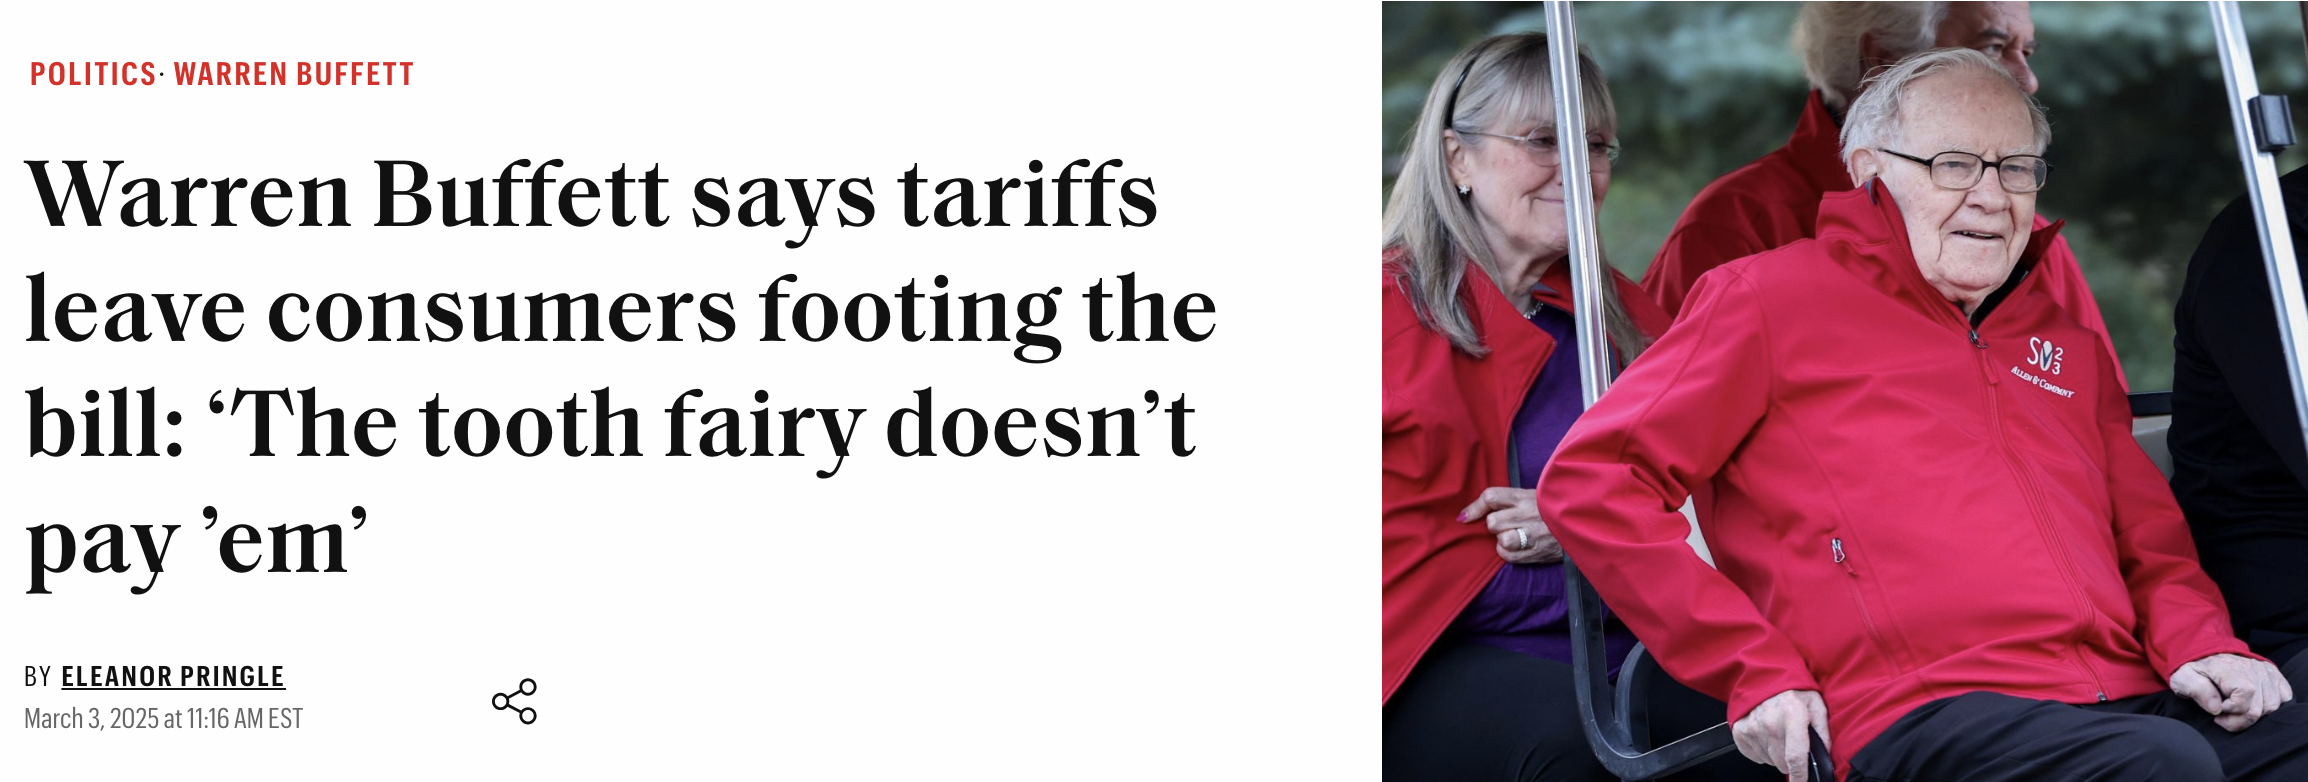
And as Warren Buffett commented recently – "tariffs won"t be paid by the tooth fairy"
But that assumes things "end well" at 10-15%…. what if they are higher?
At the time of writing, we still don"t have any detail on some of the more difficult trade negotiation points (e.g., chips and rare earths being just two).
In complex deals like trade – details matter.
With respect to China and access to chips and rare earths (among other things) – they will be sure to remind Trump of its muscle…

The Middle Kingdom"s global stronghold over strategically vital materials (which include rare earth metals and magnets) – gives them plenty of room to negotiate.
I think Trump"s "TACO" pivot on consumer electronics was an example.
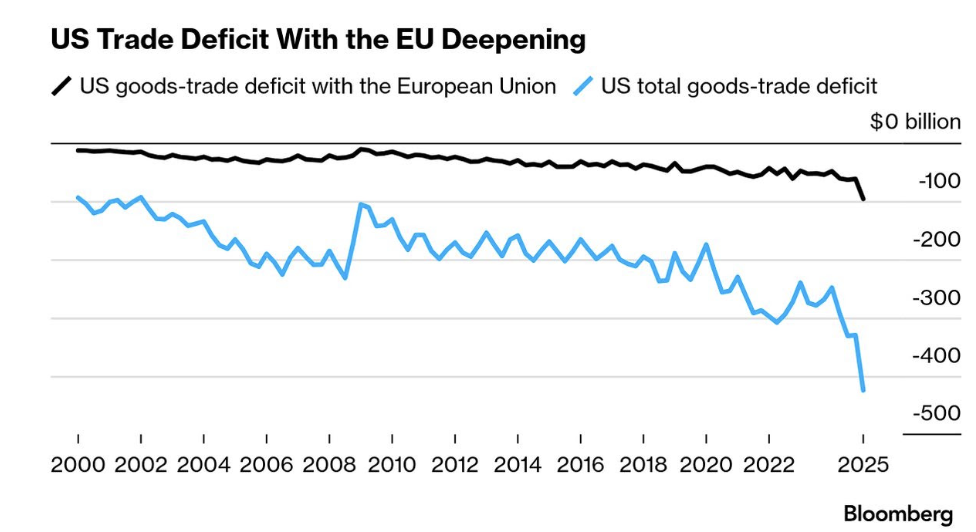
And whilst selling to the US is China"s largest export market – they can sell to other markets (e.g., where the EU almost parallels the US).
| Rank | Country/Bloc | Estimated Exports from China |
|---|---|---|
| 1 | 🇺🇸 United States | ~$525 Billion |
| 2 | 🇪🇺 European Union | ~$500–520 Billion |
| 3 | 🇭🇰 Hong Kong | ~$304 Billion |
| 4 | 🇯🇵 Japan | ~$173 Billion |
| 5 | 🇻🇳 Vietnam | ~$118 Billion |
With respect to the negotiation between the EU and US – Europe is warning that it may speed up retaliatory measures if Trump follows through on his latest threat: a 50% levy on steel and aluminum imports.
The European Commission, which handles trade matters for the EU, said Monday it "strongly regrets" the tariff hike—up from an originally planned 25%—and said the move is undermining efforts to reach a solution to the trade conflict.
Here"s a thought:
Why wouldn"t Europe counter with a "special levy" on all US technology exports?
Companies such as Amazon, Microsoft, Google, Apple and Meta are the US" largest export to Europe. Why not hit them with a reciprocal tax?
But it raises an important question:
How do you sufficiently discount what will happen with Chinese and European trade deals?
It"s near impossible.
These are extremely complex and will take time.
But based on the S&P 500 trading at 22x forward multiple (and low VIX) – the market sees no material risk.
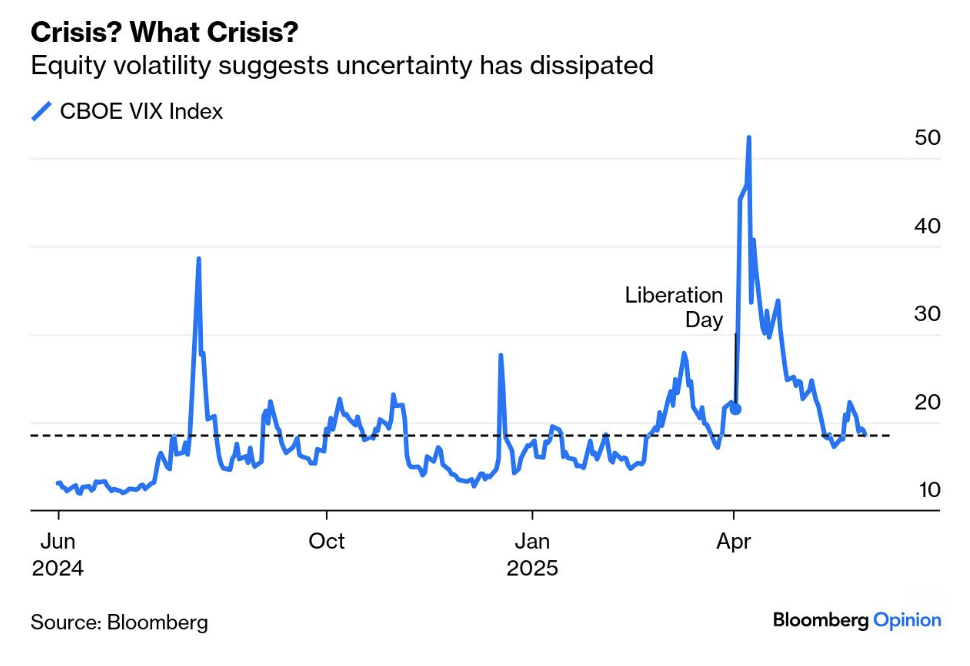
From my lens, the downside risk is high and the upside reward low.
Bond Yields / Rates
The other variable to handicap is what we see with bond yields (and how they trade opposite rising deficits and debt)
As I wrote recently – it will be bond vigilantes who ultimately decide on whether Trump"s "big beautiful bill" holds water.
For example, I think if the US 10-year yield rises beyond 5.0% – this will limit the upside gains in markets.
At 4.50%, the equity risk premium is essentially zero (at a forward PE of 22x). However, at a risk free rate 5.0%, it could encourage funds to find their way to fixed income.
So far this year, long-term bonds have been a poor bet for investors. Higher yields means lower bond prices.
And I don"t see that changing…
We are not going back to a 3.0% 10-year bond yield. Not in the near-term.
The other day I talked to the (bear) steepening of the yield curve – when deducting the 2-year yield from the 10-year:

We saw something similar just prior to the recessions of 2000 and 2008.
And from mine, this only underscores the pressure with longer-duration debt – as investors (rightfully) demand added compensation to lend to the (reckless) US government.
If this trend continues (which I expect) – then Treasury might even scale back (or halt) longer-term bond auctions (given the high price they must pay).
For now, I think the market is okay with the US 10-year trading between 4.50% and 4.75%.
However, once we start pushing the zone of 5.0% – that conversation could change.
Again, what"s priced in?
Putting it All Together
"Be careful not to choke on the TACO trade" was the advice from Bloomberg"s John Authers.
Trump has sincerely believed in protectionism for decades (e.g., watch this PBS video of Trump on tariffs from the 1980s)
At the time it was Japan "ripping off the US".
He said to host Larry King "… you think we have free trade – but we don"t have free trade"
Tariffs and trade isn"t something Trump suddenly started thinking about last November.
He"s been on this war path for over 40 years...
Now, if the TACO trade is right, then Trump"s threats will lose their power as a negotiating tactic.
You also might think Trump is a fool (and there are many good reasons to think he is) — but we can assume he at least gets this much.
He will bristle at the notion the world thinks he is "all bark and no bite".
Therefore, assuming he wants to:
(a) maintain his leverage in trade negotiations; and
(b) protect American industries and workers (specifically in sectors such as manufacturing)
… at some point he may just need to follow through.
How will the market react then?