The Inversion of Growth: Why Private Investment is the Only Way Out of Debt
Words: 1,420 Time: 7 Minutes
- The 2008 Pivot: How bank reserves changed the rules of inflation.
- The COVID Anomaly: Deconstructing the $6 trillion liquidity surge.
- Inversion Thinking: What must happen to avoid a permanent growth scare?
Investors often ask: "With 10-year yields trading at decade highs, why haven"t equities sharply corrected?" The answer lies in the plumbing. Despite higher rates, liquidity remains abundant. Credit spreads—the ultimate barometer of systemic stress—remain remarkably tight. But to understand if this resilience is sustainable, we must invert the problem: What would it take for this growth engine to actually stall?
The Big Shift: From Restraint to Abundance
To understand our current debt burden, we must look back at the pivot of 2008. Before the Great Financial Crisis, the Fed controlled inflation by restricting bank reserves. Post-2008, they shifted to an "ample reserves" framework, paying interest on those reserves and effectively decoupling money supply from immediate inflationary pressure—for a time.
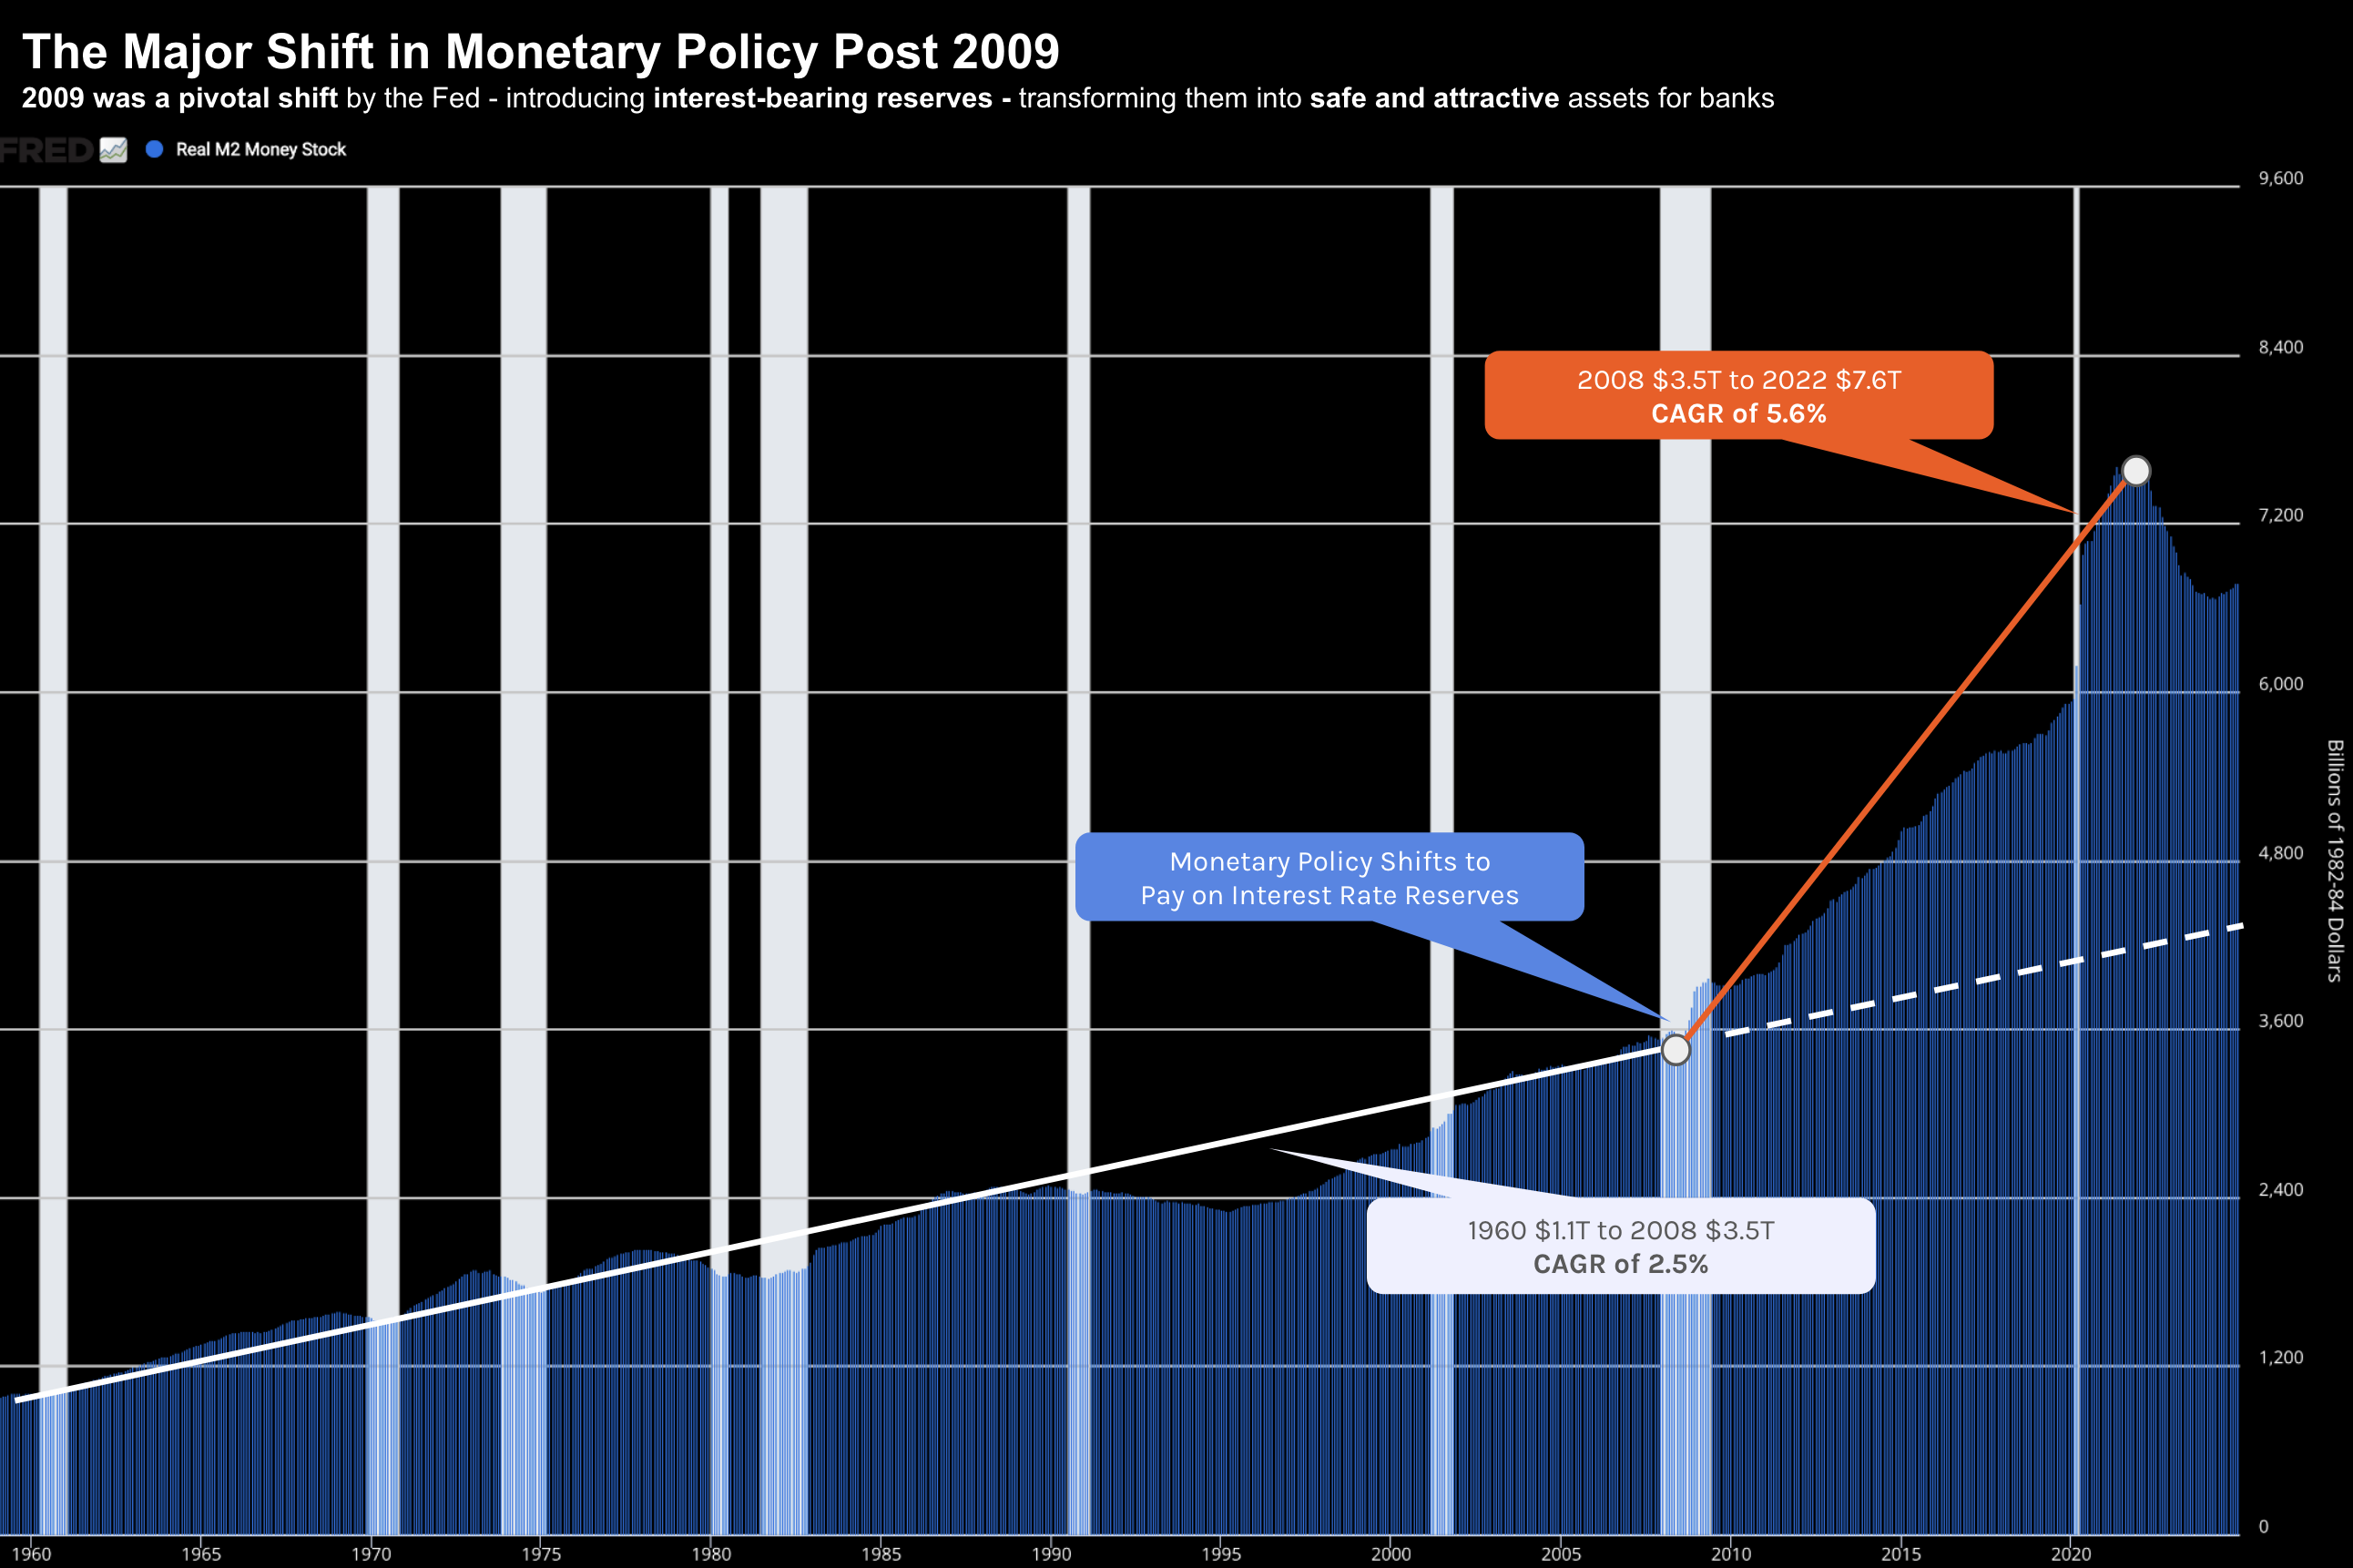
Between 1960 and 2008, Real M2 money stock grew at a steady 2.6% CAGR. Post-GFC, that exploded. By 2022, we saw a surge reminiscent of WWII. This shift transformed the Fed from a "restrictor" of liquidity into the primary "provider" of it, setting the stage for the public debt explosion that followed.
The Inflation Genie: A Man-Made Error
The pandemic response in 2020 triggered a $6 trillion distribution of relief funds. This was "helicopter money" in its purest form. Public debt jumped from $23T to $36T almost overnight, far outstripping GDP growth. When pent-up demand met broken supply chains, the result was inevitable: excess money chasing too few goods.
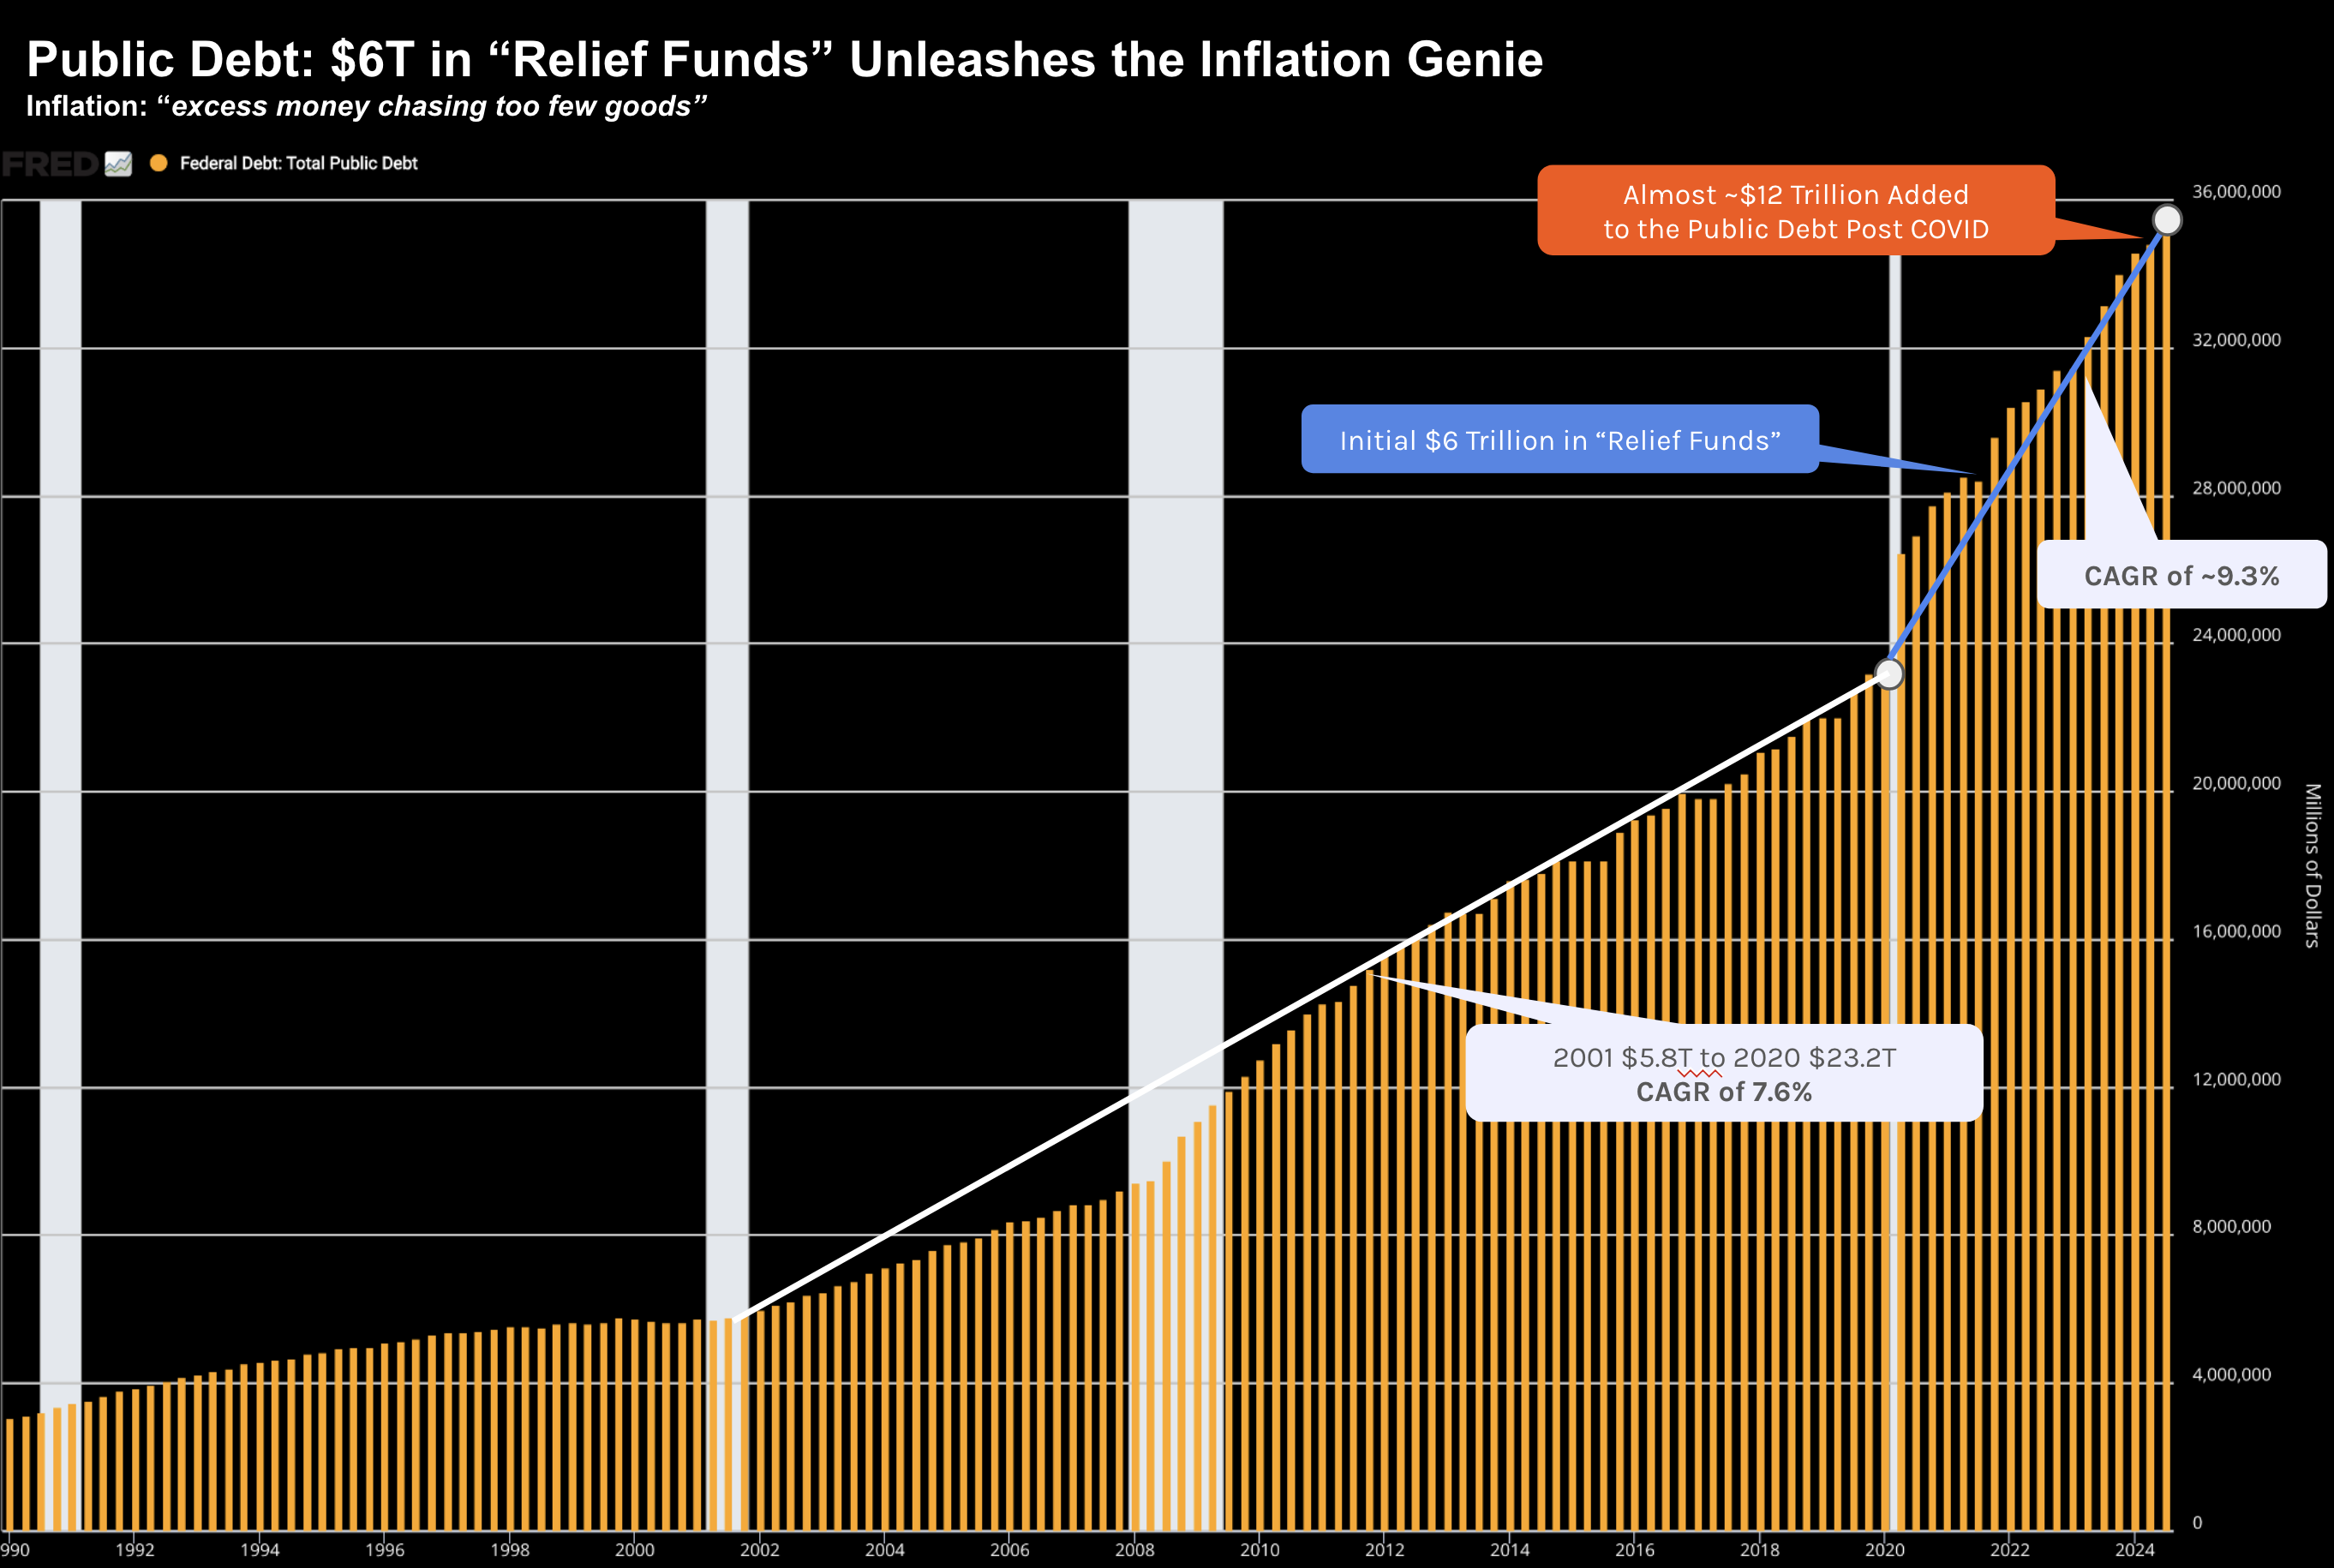
While the "transitory" narrative has been retired, the consequences remain. Prices haven"t fallen; they are simply rising more slowly. The liquidity that kept the economy afloat during the rate hikes of 2022 and 2023 is the same liquidity that is now fueling record-high asset prices despite a zero risk premium relative to bonds.
Inverting the Growth Problem
Charlie Munger famously said: "Invert, always invert." Instead of asking how to create growth, let"s ask: What is killing growth?
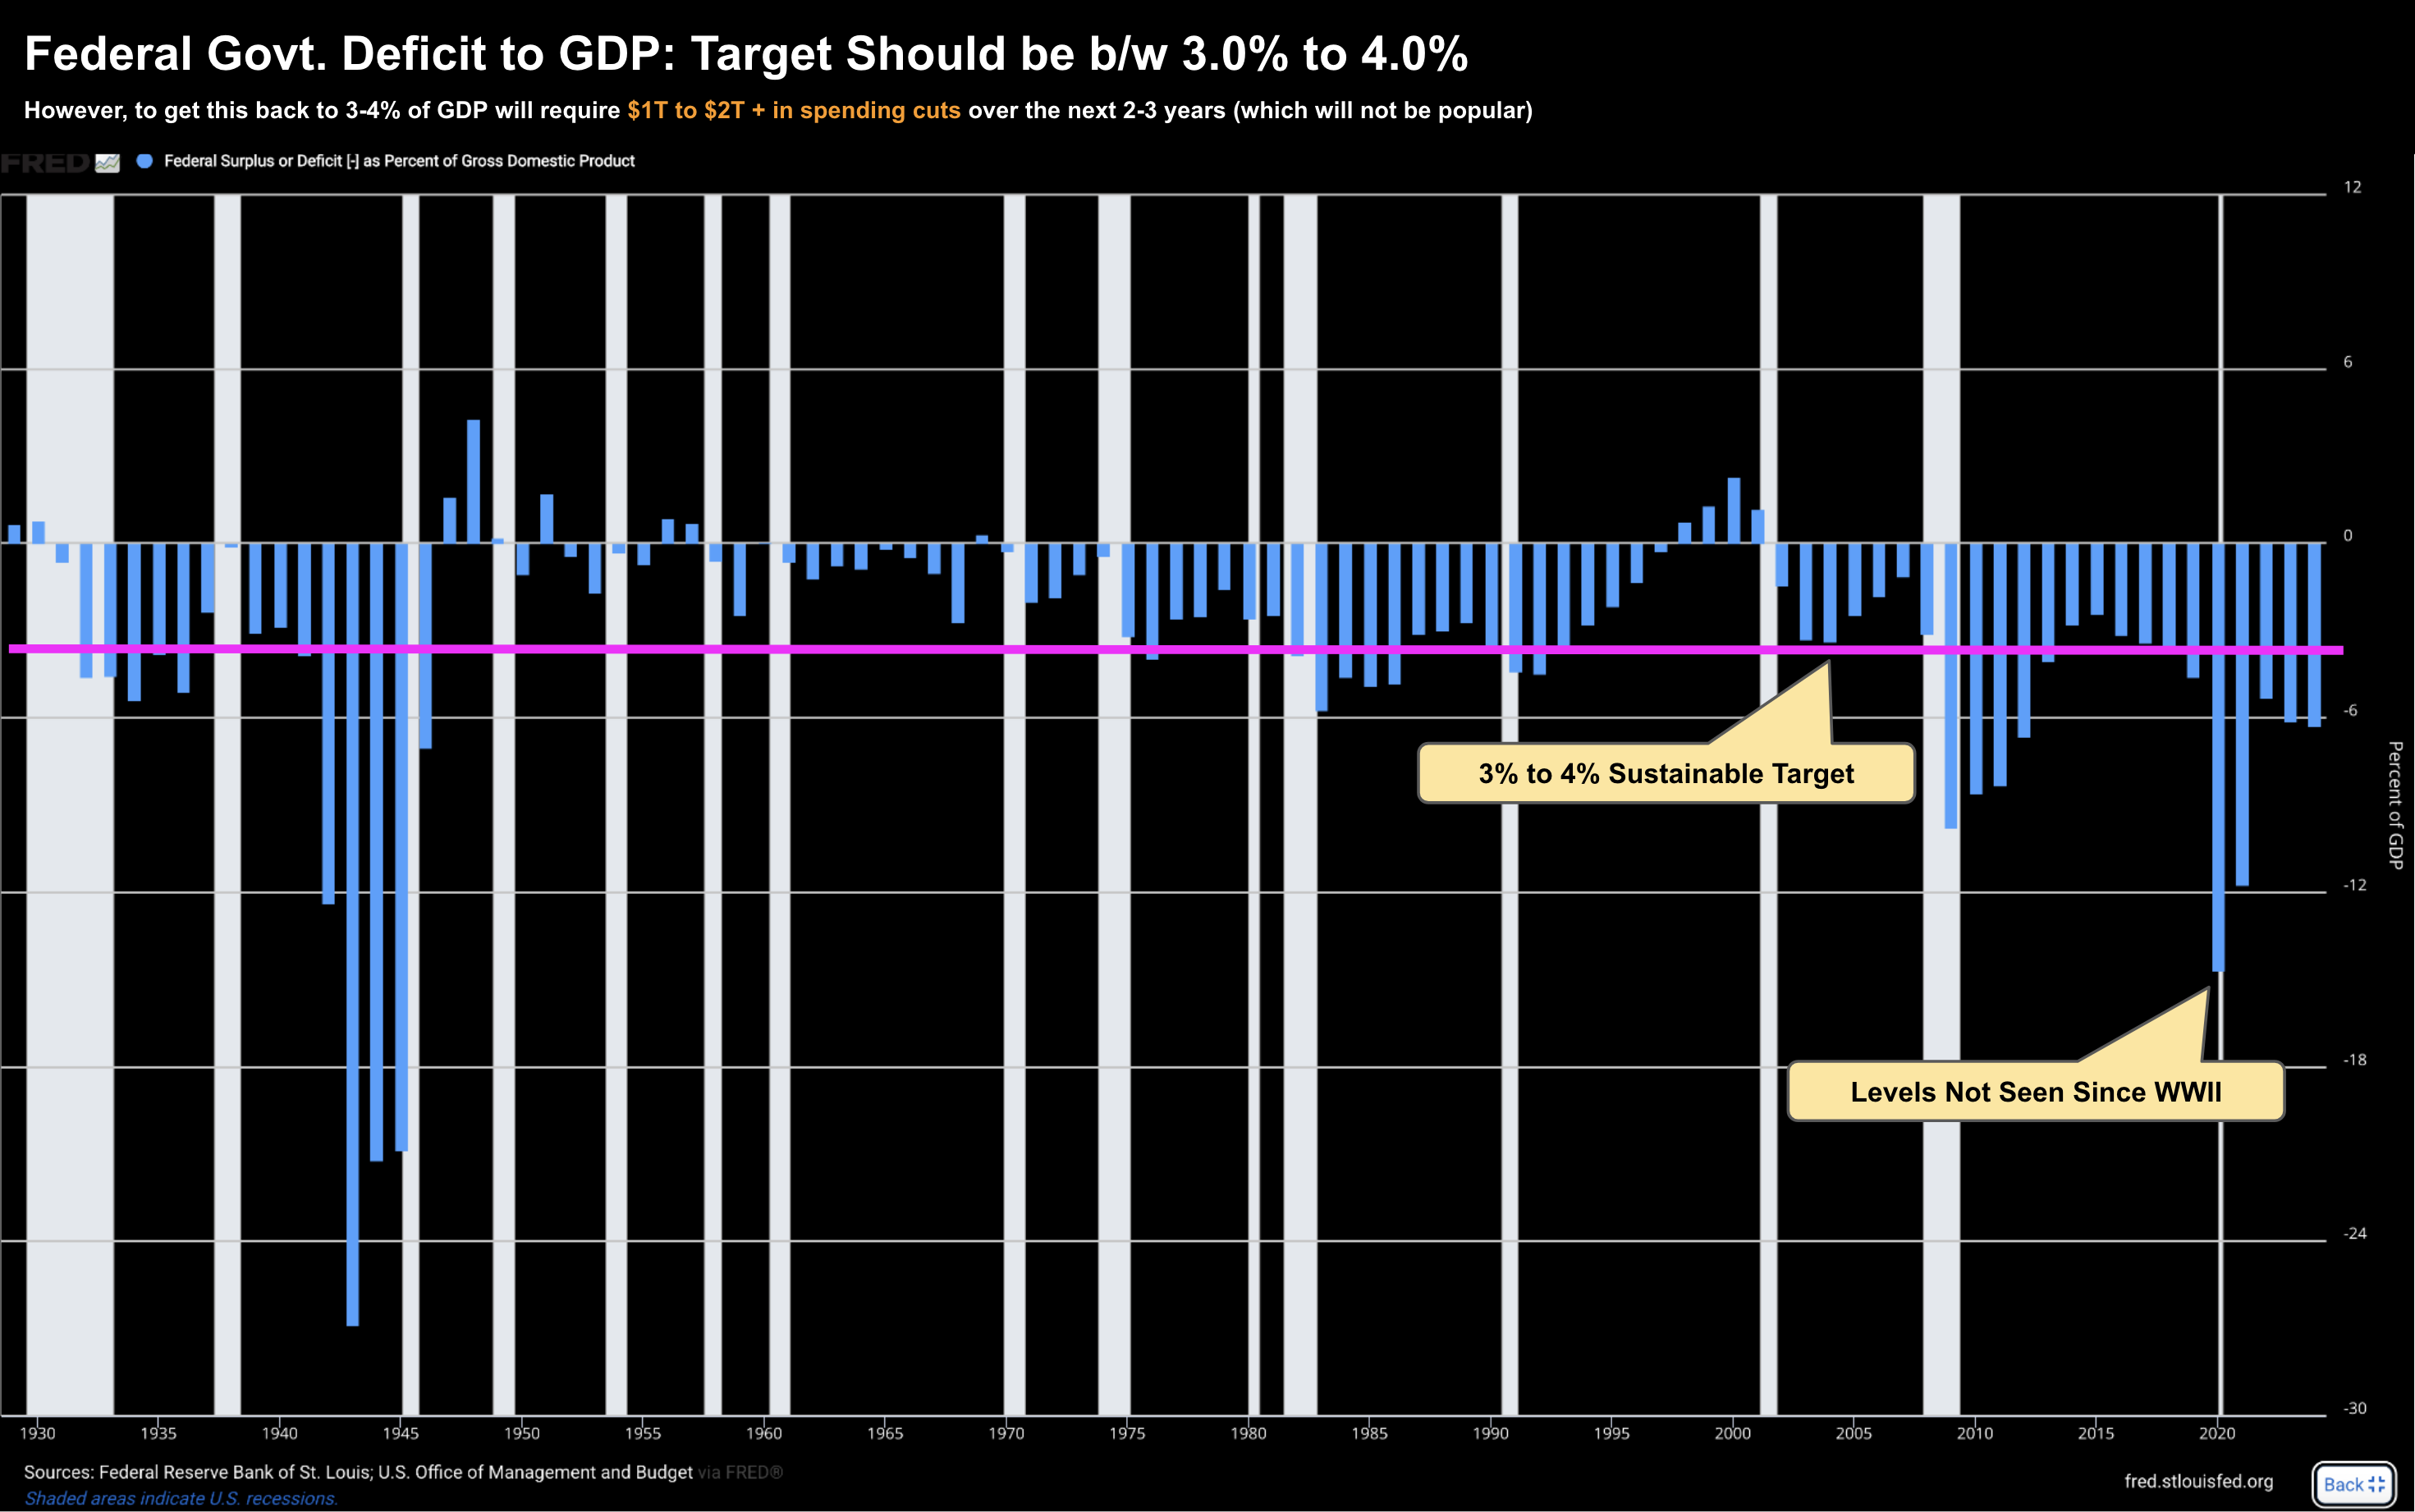
- Public Sector Crowding Out: Federal deficits are trending toward $2T annually. When government spending (and government job growth) outpaces the private sector, capital is diverted away from productive, tax-producing investments.
- Interest Expense: For the first time, net interest outlays on public debt are rivaling major pillars like Defense and Medicare. This is "dead money"—capital that services the past rather than investing in the future.
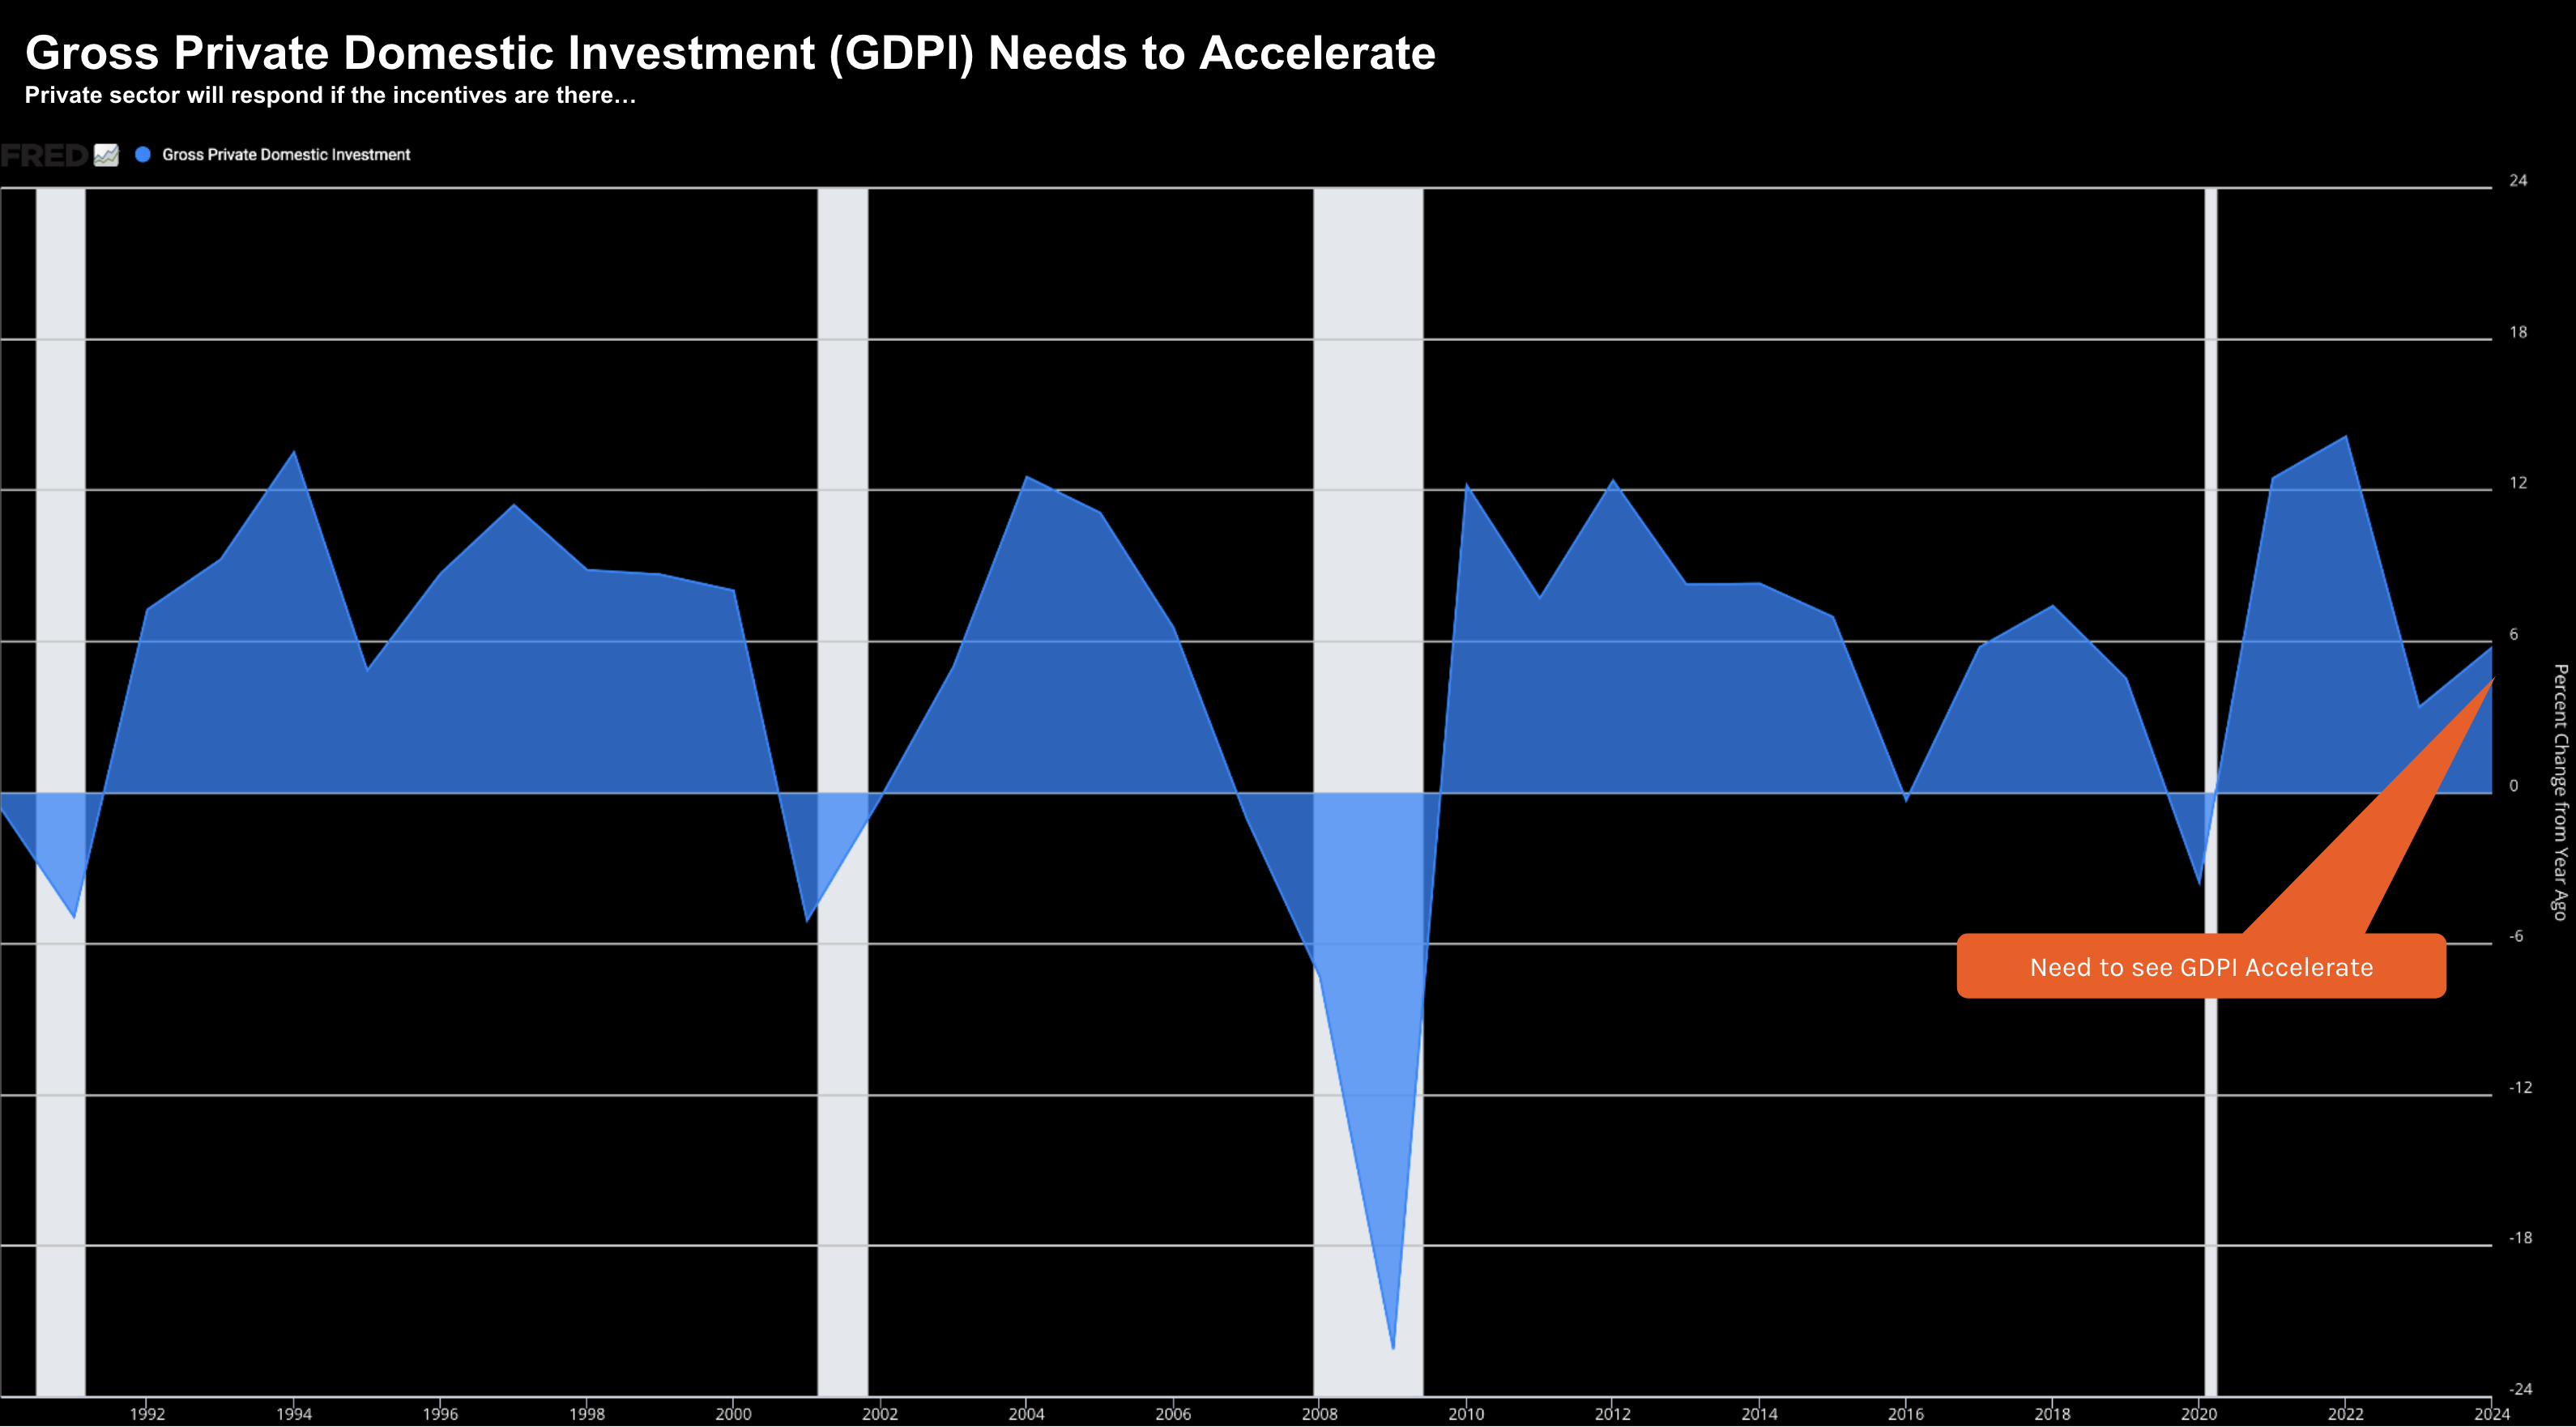
- Low Private Investment: Gross domestic private-sector investment is currently below long-term averages. Without this, productivity stalls.
The Path Forward: Two Essential Pathways
Can we "undo" the spending of the last four years? I have my doubts that any central committee can simply "cut" their way to prosperity. Real growth will not come from central planning; it must come from Private Business Investment.
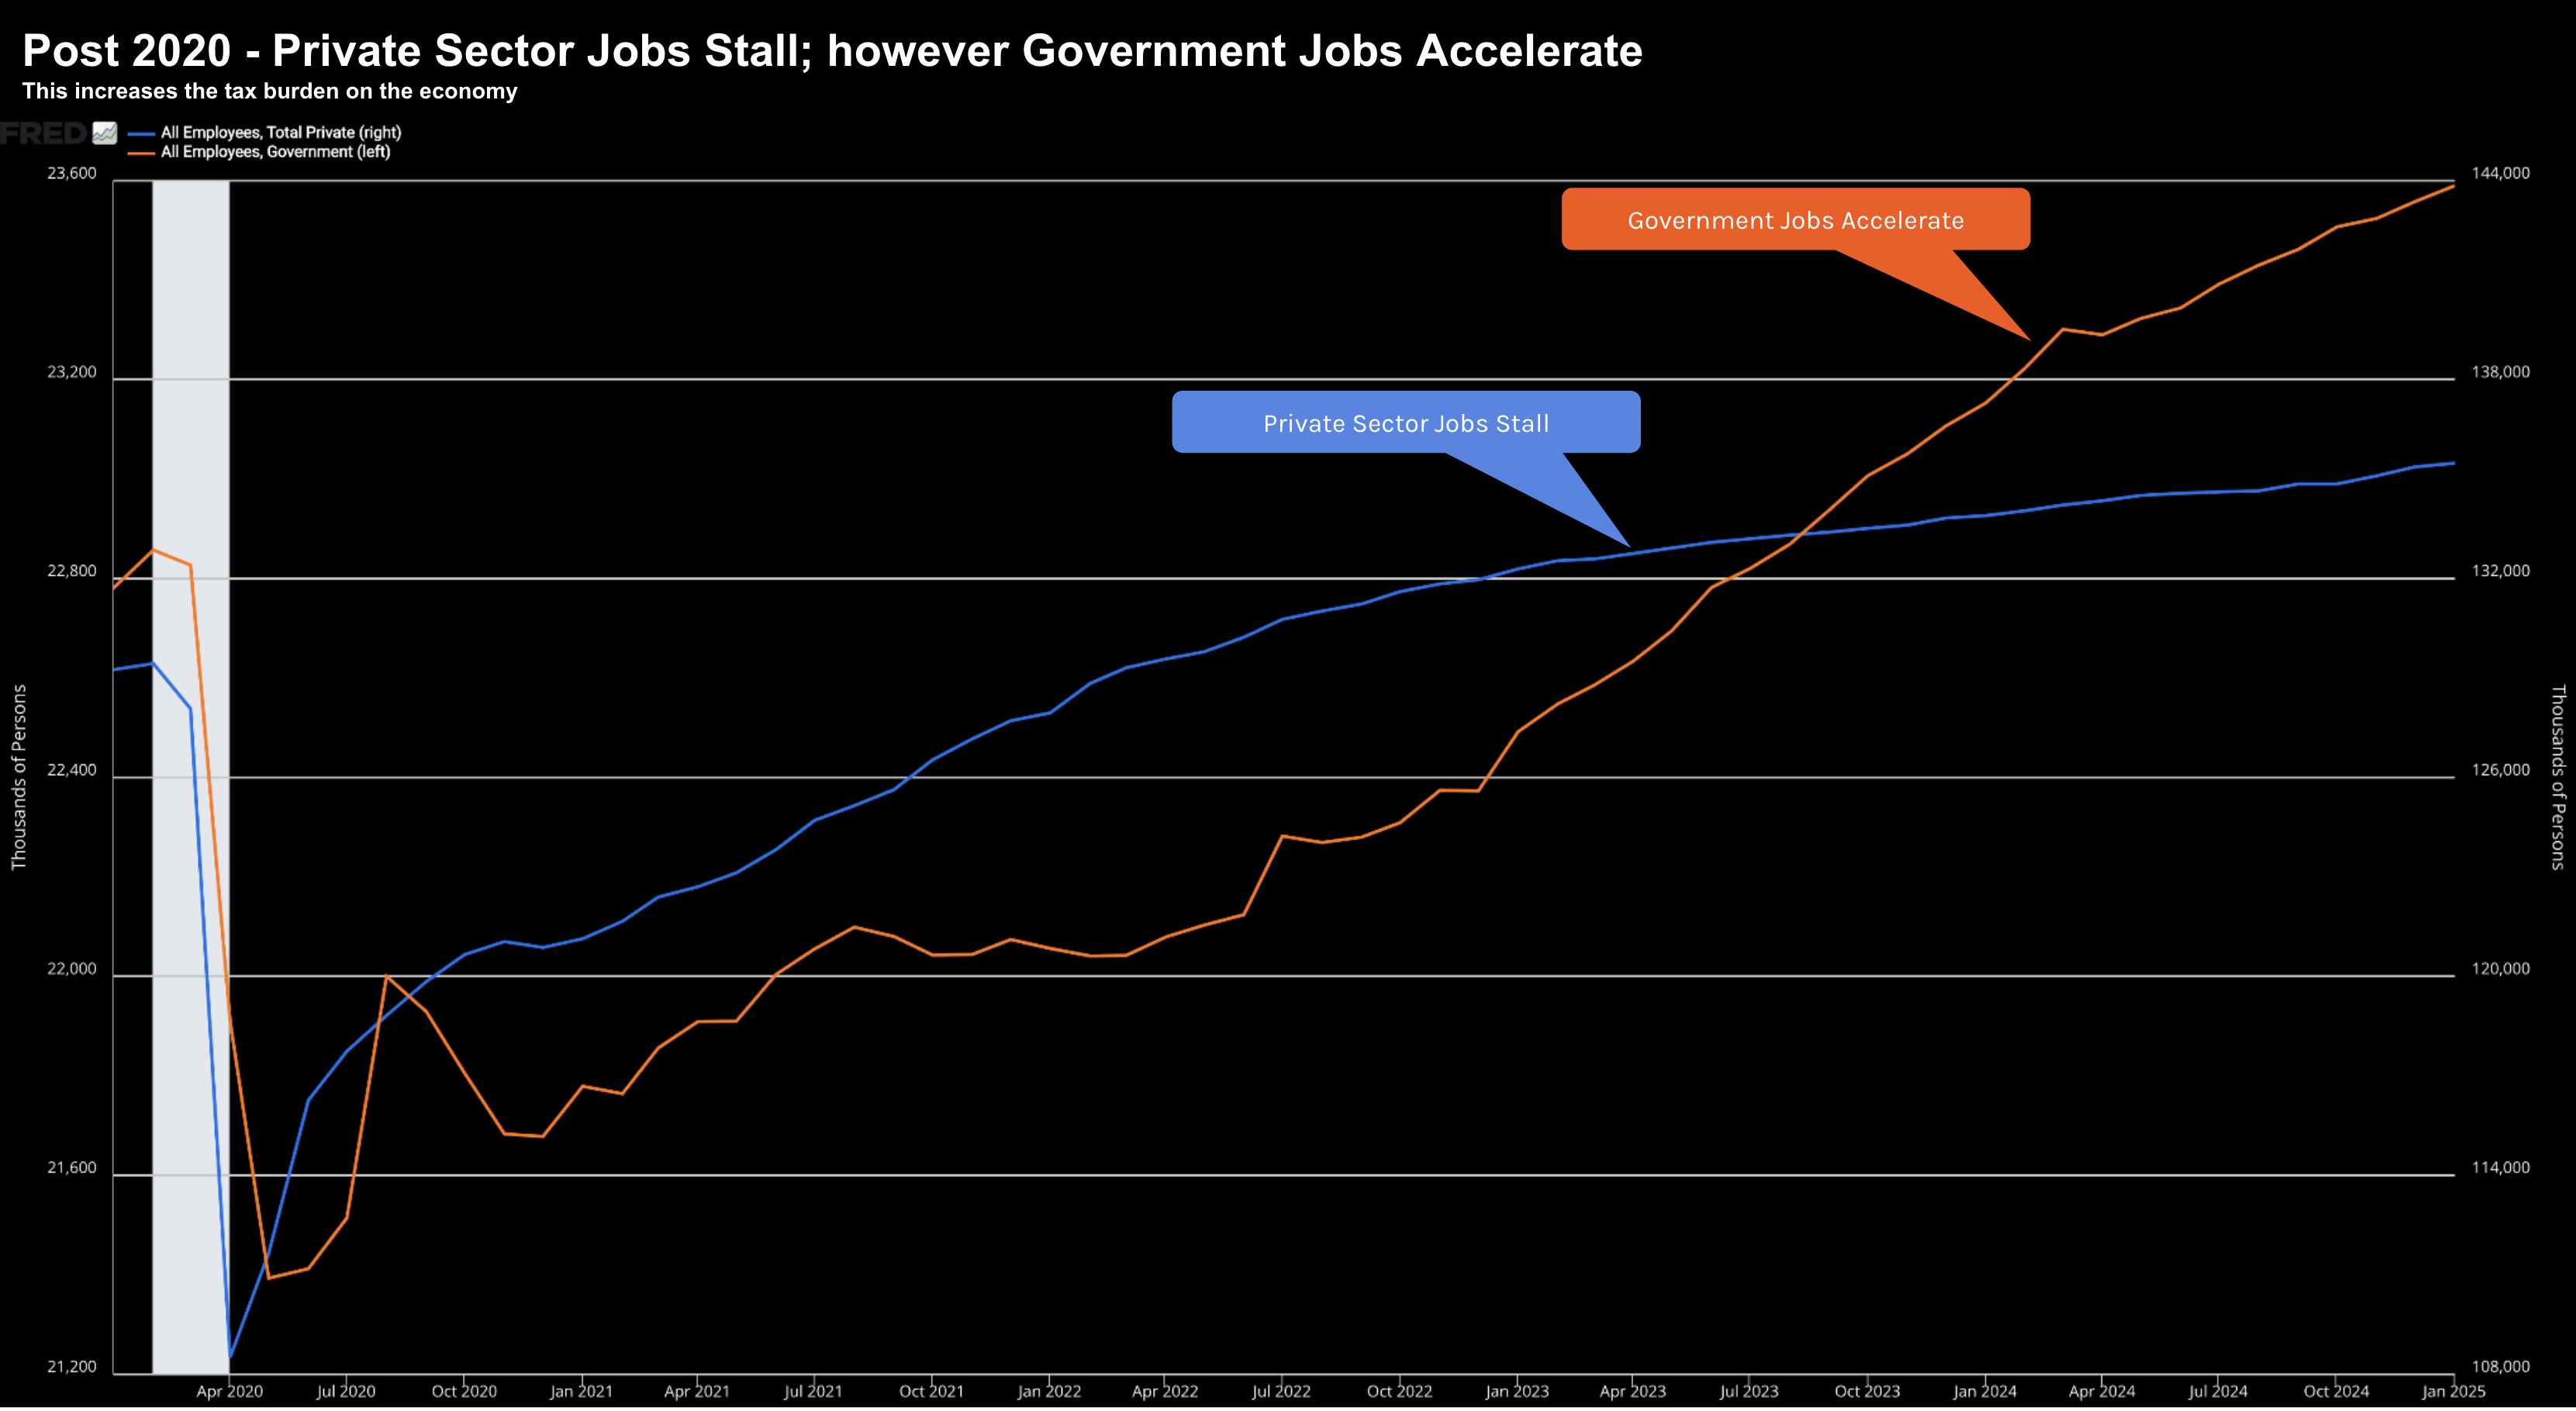
For growth to be sustainable, we need to see a reversal of the current trend: private-sector job growth (the "tax producers") must outpace government job growth (the "tax consumers"). Furthermore, we need manageable debt levels where interest costs don"t cannibalize the entire federal budget.
Putting it All Together
The "monetary experiment" of the last twenty years has consequences. We have traded long-term fiscal health for short-term liquidity. While this has cushioned the market against rising yields, it has also left us with a razor-thin margin of safety. Someone always pays for the "free lunch" of deficit spending—usually through lower future returns or higher future taxes.
If you want to understand the metrics I use to find companies that are actually contributing to that private-sector growth, start with my framework on capital allocation: "The Math of Moats: ROIC and the 15/15 Rule."