Nvidia’s Expectations Gap: Why High Quality Doesn’t Always Mean High Returns
Words: 1,210 Time: 6 Minutes
- The "Expectations Gap": Why stocks fall on "great" news.
- The Honeypot Effect: High margins as a magnet for competition.
- Momentum vs. Value: Understanding RSI/MACD negative divergence.
Nvidia (NVDA) remains the poster child for the artificial intelligence era. Its earnings reports are no longer just corporate updates; they are macro events. However, even when revenue rises 78% and earnings beat estimates, the market can react with a sharp sell-off. This isn"t a fault in the company"s quality—it"s a correction in expectations.
The Quality Recap
- Revenue Growth: Scaling at 78% to 100%+ annually.
- Gross Margins: Clocking in at a staggering 73%.
- Market Dominance: Data center revenue represents ~90% of total sales.
In the semiconductor industry, a 73% gross margin is virtually unheard of. It is the definition of a high-quality "moat." However, when you create a "honeypot" of this size, competition is inevitable. The risk isn"t just from other chip makers; it"s from Nvidia"s largest customers—the "hyperscalers" like Microsoft, Google, and Amazon—who are increasingly incentivized to build their own silicon to protect their own margins.
Valuation: Beyond the Hype
Quality is only half of the equation. The other half is what you pay. While a Discounted Cash Flow (DCF) model is perfect for a stable utility or a railroad, it often fails in highly disruptive industries like AI, where a single innovation (like the DeepSeek event) can turn the market on its head.
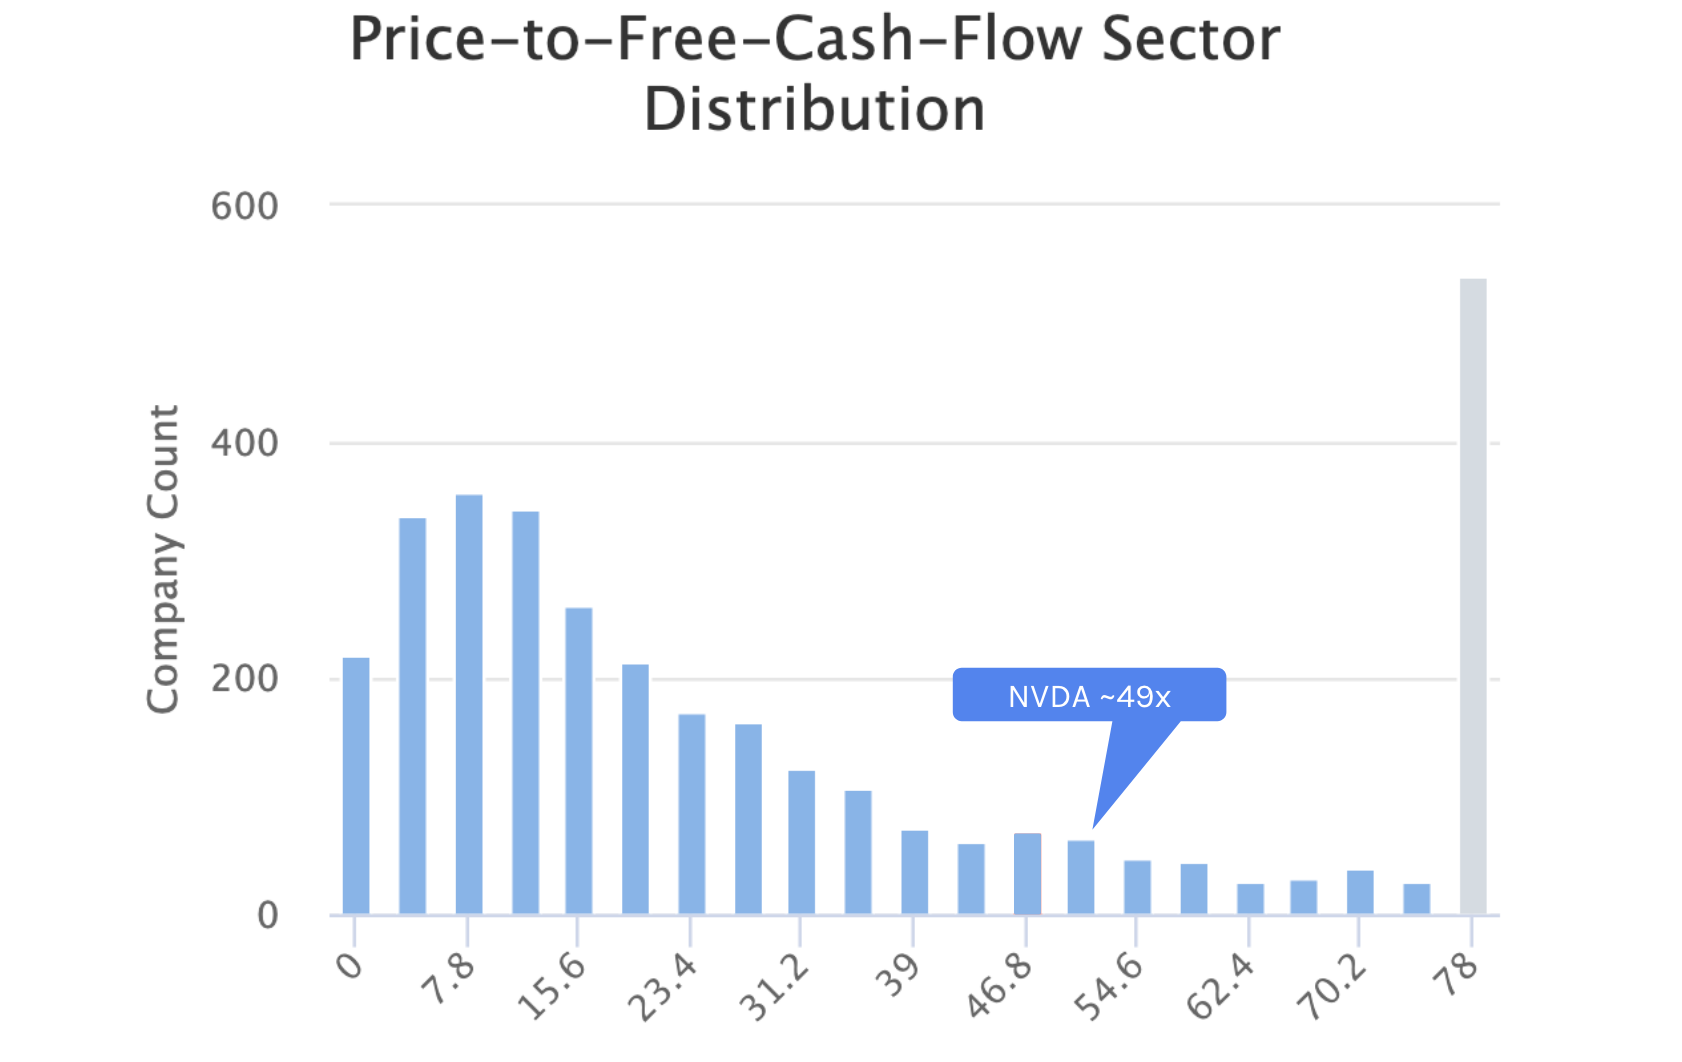
To find a grounded valuation, we look at two specific metrics: EV/EBIT and Price/Free Cash Flow (P/FCF).
- EV/EBIT: Even after a pullback, Nvidia often trades at 35x-37x. This is reasonable for 50% growth, but leaves no room for a "growth scare."
- P/FCF: At a P/FCF of ~49x, you are making a massive bet that growth remains above 50% indefinitely.
If growth were to normalize toward 40% or below, a 49x multiple becomes a "perfect storm" for a correction. For those looking for a Margin of Safety, "nibbling" usually makes sense when multiples compress toward the 30x-35x range, while aggressive entry should be reserved for valuation floors near previous cycle lows.
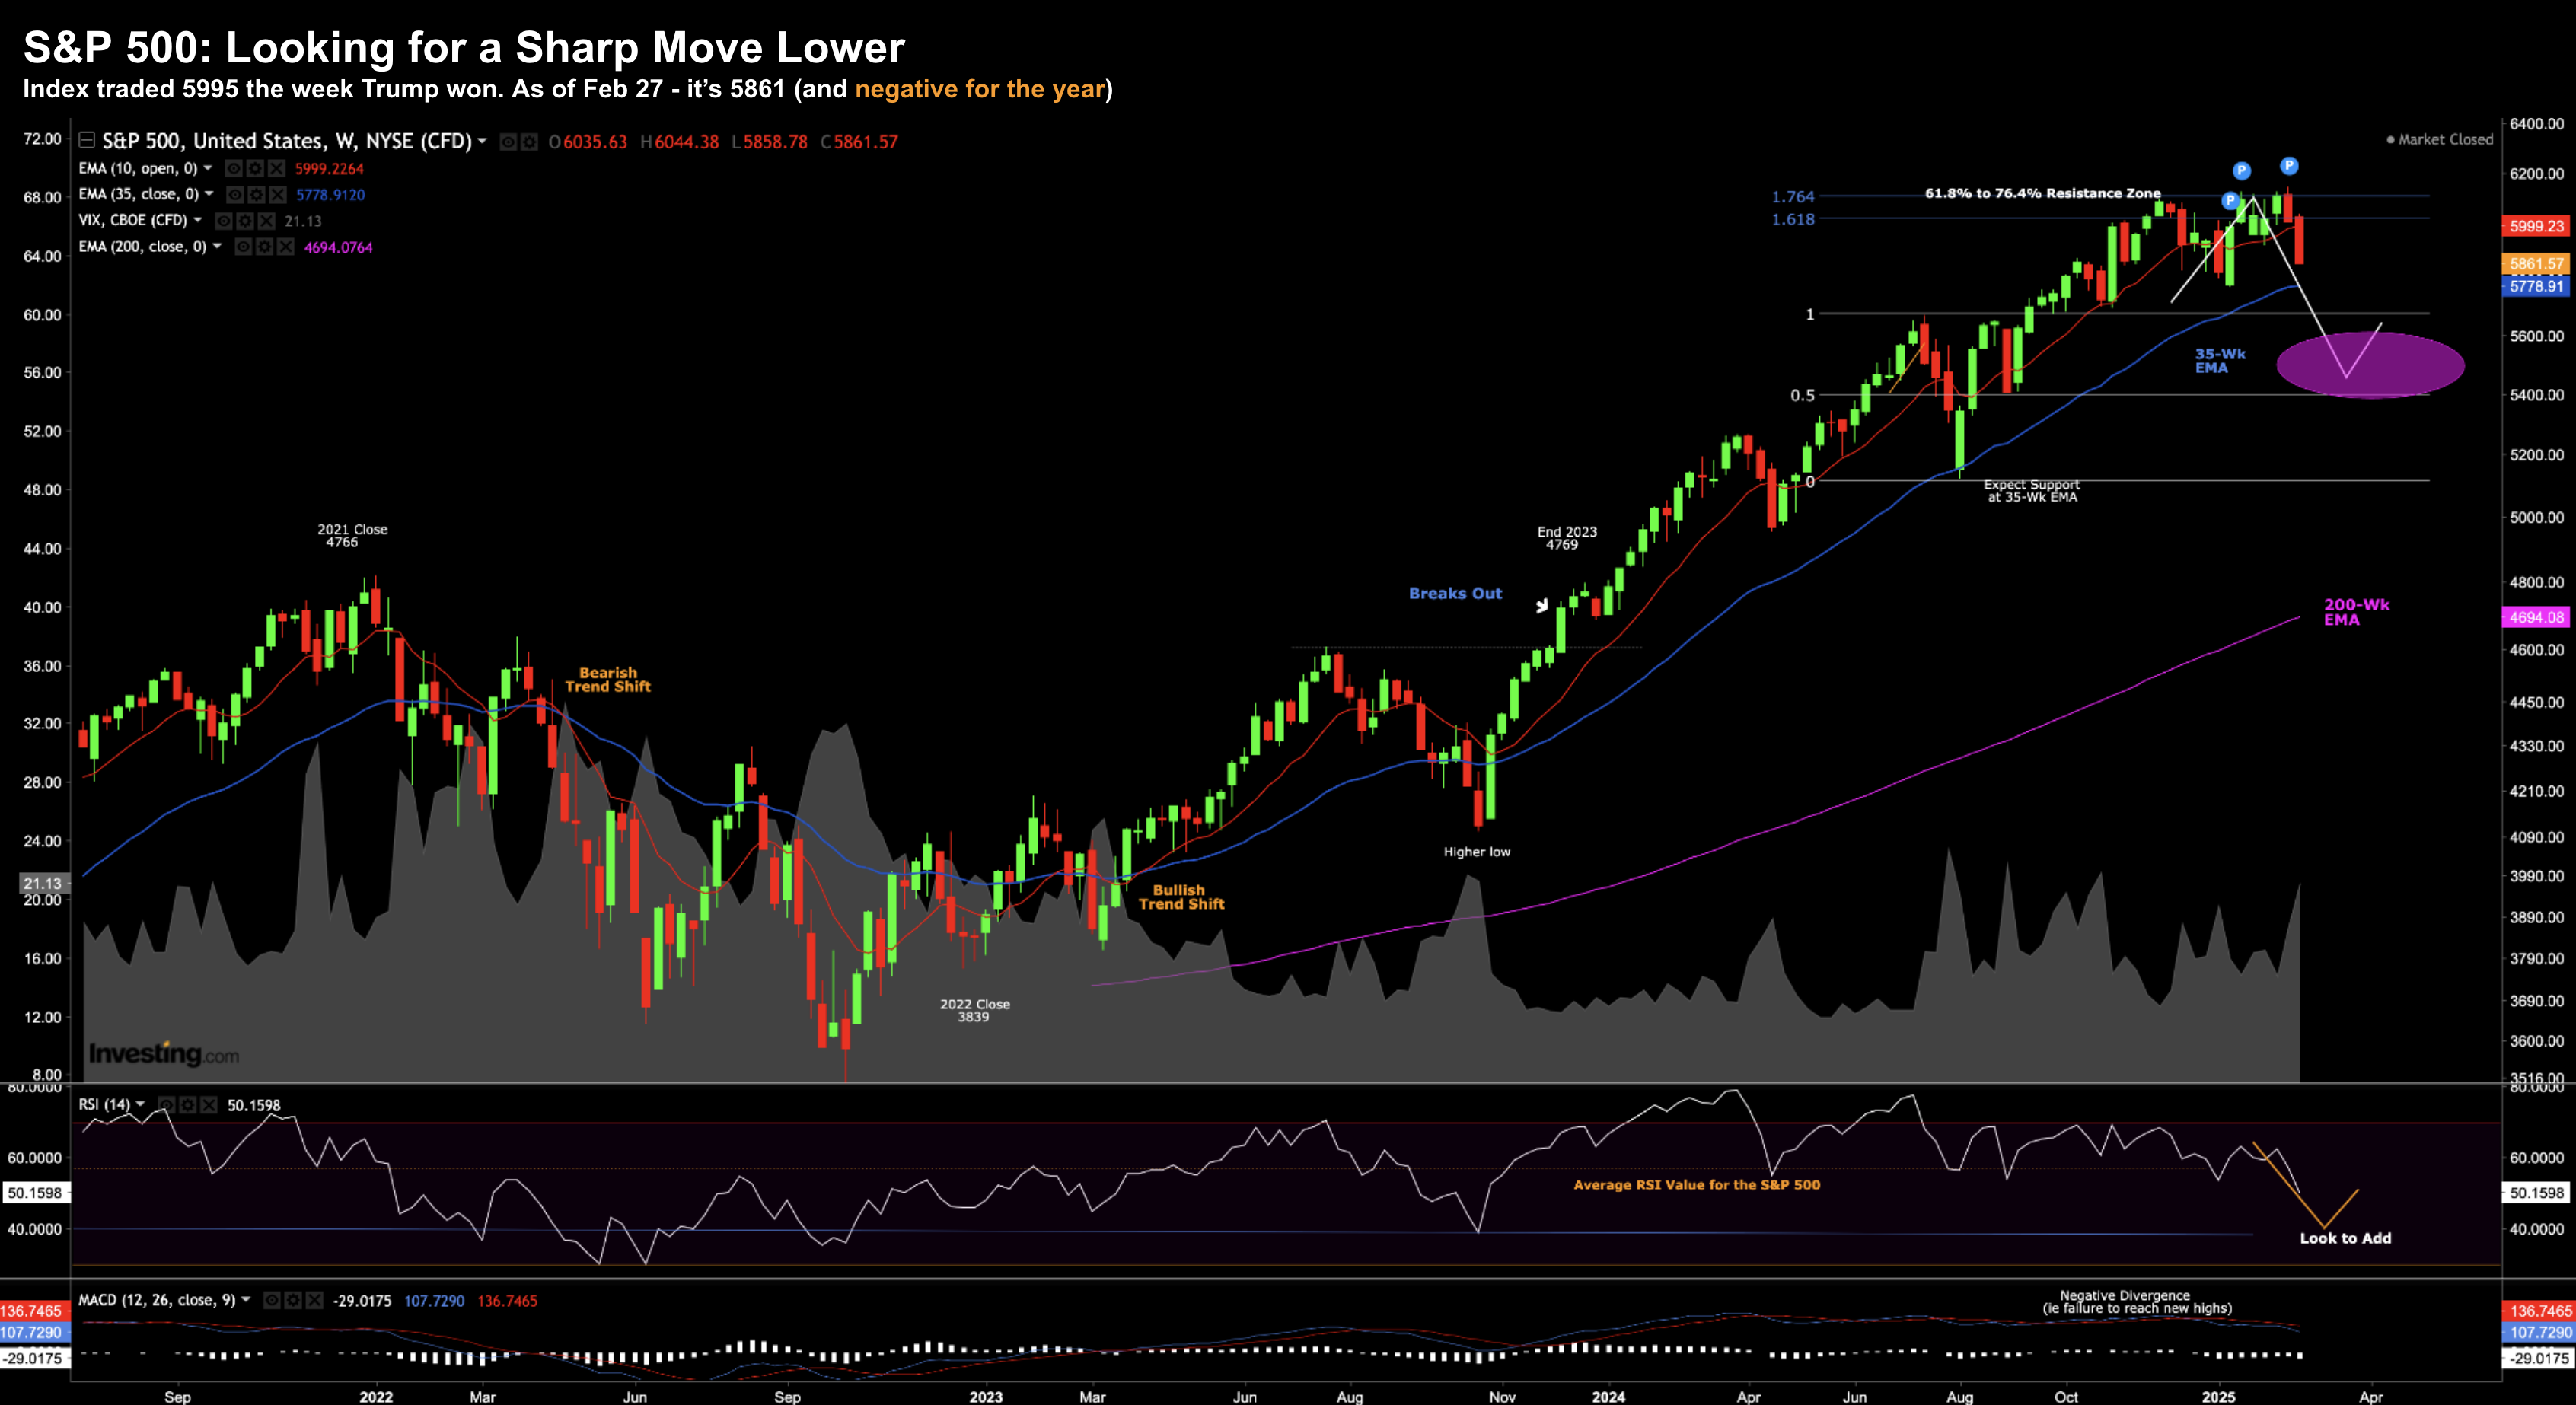
The Momentum Signal: Negative Divergence
Technical indicators like the Relative Strength Index (RSI) and Moving Average Convergence Divergence (MACD) are essential for gauging sentiment. We often see a "negative divergence" where the price hits a new high, but the indicators do not. This suggests that the momentum is fading—the bulls are exhausted.
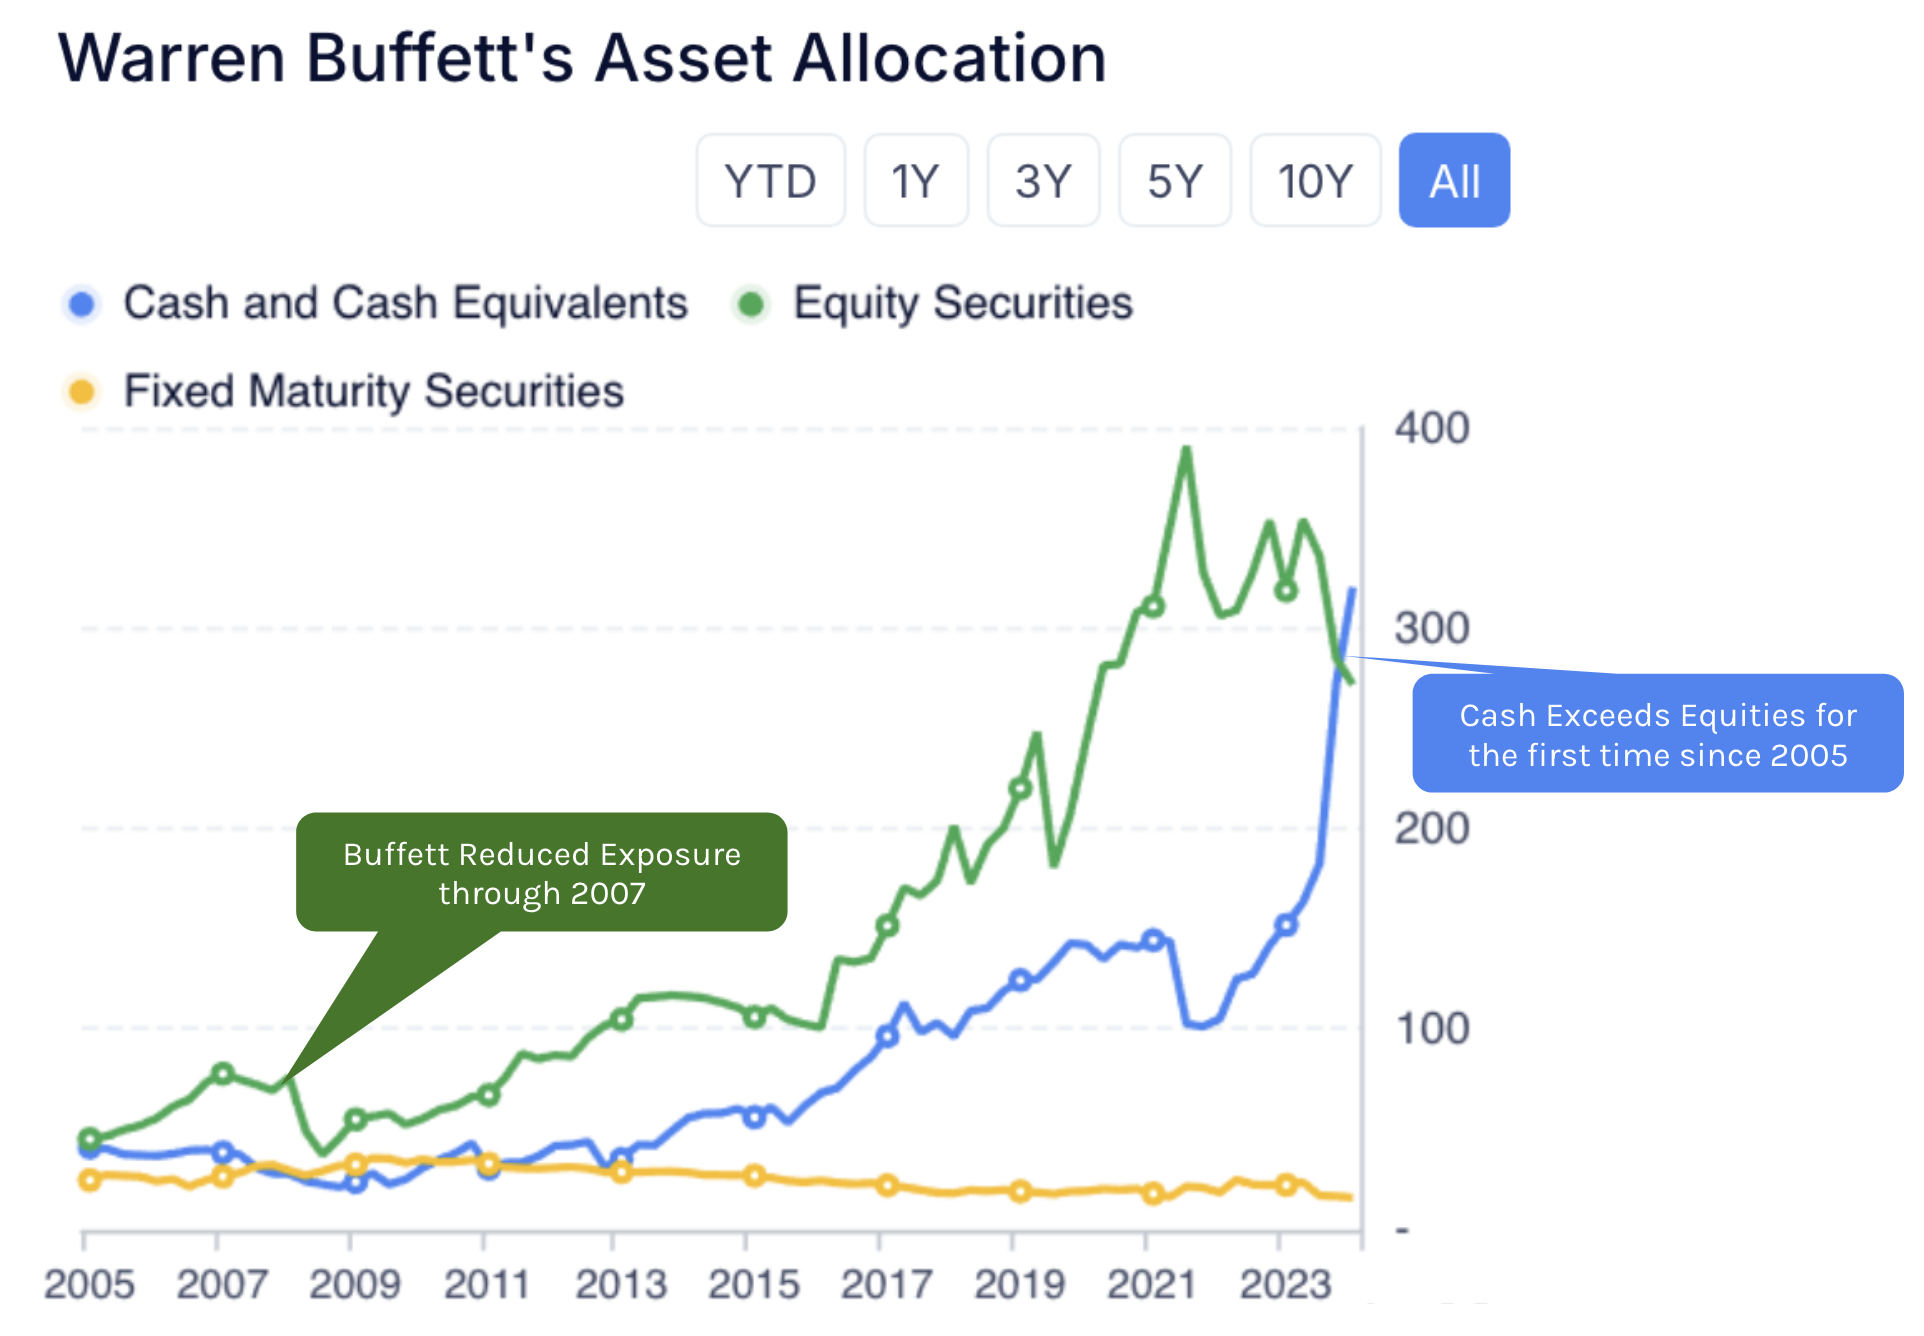
When you see a 4% to 8% dip in a high-flying name, it is rarely a "sell-off." It is often just the market coming back to its fundamental senses. As I have consistently noted, keeping "dry powder" (cash allocation) is the only way to capitalize when these high-quality names finally hit a compelling price.
Inversion: The "Overpayment" Path
If you want to ensure poor returns over the next decade, follow the crowd. Buy the most talked-about names at 50x cash flow just because the headline news is good. Ignore the Opportunity Cost of holding cash or short-term bills that may be paying a reliable 4%.
Successful investing requires the ability to watch pitches pass over the plate without swinging. As Warren Buffett noted, "often nothing looks compelling." If the market is trading at 22x forward earnings while the 10-year average is 18x, the mathematical gravity of Mean Reversion is working against you.
Conclusion: Patience Over Action
Nvidia will remain an essential part of the global infrastructure for years. But your return as an investor is dictated by your entry price. At 22x forward earnings for the broader market, we are closer to a peak than a trough. The intelligent move is to focus on quality metrics—high ROIC and FCF—and wait for the price to match the value. If you want to refine your strategy for these volatile periods, read my previous post: "Buffett: Often Nothing Looks Compelling."