Consumer Confidence Sinks… Can the Market Rebound?
Words: 1,119 Time: 5 Minutes
- Confidence falls off a cliff… I wonder why?
- Keep your eye on the quarterly YoY change in Real PCE
- Stocks caught a bid – but not much has changed
It was a roller-coaster week for stocks… maybe a hint of things to come?
As part of my "Buckle up Buttercup" post on March 10th – I concluded with:
The pathway down won"t be a straight line… expect many periods of sharp buying. In fact, I think we will see that soon
Right on cue… market"s bounced.
From mine, in the very short term, markets were deeply over-sold looking at its Relative Strength Index (RSI).
Often when you see the RSI below a value of 30 – buying isn"t too far away.
I"ll talk to this more later when I revisit the weekly chart for the S&P 500.
Now the last time stocks sank ~10% over a few days was 2020.
However, in the absence of any crisis, generally this will see both short covering and/or bargain hunting.
The bigger question is whether stocks can follow through?
I don"t think we draw that conclusion (although some already are)
But first, let"s take a look at the all important University of Michigan Consumer Confidence survey which hit the tape today.
It sank…
Confidence Plunges
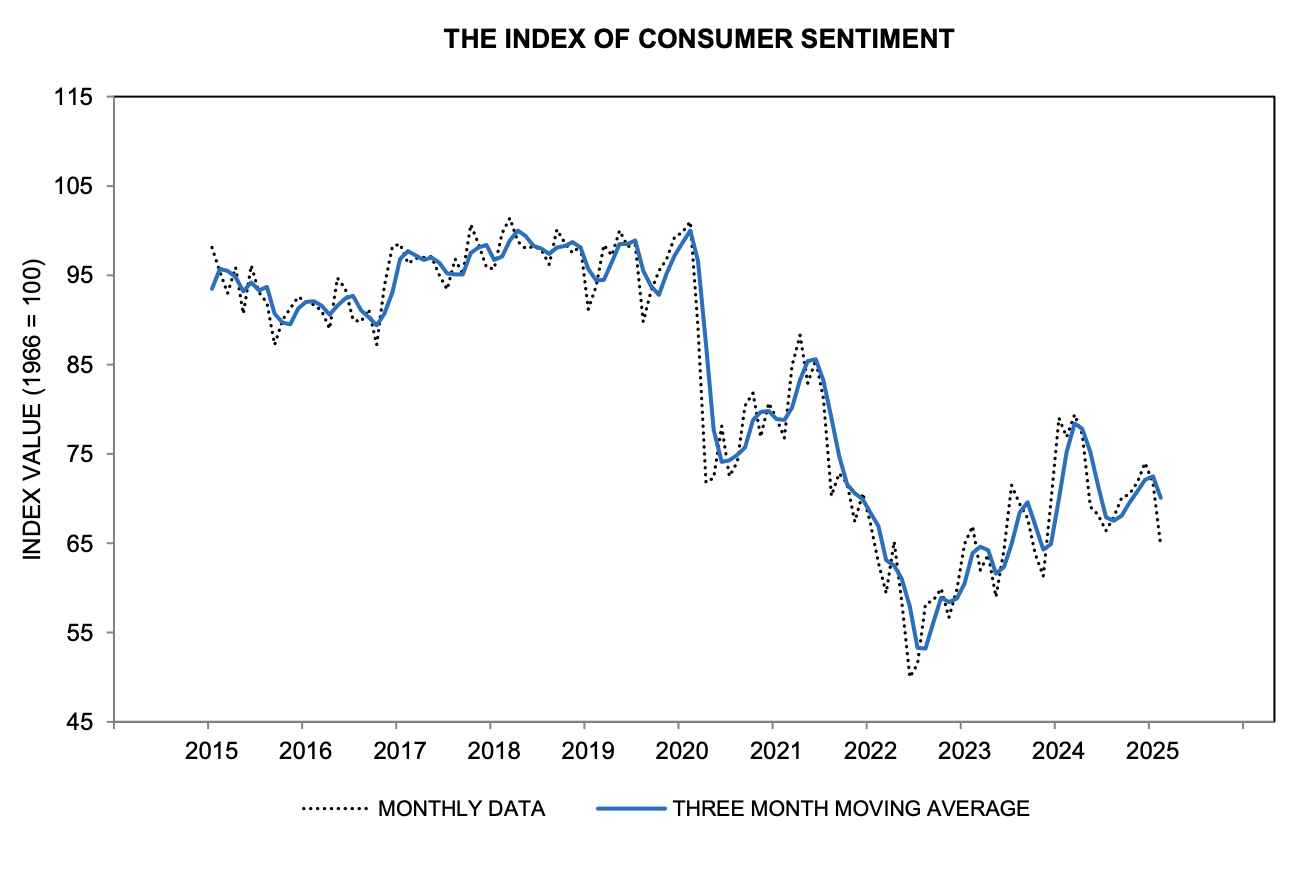
Regular readers will recall I was more interested in the University of Michigan Consumer Sentiment Index than CPI.
For example, CPI came in largely as expected – with Core CPI still above 3.0%
Markets were not moved.
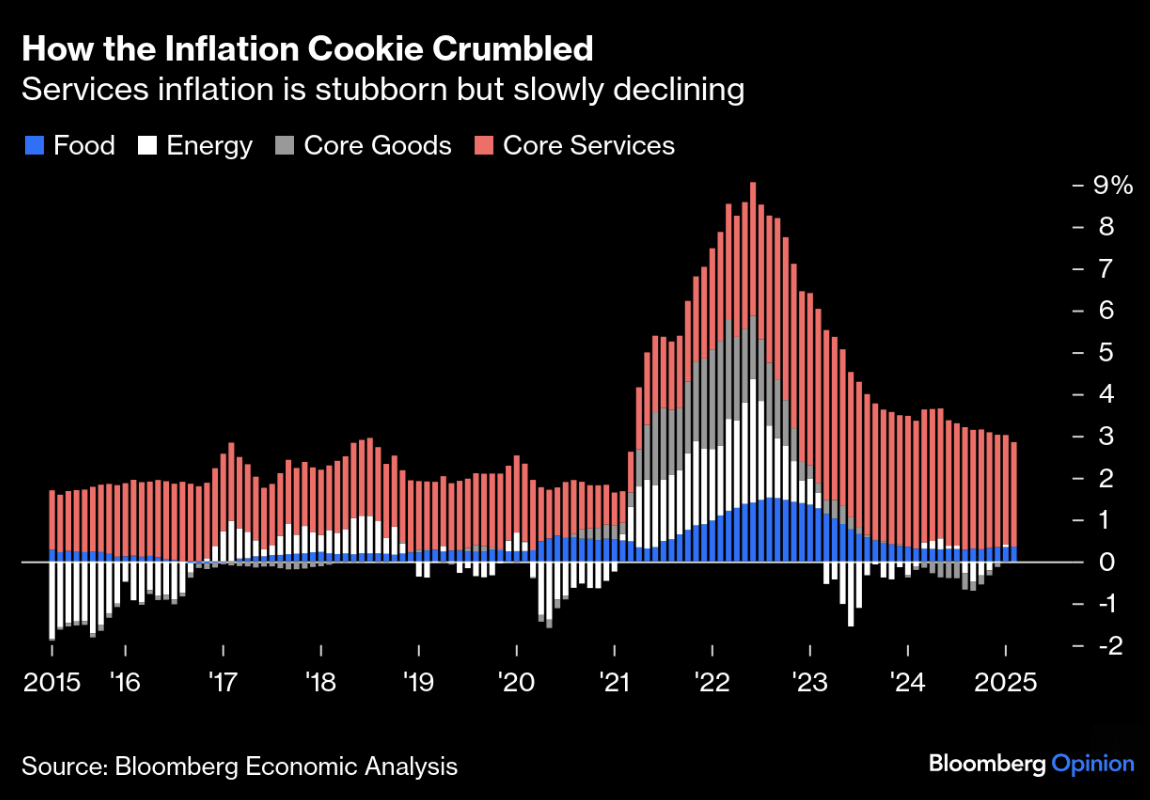
Inflation is proving very sticky and it"s entirely to do with services (as it has been for a very long time)

Energy, food and core goods have reverted to normalized levels.
However, wages and rents are far stickier – there will take longer to come down.
Yes, prices are falling, but very slowly.
It"s still at a level that"s too high for the Fed"s comfort — and swell above the inflation levels pre-COVID.
But again, this was expected.
With respect to consumer confidence for March – it plunged to 57.9 from 64.7
This was a significant drop below the consensus of 63.0

This sharp decline reflects heightened unemployment fears reminiscent of the 2007-2009 recession.
And it"s not surprising…
The uncertainty surrounding economic and fiscal policy – along with falling stock prices – will make consumers feel nervous.
And if they are nervous about losing their job – then watch for consumption growth to slow during the first quarter.
To me, that"s a bigger risk than inflation and tariffs put together.
Let me explain why….
Watching the Change in Real PCE
If you"re a long-term reader – my preferred leading economic indicator is measuring the yearly change in Real Personal Consumption Expenditure (PCE) on a quarterly basis.
It"s not employment, industrial production or capital spending.
And the reason is it all starts with the consumer (and how much they are spending)
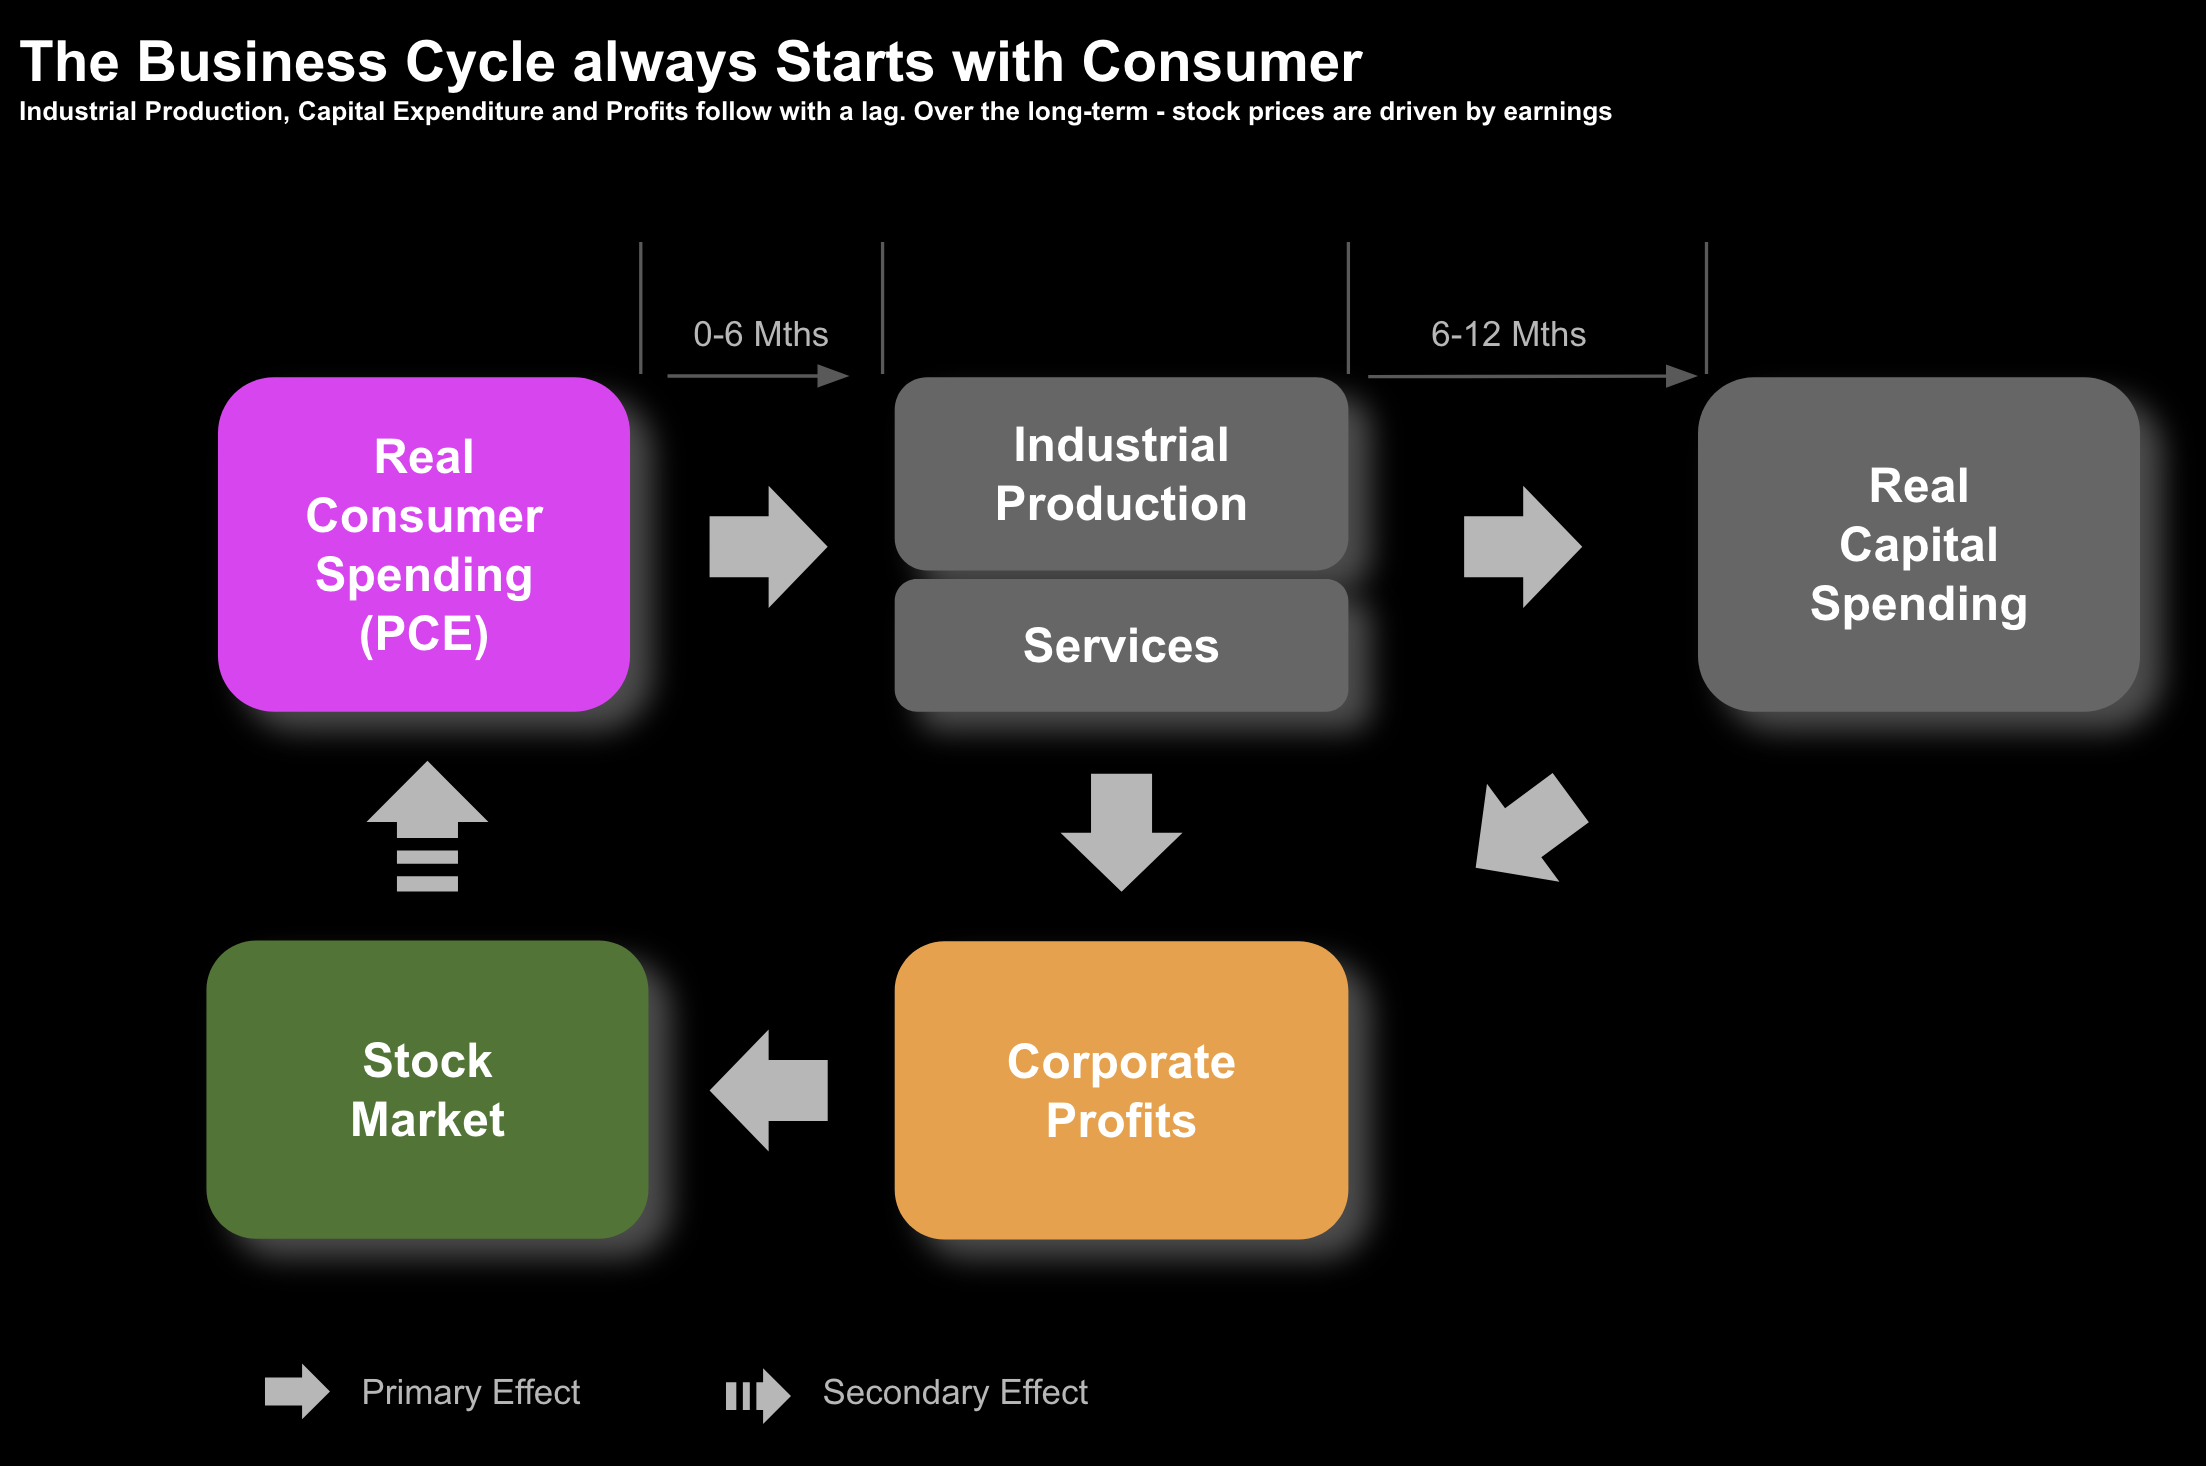
For example, in the past I shared this business cycle:

Source: "Ahead of the Curve: A Commonsense Guide to Forecasting Business and Market Cycles"
At the end of the day – consumer spend drives company profits.
And with company profits – we get further business investment.
This drives greater output – which in turns leads to more employment and so on.
Therefore, what we see with consumption (which is a function of confidence) is critically important.
To be clear, understanding the trend in Real PCE is not a panacea.
For example, many factors will influence the market during any particular period in time. For example, in the short-term they can include:
- Investor sentiment (e.g., fear, greed and bias)
- Geopolitical events (e.g., wars, elections)
- Fiscal and monetary policy (e.g. rate cuts, fiscal spending); and
- Valuations (e.g., multiple expansion and contraction)
However, over the long-term, investors are primarily interested in a company"s ability to generate earnings. That"s how the stock market is priced.
With that, take a look at the relationship between:
- Year-over-year changes in Real PCE on a quarterly basis (blue – left hand axis); and
- The year-over-year change in the S&P 500 (orange – right hand axis)

There"s a lot going on with this chart – so I will try to explain.
Between 2016 and 2024 – in red – I"ve labelled three occasions where the YoY % change in Real PCE was more than 2% on a quarterly basis (blue bars).
On each occasion – the market plunged 6-12 months later (orange bars)
I"ve also done this analysis back to ~1960 and the relationship holds true.
Now the most recent quarterly Real PCE data (Q4 2024) showed growth of 3.15%.
What"s more, this has been increasing the past few quarters (i.e., consumers maintained their level of spending)
As a result, earnings continued to grow and stock prices moved higher.
Now what I will be most interested in is whether we see Q1 2025 growth of at least 1.15% year-over-year in real terms.
In other words, I"m looking for a quarterly decline of at least 2.0% from Q4 to Q1
If we see this a figure below 1.15% for the quarter – then I will be forecasting a sharp slowdown in growth (which is my bias – as I shared here)
But here"s the thing:
We don"t need to experience a recession to see stocks decline in the realm of 20% or more.
For example, we a saw a sharp slowdown in consumption at the end of 2021 — and stocks went on to lose ~20% in 2022.
Stocks Catch an (Expected) Bid
Further to my preface, with stocks deeply oversold in the very short-term (e.g., using a daily chart) – we were going to see a sharp bounce.
As it turns out, today was that day.
But as I say, "one hot night doesn"t make a summer".
Let"s update the weekly chart…

March 14 2025
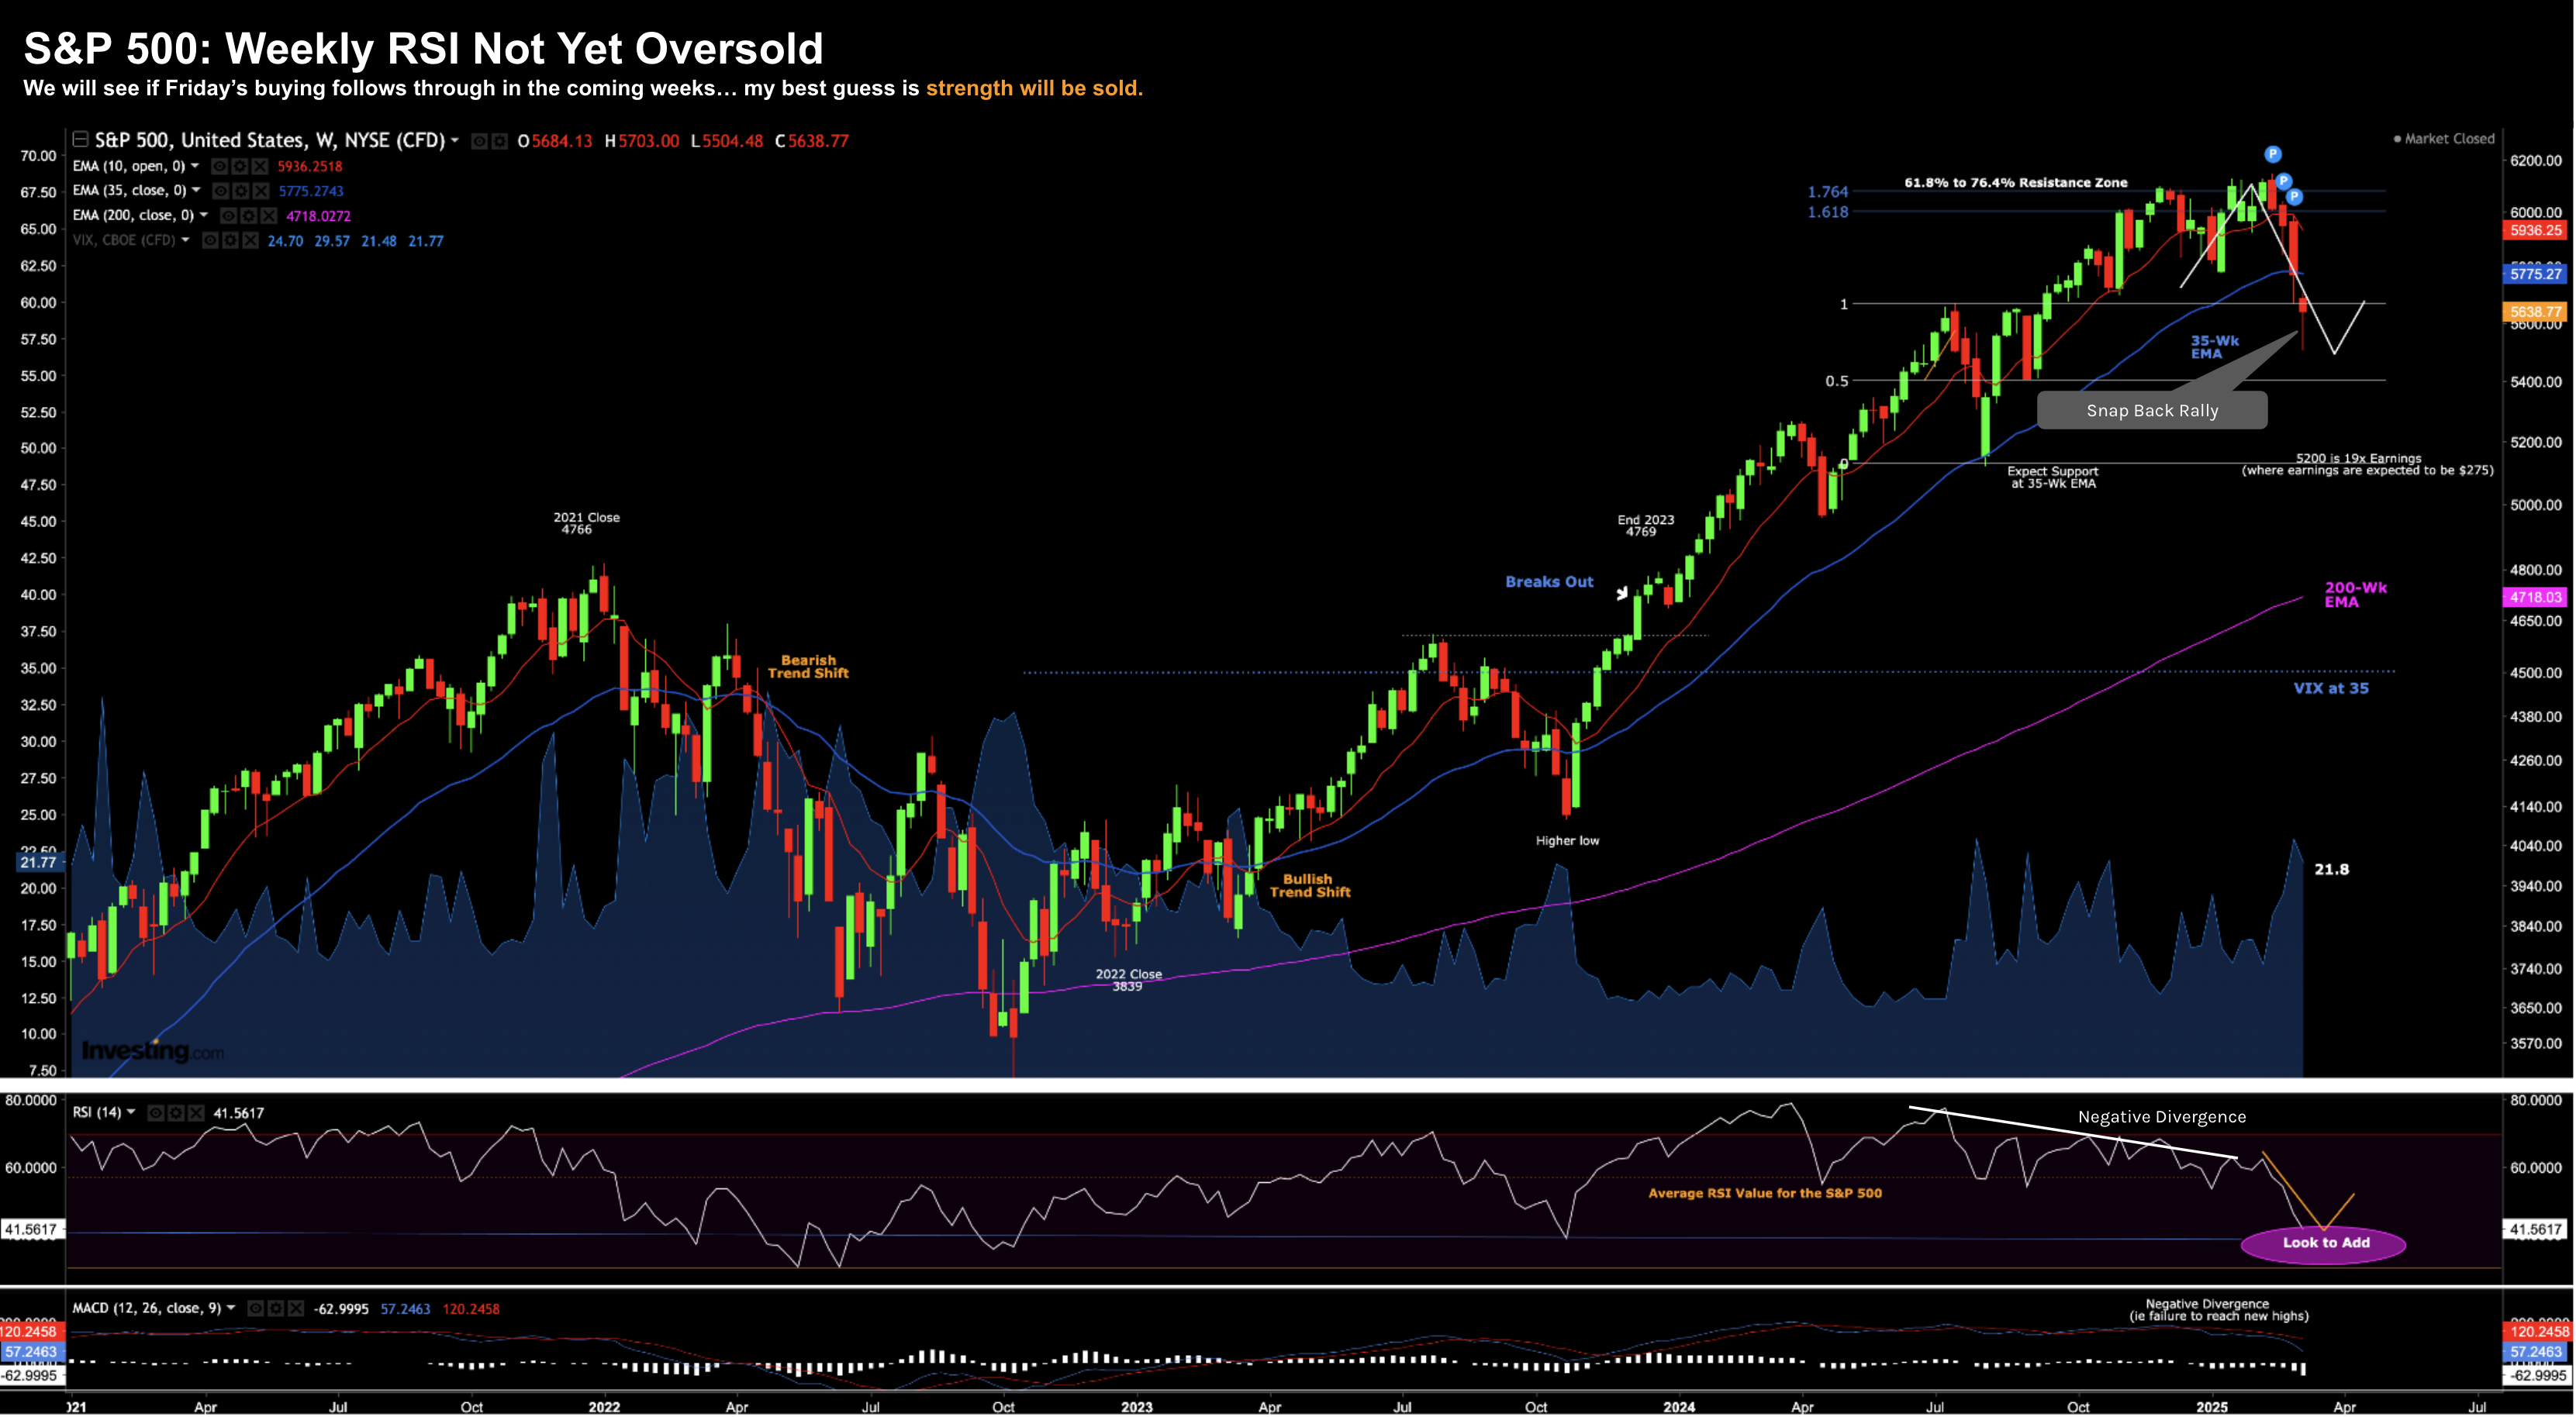
From my lens, not much has changed using the weekly chart.
This was the fourth consecutive negative week – however the weekly RSI is not yet in oversold territory.
Personally, I prefer to see this closer to 30 vs the value of ~41 today.
That said, I"m sure there were "bargain hunters" coming in today trying to pick a bottom.
I wasn"t one of them.
Now the market could rally further – as my white line suggests.
But I won"t read too much into that.
I think we need to see the S&P 500 close back above the 35-week EMA (around 5800) and hold that level.
I"m not holding my breath.
Putting it All Together
The other week I was telling readers about the folly of forecasting.
I shared a table showing the average EOY forecast – which is 6617.
That"s about 18% higher from here….
The most bearish of forecasts was 6000 from Cantor Fitzgerald…. who is now looking smart.
We will see how they go…
So here"s my prediction:
Start watching for these forecasts to come down (which only underscores my point about how futile they are)
For example, this week, David Kostin, chief US equity strategist at Goldman Sachs announced a revision from 6,500 to 6,200
That didn"t take long David! Less than 3 months?
He also reduced earnings estimates, and now expects 7% growth in profits this year, down from an original forecast of 9%.
This only increases the multiple being asked.
But Kostin won"t be alone…
These guys have a herd like mentality (as we saw with their grouped 2025 EOY forecasts) — therefore expect one revision lower after another.
What do you think my chances are?
Good thing we are at least "10 steps" ahead of them.
