The V-Shaped Recovery: Assessing the Fundamental Foundation
Words: 1,346 Time: 6 Minutes
- The critical distinction between a temporary truce and a structural trade deal.
- Why V-shaped recoveries historically require a massive monetary or fiscal catalyst.
- Technical resistance: Why the risk of a reversal now outweighs the potential for further gains.
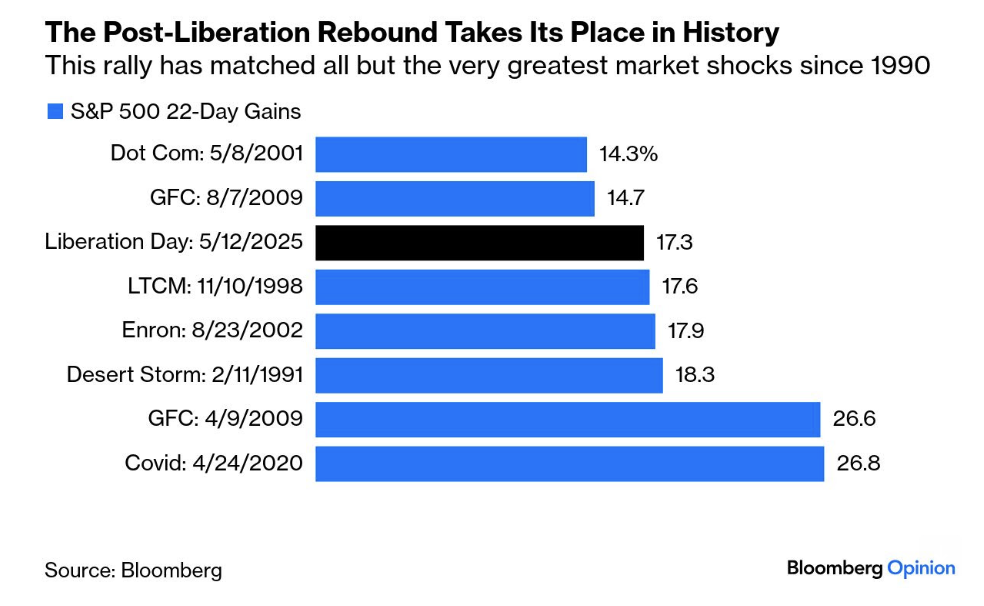
Equity markets recently staged an explosive "short-squeeze" rally following the news of a 90-day pause on the proposed 145% tariffs on Chinese imports.
The reaction was swift: the S&P 500 surged 3.3% while the Nasdaq Composite jumped 4.4%. Over the last month, this move ranks as one of the most aggressive vertical recoveries we have seen in three decades. As Bloomberg Opinion notes:
While the price action is impressive, we must look at the underlying drivers:
- Relations with China have seen a "temporary de-escalation" with a 90-day agreement to freeze new tariff hikes.
- A 30% baseline tariff remains in effect—representing a significant jump from previous levels.
- China has reciprocated by reducing its own retaliatory tariffs from 125% to 10%.
- The administration has signaled a desire for further talks, suggesting that the 145% "nuclear option" may be off the table for now.
However, a pause in hostilities does not equal a definitive trade agreement. Neither side has made permanent concessions; this is simply an agreement to stop and talk. While many are hoping that common sense will eventually prevail, we must ask: how much structural damage has already been inflicted on the economy?
The Mirage of Tariff Optimism
The rally was heavily concentrated in large-cap technology. Apple led the charge with a 6% gain, pulling the broader sector up by nearly 5%. We also saw significant moves in consumer discretionary and communication services, largely driven by the "Magnificent Seven" cohort.
Simultaneously, the U.S. Dollar Index climbed 1.6% to 101.90, reinforcing the case for a sustained period of dollar strength (see "Strong Dollar Rally Ahead?").
Perhaps most importantly, 10-year bond yields have surged back toward 4.50%. Investors should remain vigilant here—historically, when yields move above 4.50%, equity valuations begin to feel the pressure of higher capital costs.
Looking at the technical landscape, the S&P 500 has rallied sharply off its recent 20% peak-to-trough decline:
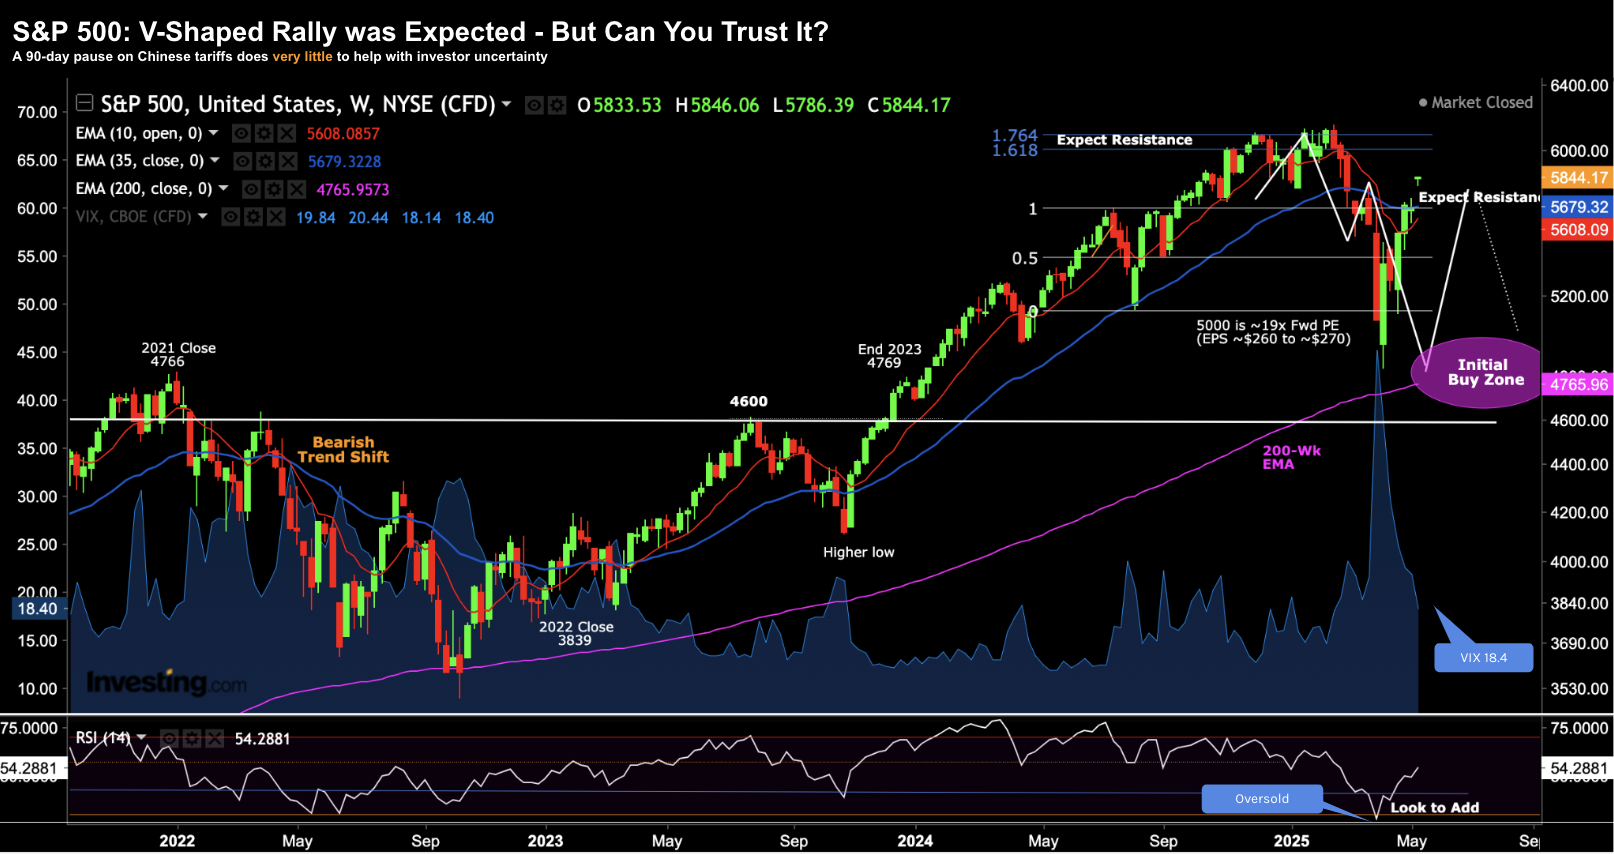
Technical Analysis: May 2025
This bounce was anticipated as the market reached a deeply oversold state near the 4800 level. Here is why that zone was significant:
- The S&P 500 corrected down to its 200-week Exponential Moving Average (EMA)—a historically reliable area for a technical "relief bid."
- The weekly RSI fell below 30, indicating that selling pressure had reached an exhaustive extreme.
- The initial target for this bounce was the 5700 zone (the 35-week EMA), where we expected to find significant overhead resistance.
We are currently trading slightly above 5800, but the trend has suffered meaningful technical damage. If the market fails to hold the 35-week EMA (the blue line), it would be a clear bearish signal. I expect the market to enter a volatile trading range rather than a sustained new bull leg.
To maintain a level above 6,000, the market requires more than just a "pause"—it needs concrete deal specifics. If those details aren"t forthcoming in the next 60 days, expect these gains to evaporate. We must remember:
- The 30% baseline tariff is still inflationary. Higher costs for Chinese goods will eventually flow into the CPI, which Apple has already warned will impact iPhone pricing.
- Persistent inflation limits the Federal Reserve"s ability to cut rates. The three or four cuts the market has priced in for this year are now at risk.
- Ongoing trade uncertainty forces U.S. businesses to delay major investment decisions, which inevitably stifles long-term growth.
But the most significant reason for skepticism lies in the lack of a coordinated policy response.
The Missing Catalyst: Monetary & Fiscal Absence
Historically, a 20% vertical recovery in a matter of weeks is almost always fueled by aggressive monetary intervention or significant fiscal stimulus. This usually involves "money printing" (Quantitative Easing) or emergency interest rate cuts of 100 basis points or more.
Today, we have neither. Chair Powell has clearly moved the Fed into a reactive, "wait-and-see" posture due to the inflationary risks posed by tariffs. Simultaneously, the fiscal side is focusing on reducing government spending via the Department of Government Efficiency (DOGE).
While cutting wasteful spending is a long-term positive, it acts as a short-term headwind to GDP growth. When you combine a restrictive Fed with a contracting fiscal impulse and tariffs that are still 20% higher than they were in January, the environment remains challenging.
Furthermore, the damage to "Brand USA" and global trade relationships is not easily repaired. If major trading partners begin to accelerate their efforts to bypass the U.S. Dollar, the long-term consequences for capital flows could be severe.
Sustainable V-shaped recoveries typically require:
- A decisive dovish pivot from the Federal Reserve.
- A meaningful injection of liquidity into the financial system.
A 30% tariff is not a stimulus—it is an economic headwind.
Strategic Conclusion
Some analysts are viewing this rally as a total vindication of "negotiation by tariff." I believe that conclusion is premature for three reasons:
- Growth Headwinds: Even if tariffs stay at 30%, it represents the largest increase in costs for U.S. consumers since the 1960s. This will weigh heavily on disposable income and retail spending.
- The Fed"s Dilemma: The central bank cannot proactively fight a slowdown if it is simultaneously battling tariff-induced inflation.
- Fiscal Contraction: The reduction in government borrowing and spending will act as a drag on GDP in the immediate term.
On balance, these factors are net negatives for equity valuations. Early estimates suggest these headwinds could shave 2% to 3% off total GDP growth.
The only thing that could sustain this rally is a return to aggressive monetary easing. If the market corrects toward the 4500 level, it may finally trigger the "Fed Put." Until we see a definitive monetary response to the economic damage, investors should treat this rally as a technical bounce within a broader period of uncertainty.