INVESTCON 5: Trimming Growth and the Calculus of Value
Words: 2,665 Time: 12 Minutes
- Howard Marks defines price vs value (and its intersect)
- Lighten aggressive positions and get more defensive
- Arguing the bull case
Last week Howard Marks posted another timeliness memo – "The Calculus of Value" – read it here.
He talks about the difference between value and price.
It"s very important to know the difference. If you don"t – you will almost certainly lose money.
In my experience, more people focus too much on price and less on value (much to their detriment).
For example, they may see "Apple has dropped from $250 to $190" – therefore Apple is now considered "cheap"
But that"s simply the price. It doesn"t answer whether $190 represents value.
Price is what you pay. Value is what you get.
Those who don"t understand this will often lose money – even if buying the highest quality asset.
Below is a summary of Marks" key points:
- Value is rooted in an asset"s "earning power"—its ability to generate cash flows now and in the future. For companies, this earning power comes from both tangible assets (like land or equipment) and intangible ones (like patents, management skill, or reputation). Management"s role is to combine these assets to create synergy that exceeds their individual contributions. Some assets, however, such as art or collectibles, lack earning power and can only be priced subjectively, based on demand.
- Price, by contrast, is concrete and determined in markets by the balance of optimism and pessimism among investors. While finance theory says an asset"s price equals the present value of future cash flows, in practice psychology dominates. Optimists push prices above value, while pessimists drag them below. Thus, prices fluctuate far more than underlying values, creating opportunities and risks.
- In the short run, markets act like a voting machine—reflecting popularity—while in the long run they behave like a weighing machine, reflecting true value. Successful investing comes from accurately assessing value, buying at a reasonable price, and recognizing that psychology often drives prices away from fundamentals
If you"re familiar with his writing (and my blog) – this concept is nothing new.
Here are two related posts (here and here) which might be helpful
Marks reminds us that whether you are evaluating a stock, house, bond or credit instrument – it requires judgment.
Educated judgement requires work.
"If the value of a company, for example, is multivariate and confusingly unquantifiable, it obviously can be very hard to assess the fairness of its price at a point in time.
Equity investors deal with this challenge by looking primarily – often almost exclusively – at a stock"s PE ratio, or the ratio of a company"s share price to the amount of earnings attributable to each share of its common stock"
Why do most investors do this?
For one it"s easy (and fast) to calculate the PE ratio for one stock or the average for a stock market or index.
But it"s also a very lazy (rarely helpful) metric. It"s what I call a thumbnail check (at best).
Using this very crude measure – investors often jump to conclusions as to whether the asset is overpriced, fairly priced, or underpriced given those considerations.
However as Marks reminds us – basing an investment decision on a single metric (such as PE ratio) represents a vast oversimplification of the decision, and thus dramatically introduces the possibility of error.
Here"s a post where I describe how I assess both quality and value (note – PE ratios are not involved)
Before I move on today – this diagram (from Marks") does a good job of the role investment sentiment plays as the market shifts between optimism and pessimism.

In practice, it"s human psychology which dominates.
Optimists push prices above value (point "d"); while pessimists drag them below (point "a").
Thus, prices fluctuate far more than underlying values, creating opportunities and risks.
So Where Are We Today?
Regular readers know that I don"t think there is (compelling) value in most stocks today (especially the broader Index). Read this post for a reminder.
In fact, I think investors are best served to trim more aggressive positions (those who trade at higher multiplies) and add to more defensive positions.
This has been my posture all year.
Toward the end of last year, the S&P 500"s forward PE ratio (the ratio of its price to its estimated earnings over the coming year) was between 22x and 23x
That is well above its 100-year average of 15.5x; and notably higher than its 10-year average of 18x.
Stocks were far from cheap.
Marks highlights that at the time, J.P. Morgan published a graph showing that if you bought the S&P 500 index at 23 times the coming year"s earnings per share in the period 1987-2014 (the only period for which there"s data on forward-looking PE ratios and resulting ten-year returns), your average annual return over the subsequent ten years was between plus 2% and minus 2% every time.
Put another way – well below the long-term 10.5% total return average for the Index (which includes an average 2.5% dividend).
To the extent this measure is relevant, it bodes poorly for the S&P 500.
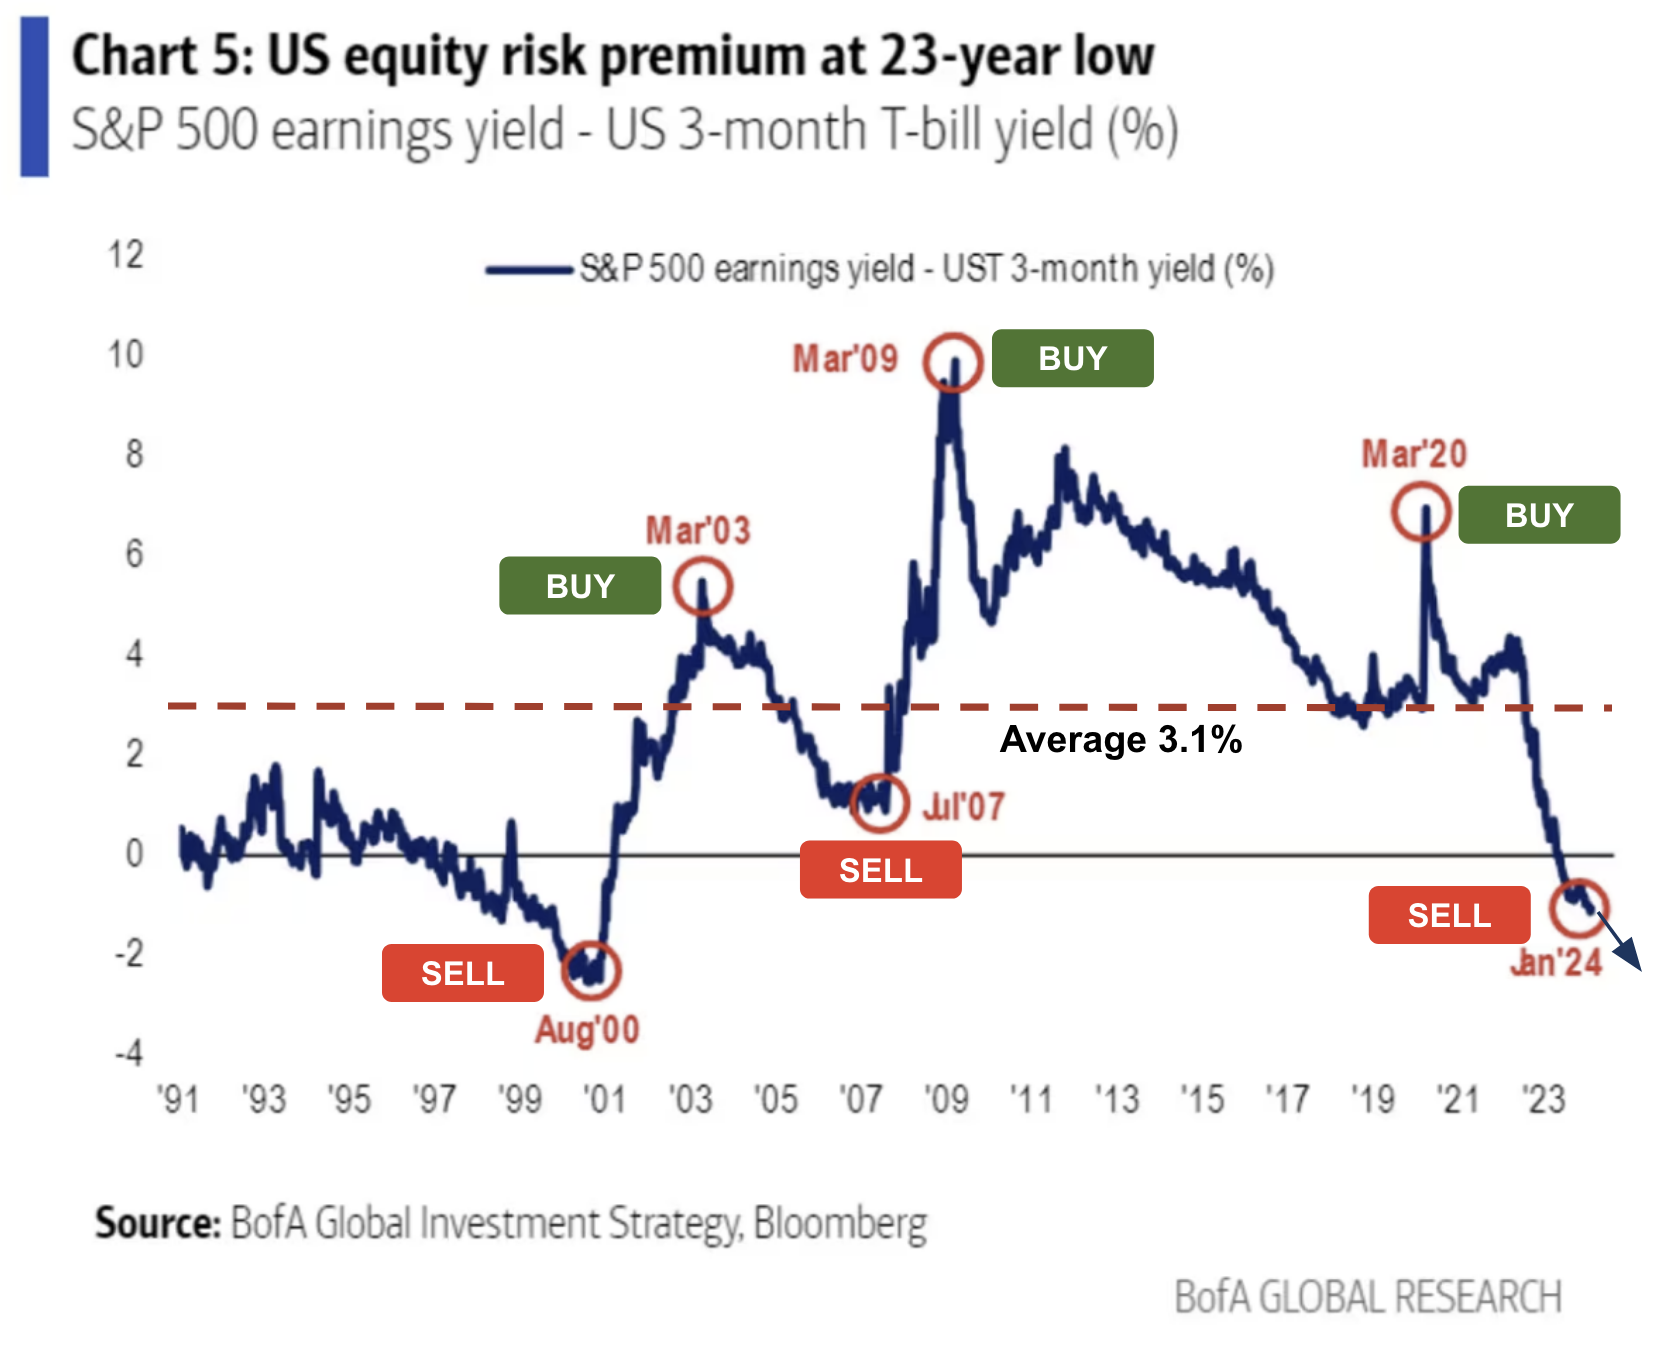
Another metric to consider is the (lack of) equity risk premium investors are being paid. Today that is around 0% (see this post from May this year).
Much like the example above, this also bodes poorly for future returns (as BoA"s chart shows)
As Marks says – its investor psychology which dominates in the near-term.
And it"s fundamentals over the long-run.
Since the lows of April – investors have pushed prices up around 30% – which puts the S&P 500 around 9.6% year-to-date
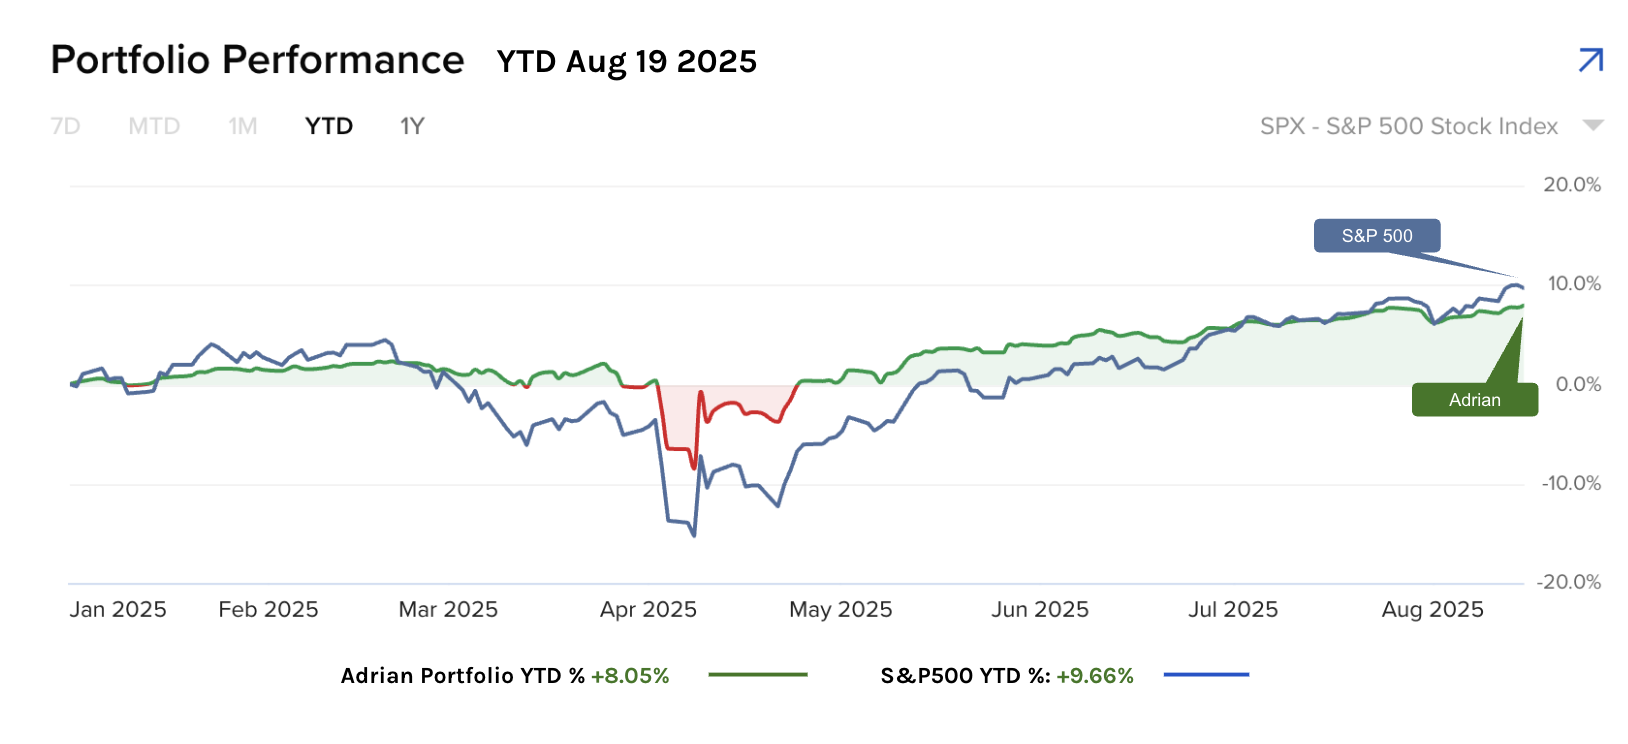
Adrian Portfolio (green) vs the S&P 500 Year-to-Date 2025
And hopefully you maintained "some" exposure to higher quality names…
According to Marks – most of the 30% rally is due to:
- the tariff picture (thus far) is less bad than was feared;
- investors are encouraged by expectations of rising earnings;
- the tax and spending bill that being passed;
- the prospect of potential rate cuts from the Fed; and
- the potential of artificial intelligence to add to companies" earning power.
But what can we say about the price/value calculus?
Afterall, that"s what matters. Are are getting value?
Marks comments that the S&P 500 was highly valued at the end of 2024 and also just before the tariff announcement.
That said, more than 35% of the S&P"s valuation is a function of (inflated) tech stocks – which trade at very high multiples.
An aside regarding the valuation of the S&P 500: A bit over half of its jaw-dropping 58% two-year total return in 2023-24 was attributable to the spectacular performance of just seven stocks, those of the so-called "Magnificent Seven" – Apple, Microsoft, Alphabet, Amazon, Meta Platforms, Nvidia, and Tesla.
He adds that rising inflation is still a concern (where producer price inflation is now at its highest level in 3 years)
But it remains to be seen whether the threat of higher inflation has reduced the likelihood of the early stimulus?
We will hear more from the Fed minutes this week.
Marks adds that the U.S. fiscal deficits and national debt show no sign of improvement, and worldwide concern over them seems to be increasing (which will likely drive bond yields (and rates) higher)
Nevertheless, with the outlook possibly diminished on balance, U.S. stock prices are up.
So what are the indicators of investor behavior and the resulting price/value relationship?
According to Marks, the forward PE ratio of 23x is the tentpole of the argument that valuations are optimistic.
- According to the Financial Times (July 25), "Stocks in the S&P 500 are now valued at more than 3.3 times their [companies"] sales, according to Bloomberg, an all-time high."
- "A Barclays "equity-euphoria indicator," a composite of derivative flows, volatility and sentiment, has surged to twice its normal level, into territory associated with asset bubbles."
Warren Buffett"s favorite indicator – the ratio of the aggregate market capitalization of U.S. stocks to U.S. GDP – is also at an all-time high.
It"s especially worth noting that the U.S. market cap has been restrained by companies" tendency to wait longer these days before going public and by the fact that many companies have been taken private in buyouts.
Thus, this elevated indicator could be even more troubling than it appears.
The current relationship between the yield on the 10-year U.S. Treasury note and dividend yield on the S&P 500 shows the latter to be expensive in historical terms.
Finally, yield spreads – the amount of incremental yield investors demand if they"re going to give up the safety of Treasury securities and buy corporate debt for its higher yields – are approaching all-time lows and are less generous than earlier this year.
So why are we here?
In short, Marks" believes that investors are naturally optimistic.
And that makes sense… you would not be optimistic if you felt you were not going to get a handsome return on your (risk) capital.
Fear of Missing Out (FOMO)
If you are well into your 50s (like me) – you"ve experienced two nasty prolonged bear markets.
- The dot.com bust of 2000 (where I learned valuation lessons the hard way); and
- The global financial crisis of 2008
But if you"re under the age of ~35 – it"s likely you"ve never experienced a prolonged bear market.
COVID was not a prolonged bear market.
It"s hard to think it"s been around 17 years since we had to challenge value.
For almost two decades, investors could simply "buy the dip" and given a little time, prices rise.
Today the reaction is like Pavlov"s Dog… they hear the bell ring (i.e. stock prices dip)… and they come running.
What"s more, today we are seeing FOMO return – not unlike what we see during the late 1990s.
I"ve had people tell me they want to get more exposure to "AI" – asking me what stocks they should buy.
Why are they asking this question?
Simple – the fear of missing out.
They are not concerned by the possibility that valuations are considered very high; and likely to produce poor returns or even losses.
According to them, the bigger risk is not owning a "Palantir" or "Crowdstrike" etc etc (it"s a long list)
So what"s Marks" bottom line of the calculus? I quote:
- Fundamentals appear to me to be less good overall than they were seven months ago, but at the same time, asset prices are high relative to earnings, higher than they were at the end of 2024, and at high valuations relative to history
He adds that most bull markets are built through the addition of a "constellation of positives" on top of a well-functioning economy.
Today I see elements that include the following:
- the positive psychology and "wealth effect" resulting from recent gains in markets, high-end real estate, and crypto;
- the belief that, for most investors, there really is no alternative to the U.S. markets; and
- the excitement surrounding today"s new, new thing: AI.
Arguing the Bull Case
Whilst Marks believes valuations are high – where the upside reward does not handily offset the downside risks – he is prepared to argue the other side.
He quotes John Stuart Mill (1859): "He who knows only his own side of the case knows little of that."
In other words, if you"re not conversant with the arguments of those who oppose your position, you really can"t assess its validity.
Here"s how Marks sees the bull case:
- A PE ratio is basically the result of applying a discounted cash flow calculation to a stream of earnings.
- The main inputs for performing such a calculation and assigning a valuation are assumptions regarding the earnings" growth rate, durability, and return on invested capital.
- Compared to the past, today"s S&P 500 is increasingly made up of companies that (a) grow faster, (b) are less cyclical, (c) require less incremental capital to grow, enabling them to generate more free cash flow, and (d) have much stronger competitive positions or "moats."
- Thus, they deserve above average PE ratios (e.g., an average of around 33x for the Magnificent 7 vs 22x for the other 495 stocks)
And Marks says this makes sense… as these are (mostly) world-class businesses which deserve a higher than average market multiples (e.g., due to their cash flows; debt levels; return on invested capital; profitability ratios and competitive moats)
But investors should bear three things in mind:
- the enormous likelihood that AI and related developments will change the world
- the possibility that it is "different" for some companies – those that truly embody the factors listed above and will demonstrate the "persistence"; and
- the fact that in most "new, new things," investors tend to treat far too many companies – and often the wrong ones – as likely to succeed.
And whilst none of this pretends to assume the current bull market will correct anytime soon (timing is very hard to predict) – it"s fair to say the market has moved from "elevated" to "worrisome."
And it"s not just Marks… here"s OpenAIs CEO and co-Founder Sam Altman:
From CNBC earlier today:
"Are we in a phase where investors as a whole are overexcited about AI? My opinion is yes"
"Is AI the most important thing to happen in a very long time? My opinion is also yes"
AI will transform everything we do. It will accelerate and re-wire human ingenuity.
And I"m speaking as someone who who has worked in the field of AI (including machine learning and computer vision) the past ten years.
But that doesn"t mean you should pay too much.
What to Do?
When valuations get this stretched by almost every measure – it"s time to play stronger defense.
That doesn"t mean rush out and sell everything – not at all.
It means trimming your exposure and looking at companies where the value looks more attractive (e.g. healthcare looks better to me after a strong correction)
Marks" offered a useful analogy:
The Pentagon sometimes announces a Defense Readiness Condition, starting at DEFCON 5 and escalating as the danger grows to DEFCON 1 (e.g., a nuclear attack is imminent).
In a similar vein, I think of progressively applying the following Investment Readiness Conditions, or INVESTCONs, in the face of above average market valuations and optimistic investor behavior:
6. Stop buying
5. Reduce aggressive holdings and increase defensive holdings
4. Sell off the remaining aggressive holdings
3. Trim defensive holdings as well
2. Eliminate all holdings
1. Go short
In my view, it"s essentially impossible to reasonably reach the degree of certainty needed to implement INVESTCON 3, 2, or 1.
Because "overvaluation" is never synonymous with "sure to go down soon," it"s rarely wise to go to those extremes. I know I never have.
But I have no problem thinking it"s time for INVESTCON 5.
And if you lighten up on things that appear historically expensive and switch into things that appear safer, there may be relatively little to lose from the market continuing to grind higher for a while . . . or anyway not enough to lose sleep over.
This is where I am – INVESTCON 5 – reducing aggressive holdings and increasing defensive holdings.
I don"t think we need to sell off all remaining aggressive holdings (e.g., I maintain a ~65% long exposure) – but we should be on alert.
One More Chart to Consider…
Before I wrap up – here"s a 40-year log chart showing the rising trend channel for the S&P 500.
Here we can see where stocks were driven optimism (above the rising trend channel); and fear (lower trend channel)
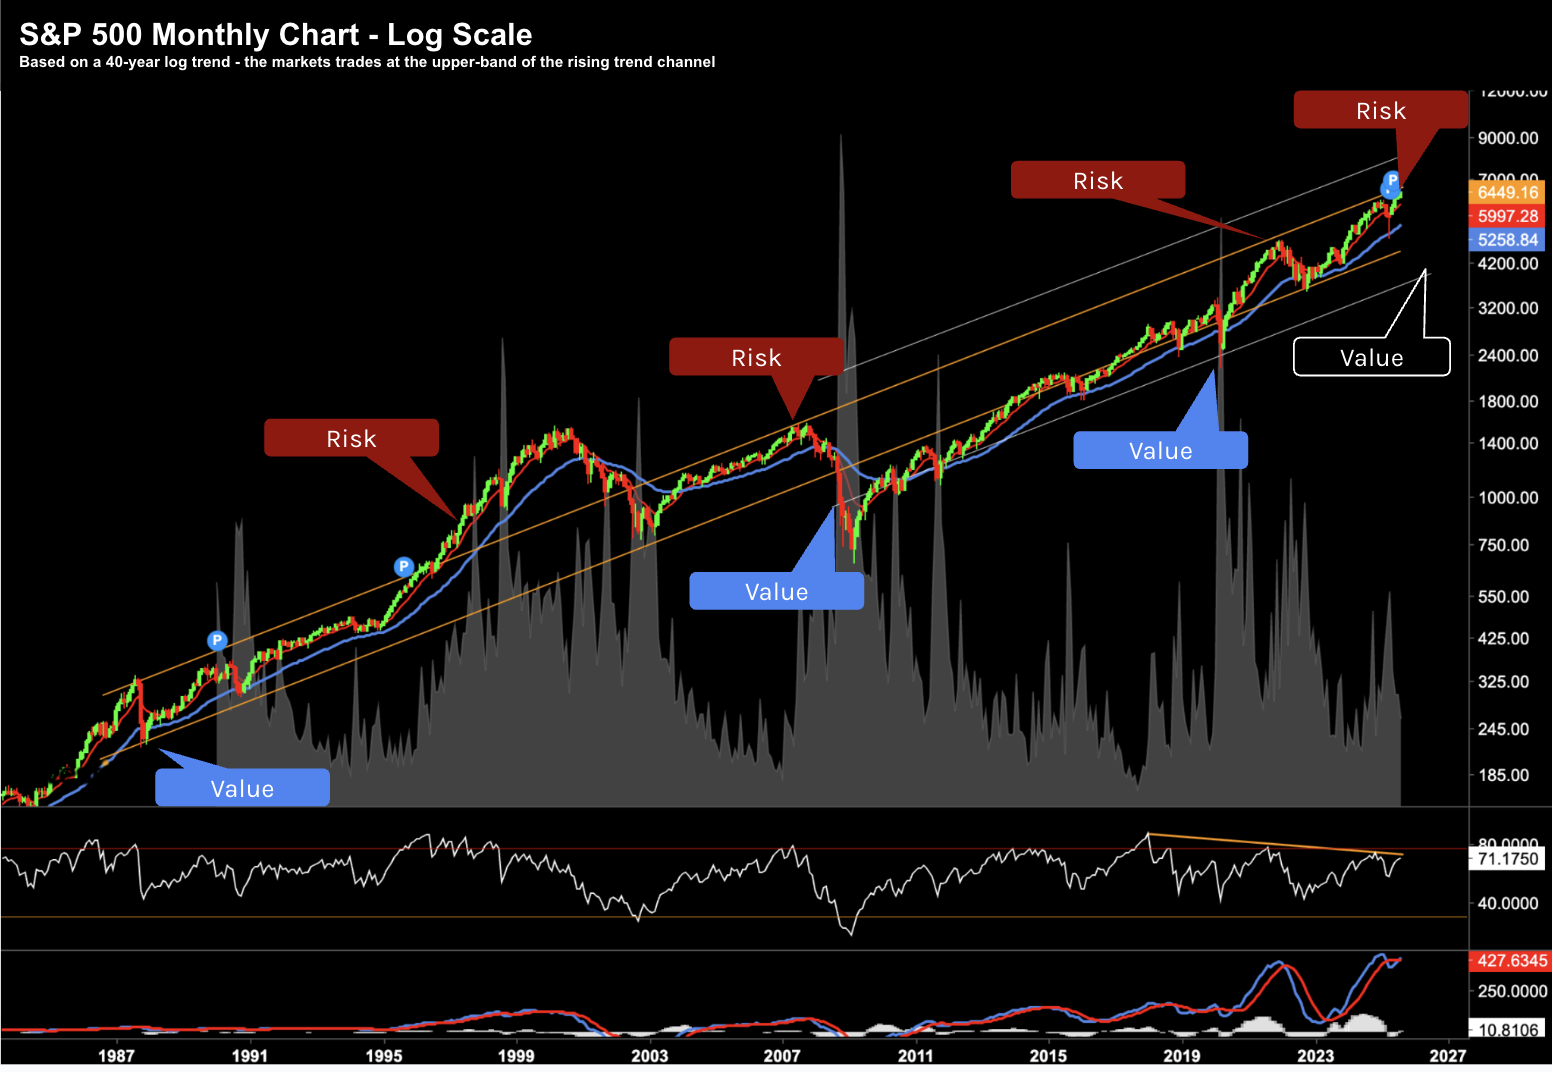
In short, buying at (or above) the orange line has not yielded strong returns for investors.
For example, look at what we saw during 1987, 1997 > 1999, 2006/07 and 2020.
On the contrary, buying at (or below) the lower orange trend line rewarded investors.
The years 1999/2000 and 2008/09 were extreme events (on both sides).
Using this trend line, anything around 4600 to 4800 starts to represent a better risk/reward bet.
For example, with forward earnings expected to be ~$285 (assuming 12% YoY earnings growth) – that represents a forward PE in the realm of 16x to 17x
Putting It All Together
Much of Marks" latest memo simply reiterates the sentiment of my missives this year.
But he also does a great job of explaining the difference between price and value.
Today participants are fixed on price… far less mindful of the value they"re getting.
Optimism (greed) is driving their decisions.
They see the bigger risk as not owning "AI stocks".
But FOMO is a powerful force. And it could take the market higher yet… I don"t pretend to guess.
But that"s not important.
I said to the someone the other day if the market goes up another 10-15% here – I could not care. I am more concerned it could halve and have too much exposure to over-valued names.
In other words, I think the greater risk is to the downside.