Capital Destruction: Why 23x Forward Earnings is the ‘Magnetic Center’ for the AI Bubble
Words: 2,217 Time: 10 Minutes
- How do you know you"re in a bubble?
- Bubbles are easy in hindsight – but you can take protective steps
- What history tells us when paying 23x fwd earnings
Investor enthusiasm around the promise of artificial intelligence (AI) reminds me of what we experienced ~30 years ago.
Circa 1995 it was the internet transforming everything we did.
It was a great time to be an investor.
Fast forward to today and it"s AI accelerating human ingenuity in ways most people could barely imagine ten or so years ago.
I was privileged to work at Google (based in San Francisco) over the past 10 years – giving me a front row seat with AI – focused on developing leading edge tech such as computer vision (e.g. Google Lens) and machine learning.
As a quick aside, I remember being "blown away" when we had self-driving prototypes driving around the Mountain View campus.

2016: Self-Driving Cars at Google"s Mountain View Campus
Today, the streets of San Francisco (and several other US cities) are filled with self-driving Waymo vehicles.
It"s crazy to think these self-driving cars have now achieved 10M rides.
But this is only one example of the incredible advancements made with AI.
The list is long and growing…
But when I swap my engineering hat for that of an AI investor – it requires a different lens.
It"s less a question of understanding where the tech is going and what it can do (something I am very passionate about) – it"s about focusing on the economics.
For example – questions which come to mind include (certainly not limited to)
- What are the business models?
- How will it be monetized?
- What is the (long-term) macroeconomic consequences on GDP and human labor?
- How do we value these AI companies scaling infrastructure and their moats? and of course
- How do we know if we"re in an early stage AI bubble – where capex vastly exceeds consumption?
Yes, there will be some big winners with AI (just as we saw from the Internet).
Google, Amazon, Meta, Microsoft, Salesforce and numerous others have all fully capitalized on the explosive growth of the web.
But for every "Google" – how many did not make it?
For example, I remember being an active user of tools such as Altavista, Looksmart, Lycos, Excite, AskJeeves and Metacrawler.… but what happened to them?
They all became extinct. And investors lost a lot of money.
My best guess is shift with AI will be similar…
Let"s explore…
Bubbles Are Easy in Hindsight
Looking back – it"s easy to see we were in a bubble during the late 90s with tech stocks.
But when you are in it – it can be less obvious.
These companies were creating the future… it was hard not to be involved.
Now many of you reading will be quick to argue that what we see with AI is not even close to a bubble — nothing like what we saw ~30 years ago.
And you might be right.
For example, you could argue that leading AI companies "only" trade for mid-30x their forward earnings – well below the 50x multiples tech leaders commanded in the late 90s.
You might also rightfully argue it"s different this time (perhaps the four most dangerous words with investing) – as these leading companies are enormously profitable – growing their revenue by double-digits in most cases at incredible margins.
Yes… many are.
Consider the poster child of AI – Nvida (NVDA).
Below are some Trailing Twelve Month (TTM ) financial health (and growth) metrics:
- Enterprise Value: +66.7% YoY
- Revenue per share- +72.9% YoY
- Net Income per share: +64.7% YoY
- Operating Cash Flow Per Share: +59.1% YoY
- Free Cash Flow per share: +54.5% YoY
- ROIC: 21.38% TTM
- ROE: 26.48% TTM
Very few companies could boast similar numbers (especially at their scale). But what do you pay for such quality?
- Trailing PE: 53.0x
- Price To Sales: 28x
- P/FCF Ratio: 63.6x
- Price to Book: 45.6x
- EV/EBITDA: 45.84x
- FCF Yield: 1.58%
Whilst the quality of NVDA is second to none – the asking price is extremely high.
For example, three valuation metrics which have me asking questions as to the longer-term (4+ year) risk reward:
- P/FCF of 64x;
- Price to Sales at 28x; and
- EV/EBITDA at 46x.
Just last week, Nvidia CEO Jensen Huang announced a $100 billion investment in OpenAI.
Is this a shrewd long-term investment by Nvidia? Or did they overpay?
Hindsight will tell us.
If I was to bet… it"s the latter (i.e., they just tore up a lot of capital).
Billionaire hedge-fund manager David Einhorn remains skeptical.
Speaking on a panel discussion hosted by Signify Asset Management – the Greenlight Capital founder warned that the hundreds of billions of spending earmarked for AI infrastructure may demolish enormous amounts of capital, even if the technology transforms society.
Echoing my preface, Einhorn is not talking about the profound impact this will likely have (again, very few question that).
However, that does not mean hundreds of billions (potentially trillions) might be wiped off in value.
Noting the planned unprecedented investments of companies like Meta Platforms (META), Apple (AAPL) and OpenAI, Einhorn questioned whether "spending a trillion dollars a year or 500 billion a year" will deliver good outcomes for the firms.
That"s the question. Here"s Einhorn:
"The numbers that are being thrown around are so extreme that it"s really, really hard to understand them.
I"m sure it"s not zero, but there"s a reasonable chance that a tremendous amount of capital destruction is going to come through this cycle."
Einhorn"s questioning of investor"s "ambitious assumptions" about the efficacy of AI-based capex dovetails with his belief that markets are not functioning properly.
In January, for example, he pointed to the amount of money chasing esoteric crypto assets as evidence of a sustained inefficient allocation of capital, saying we may be in "the fartcoin stage of the market cycle."
That"s in reference to the memecoin created last year that surged to over $1 billion in market value.
Beyond this, Einhorn warned that faltering U.S. job growth signaled an economic contraction may be coming.
"I"m a little bit more of the view that we"re heading into or have been in a recession… Jobs aren"t growing and the workweek is shrinking and productivity is not that great"
Howard Marks supports Einhorn"s views — recently suggesting the stock market is in the "early days of a bubble".
However, he is not yet ringing alarm bells for an immediate correction.
Marks suggests a "reversion to the mean" is likely and recommends adding defensive positioning and considering investments in credit rather than equities (see this related post)
When Capex Outpaces Consumption
Let"s try and unpack more of what Einhorn is saying…
Capital Expenditure (CapEx) is essential for growth and innovation.
But when investment in new capacity outpaces actual consumption for a sustained period, the result is often a painful market correction (i.e. Marks" reversion to the mean)
The current AI infrastructure spending boom among large-cap tech companies vividly illustrates this risk, as we are effectively witnessing a modern-day arms race in cloud data centers, chips, and software (e.g., NVDA"s $100B investment into OpenAI)
Yes, investing in the future is critical to maintaining competitive advantage in AI.
Again, few of us will question that….
But on the other hand – excessive CapEx without matching demand risks building an oversupplied market.
History repeatedly shows that when CapEx surges ahead of consumption, it creates cyclical booms that end in painful corrections.
For example, in the early phase of a technology-driven boom, high demand supports elevated prices and margins (just look at Nvidia"s financial health metrics shared earlier)
Companies eagerly invest in new capacity — data centers, manufacturing plants, networks — to capitalize on growth. But inevitably, oversupply emerges.
From there, new capacity floods the market.
What happens next?
Prices fall, margins shrink, and companies scale back CapEx sharply.
This is where weaker and highly leveraged players disappear, while stronger survivors consolidate their positions.
But this process can take several years.
Again, Marks makes the point that this correction is unlikely to be imminent.
But timing is generally elusive.
Everything Mean Reverts
Marks" premise (which I agree with) is the market will (at some point) revert to the mean.
But what is "the mean"?
The historical average for stock price multiples is:
- ~15x over 100 years; and
- ~18x the past 10 years.
Today we"re trading somewhere between 22x and 23x forward earnings (pending on what you believe EPS will be next year) – which is ~5x handles above the 10-year mean.
As Marks suggests – the mean serves as the magnetic center of all cycles. Think of it like a gravitational pull.
But let"s consider the two figures I supplied above…
If earnings are to grow 12% next year to around $280 per share (which is Goldman Sachs" latest view) – applying a 16x multiple puts as around 4500 (i.e., ~32% below today"s asking price).
That"s a rough estimate around what (extreme) mean reversion could be.
I"ve looked at the price history of every asset class— stocks, bonds, currencies, commodities, property—and there is not one which has not reverted to its mean over time.
Therefore, it"s my view that whatever happens in the economy (and/or with tech such as AI) – there will be mean reversion.
But not only will things mean revert – they will over-shoot. The reality of bubbles is they almost always over-correct.
Marks demonstrates the cycle this way:
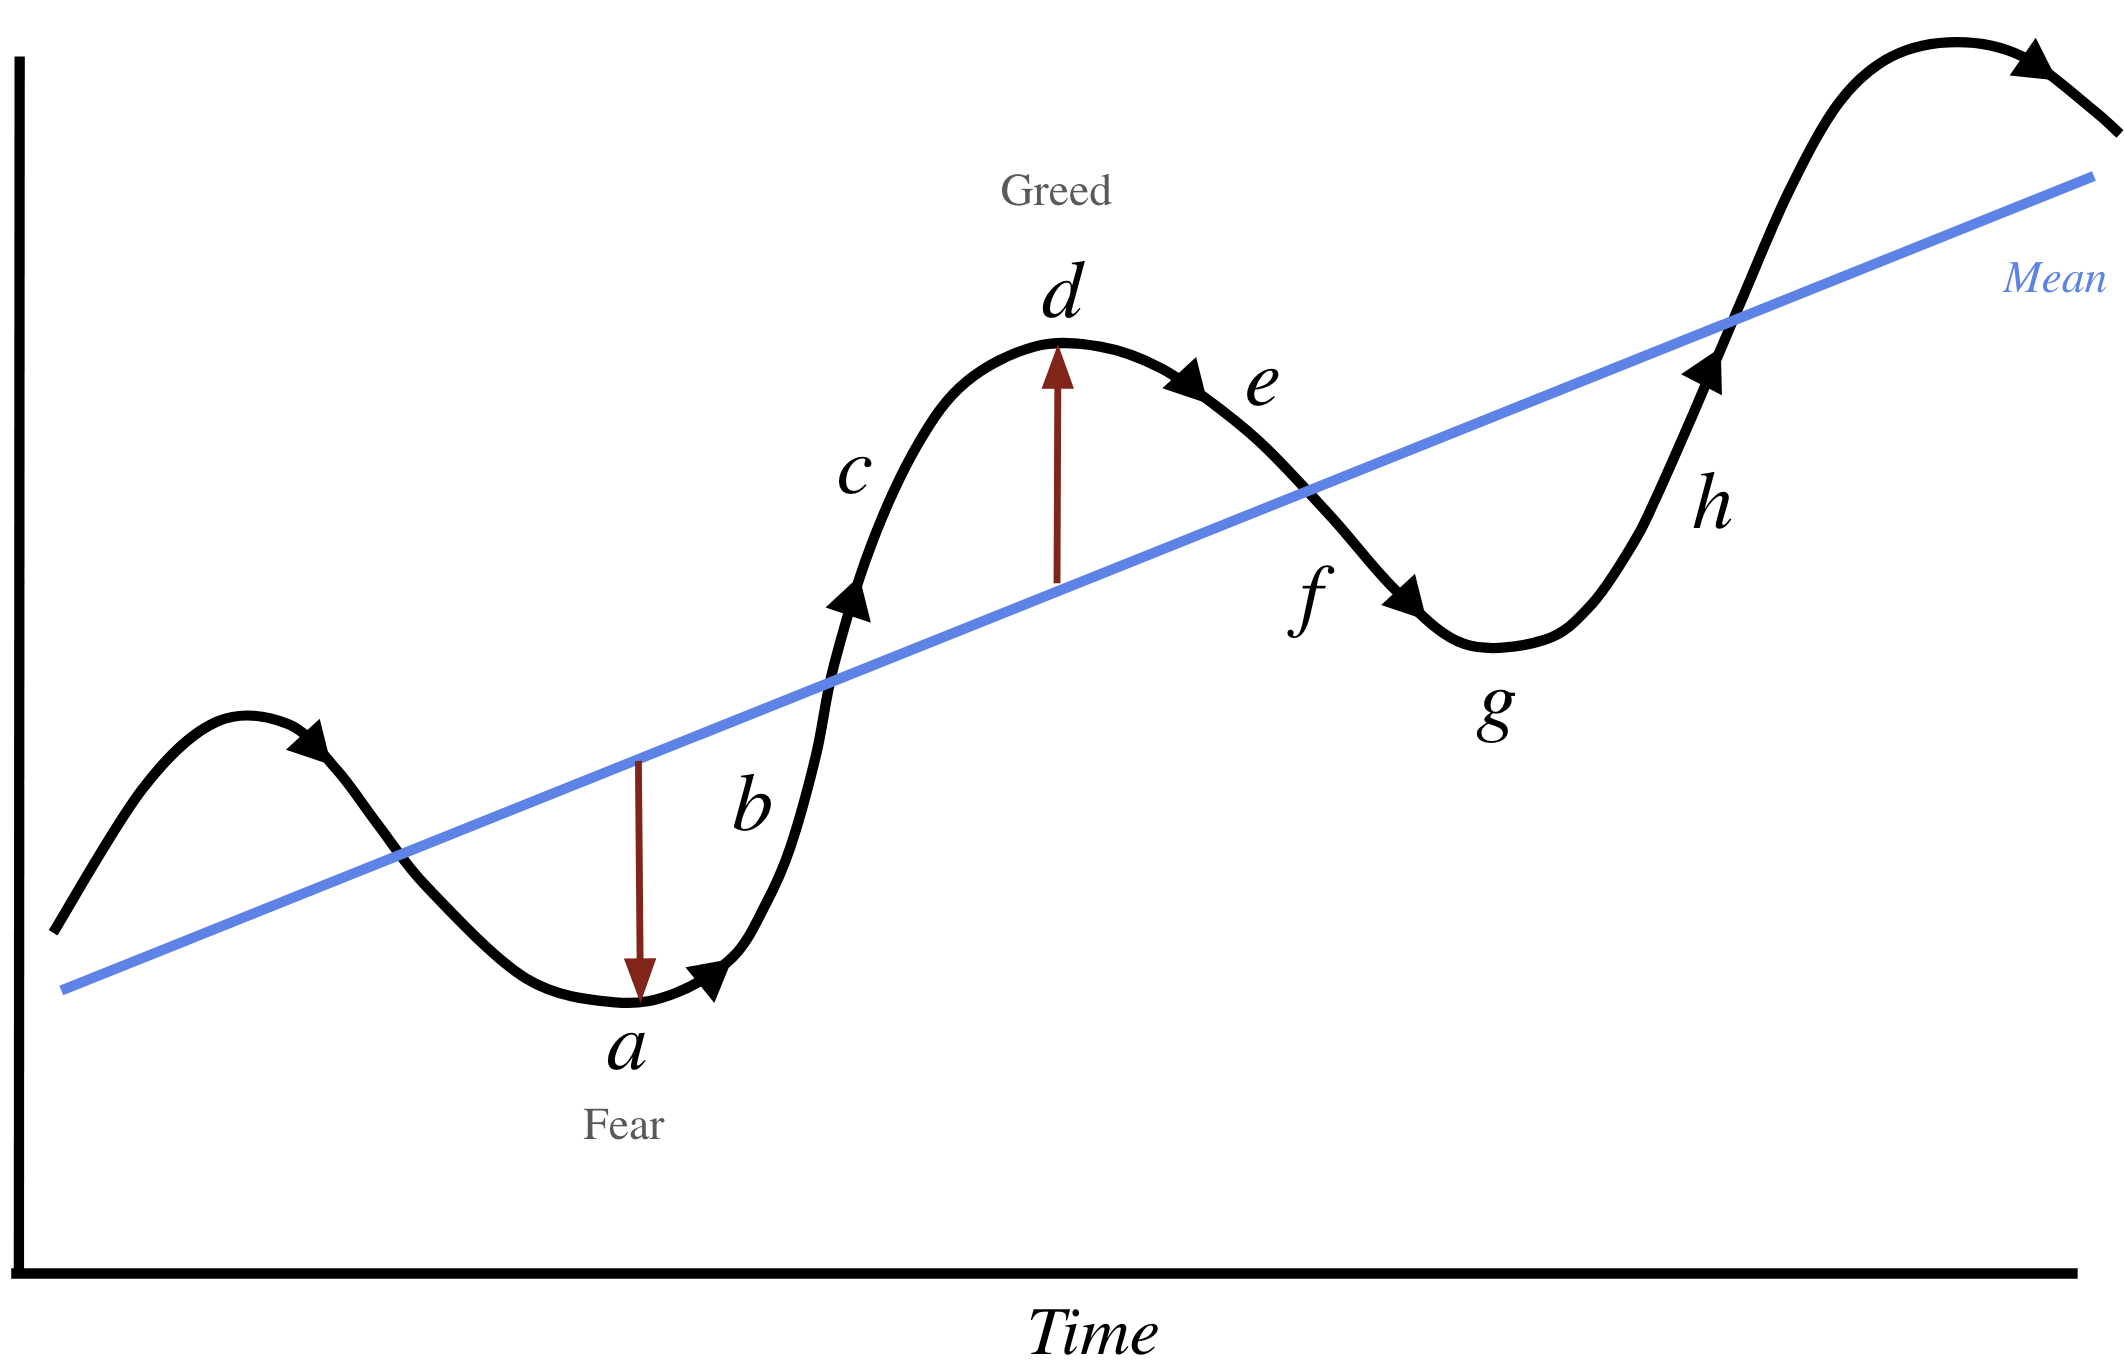
And just like the expansion on the way up (as we"ve seen) – the over-correction can also take several years.
But hang on Adrian… our mean is a moving target (e.g. it can rise over time)
Yes – the mean will move.
The mean for the past 10-years has been closer to 18x than 15x.
And the longer it stays above 18x – the more it will lift the long-term mean.
And this is in part due to the excessively long periods of artificially lower rates.
The lower rates go… the higher the multiple for stocks. The inverse is also true.
But the bigger point is history has told us that when you buy stocks when forward P/Es are 22 or higher (as is the case today) – over the coming 10 years – your median return will be ~5.0%.
In other words, buying at points "c to d" on our cycle diagram above will likely lead to lower returns.
An average 5.0% return is ~4.0% lower than the 100-year average.
In short, your rule of thumb is the higher than market wide forward P/E – the less favourable the long-term result.
S&P 500 – Monthly Chart
A few weeks ago (Sept 13) – I mentioned I would not be surprised to see the S&P 500 challenge a level of 7,000 this year.
That level is only 4.5% away – and will likely be achieved.
As an aside, if you asked me in April with S&P 500 trading ~4800 – if we would see a ~46% gain from these levels in 6 months – I would have said "unlikely"
And yet here we are…
It just goes to show why you should always maintain some level of exposure to risk assets.
As readers will know, I maintain ~65% long exposure which has resulted in modest double-digit portfolio gains this year (with Google my largest position).
Give we"ve just concluded the 6th consecutive positive month since April"s tariff meltdown – it"s good to revisit the monthly chart (as it offers very useful perspective).

October 5 2025
The first thing which strikes me about this log chart is the 12% CAGR – exclusive of dividends – we"ve experienced since October 2013.
Rarely in history have investors had things this good for so long.
However, we"re now trading toward the upper-limits of this trend channel.
For example, the last time we crept above this level (2022) – stocks mean reverted – where the S&P 500 gave back around 20% that year.
From there, we saw the Index trade back to the lower limits of the trend channel (a good buying opportunity)
Excluding the anomaly of COVID – this lower limit has been a consistently strong area of support.
Today that lower limit is a zone between 4900 and 5300.
That"s a lot lower than today"s asking price of 6700 – but it"s not something we can rule out should the AI bubble pop.
Further to Marks" point – it"s very unlikely this bubble is about to pop imminently.
But you should be asking about what risks you might be taking to potentially squeeze the last "10% to 20%" out of the market?
Putting It All Together
Before I close, my general approach is you are always better to be early (vs being late).
It"s not unlike catching a train…
If there"s only one train leaving the station at 9:00am and you arrive at 9:05am – it"s not going to serve you well.
With this game, my experience is the greater damage is always done during the final phase of a bull market.
Therefore, instead of trying to ride a market to the very top, it"s prudent to de-risk before the final blow-off top.
And as FOMO takes hold in areas like AI or crypto – the savvy investor is looking for neglected asset classes elsewhere.
For example, I think we saw this with some health-care related stocks last quarter (where I added to names like PFE, UNH and ELV at attractive long-term multiples).
Remember: it"s not just what you buy… it"s how much you pay.