10-Yr Yield Surges on Jobs… 6 Rate Hikes for ’22?
- Facebook taketh away; and Amazon giveth
- S&P recovers but more work required
- 10-year yield surges above 1.90% on growth outlook
It was a topsy turvy week – however the S&P 500 and Nasdaq finished their best week of the year so far.
With $250 billion ripped off Facebook"s market cap… markets regained their footing by Friday as Amazon surged almost 14% on impressive Q4 numbers.
It was the e-commerce and cloud giant"s best day in seven years…
More on Amazon in my conclusion…
Despite the jump today – indices are still in the red for the year – and more work is needed form the bulls to repair the damage.
Let"s take a look…
S&P 500: More Work Needed
It"s been a wild three weeks…
Stocks such as Facebook, PayPal and Netflix were mauled… each losing more than 20% in a session.
On the flip-side, quality outfits like Microsoft, Apple, Google and Amazon (MAGA) showed their resilience to inflation and widespread supply-chain woes.
These are the names you should own… and dips are opportunities.
For example, Amazon traded in the low $2,700"s last week…. and Google ~$2,500"s before that.
Did you buy?
Over the past 10 trading days – the S&P 500 has traded as low as ~4200 and as high as 4600
That"s almost a 10% range… volatility we have not seen in over 12 months…
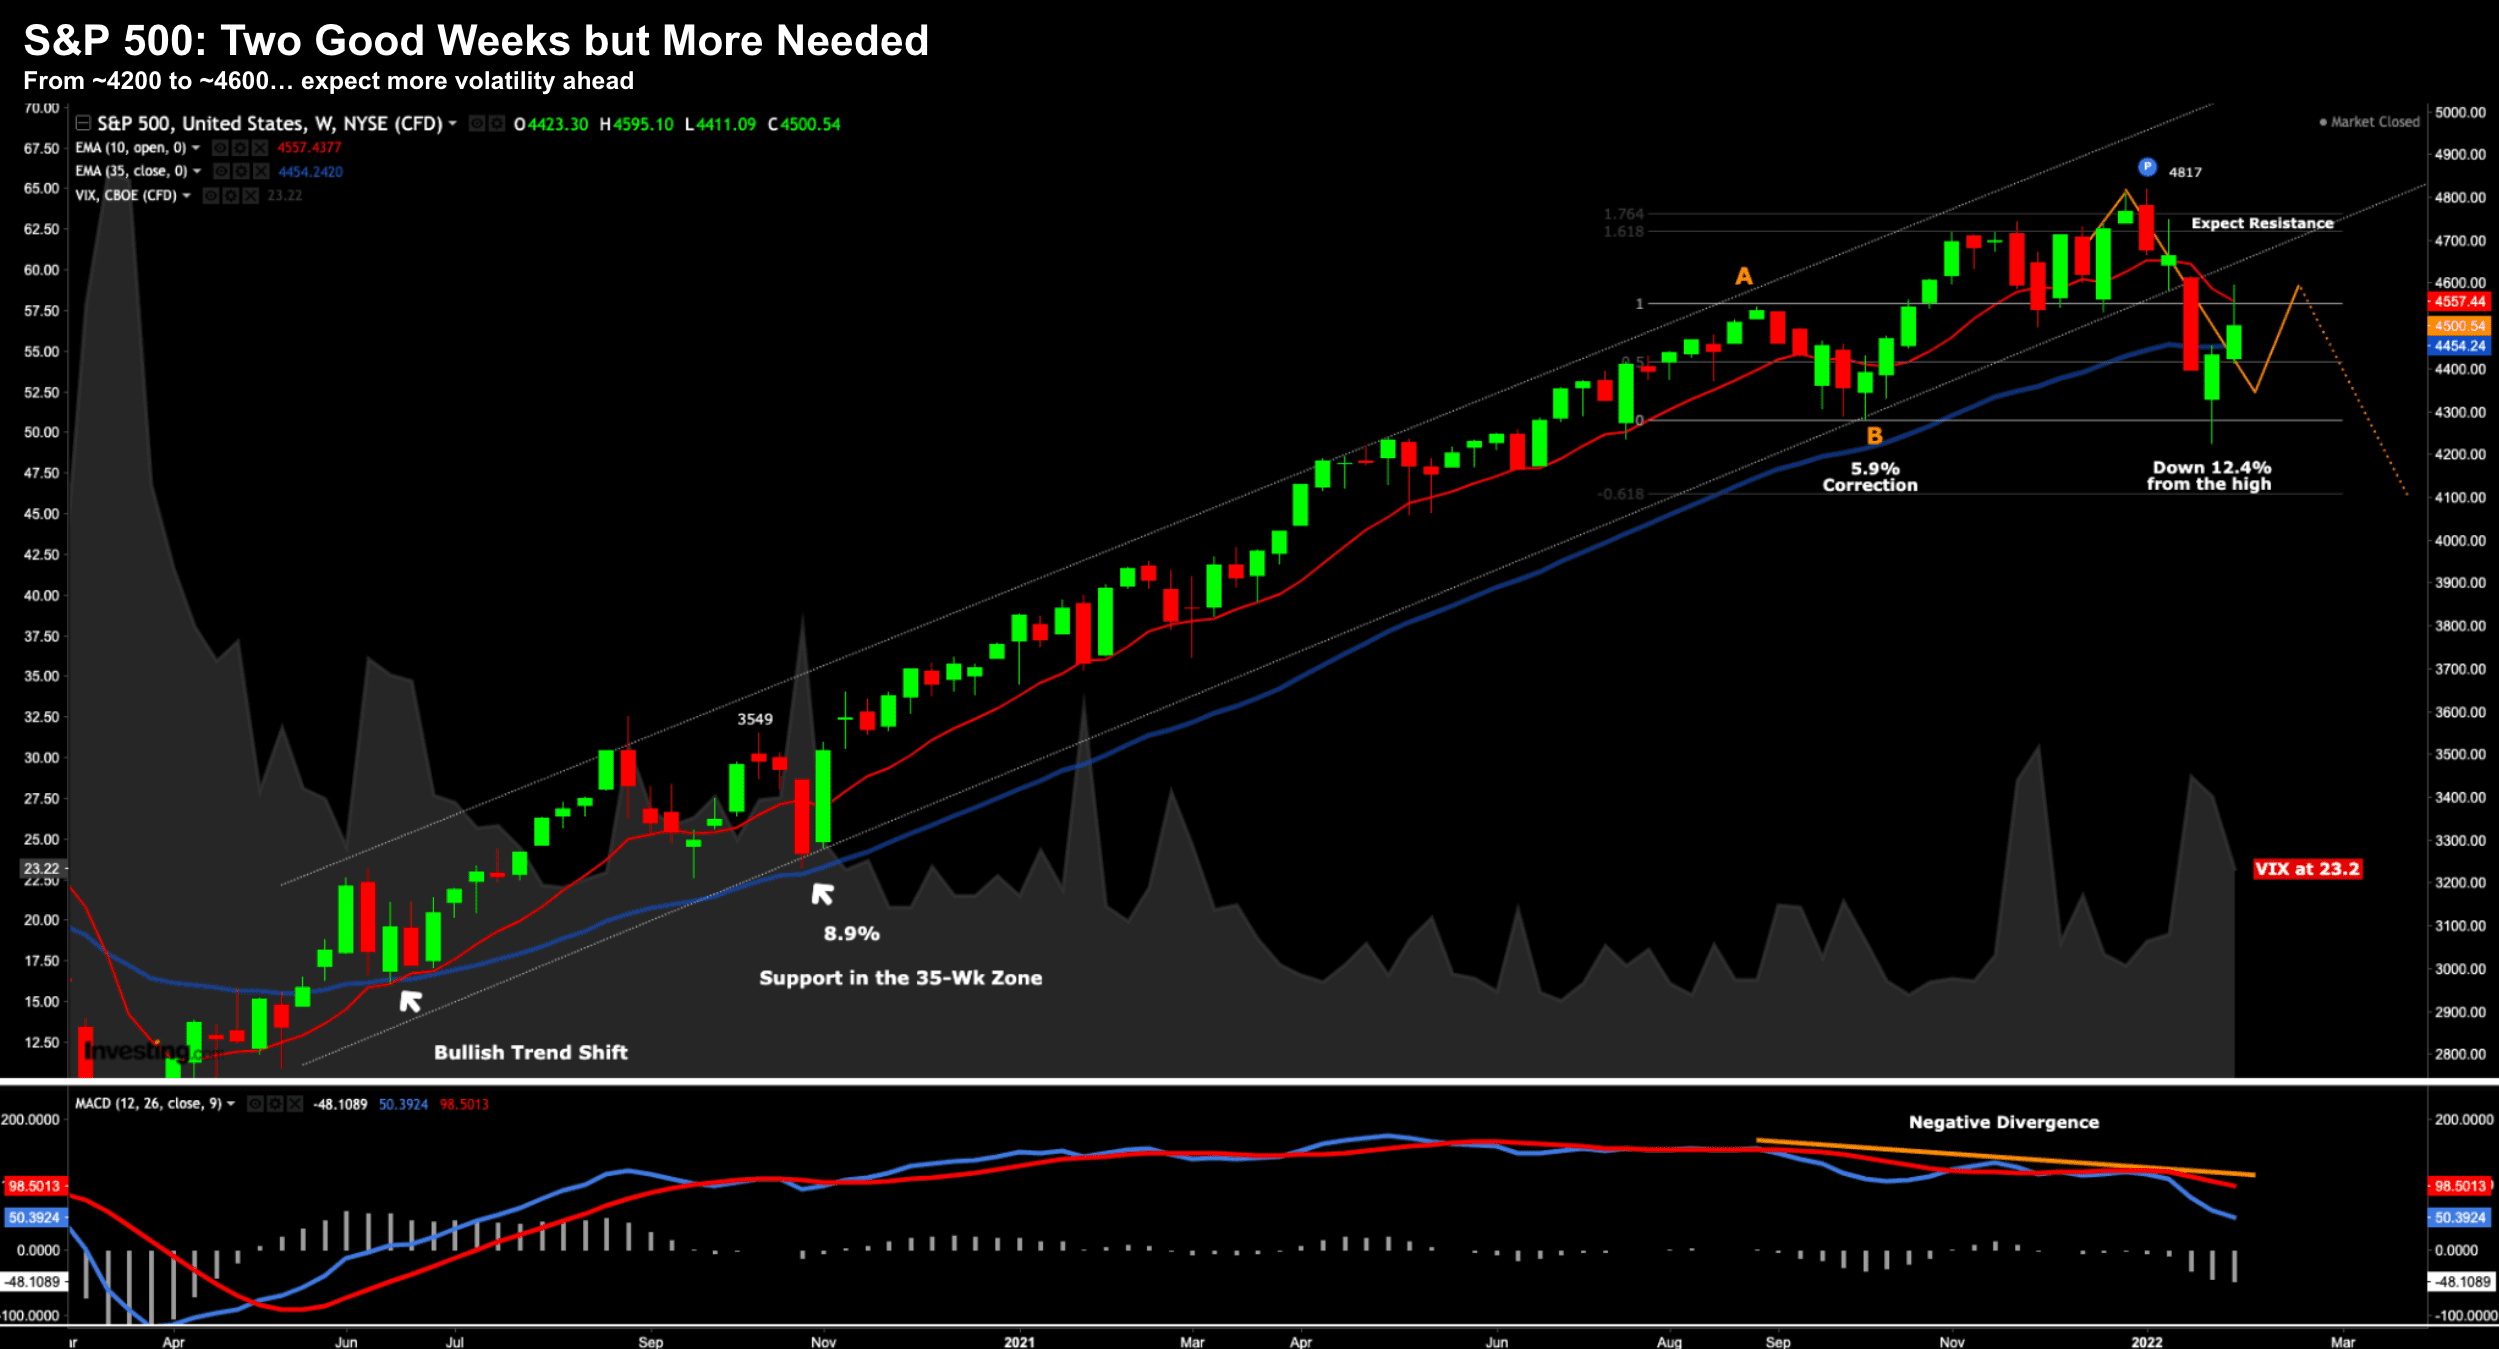
Not much has changed technically over the past 8 weeks (from my lens)
In summary:
- From late December – I was looking for resistance around the 4700-4800 zone (i.e. 61.8% outside the retracement labelled A-B)
- From there, l suggested a possible move down to the 35-week EMA zone (ideally below) for a 10-15% pullback
- At that point, I was looking for buying support – with the market in weekly bullish trend.
But can the bulls follow through?
For example, the market found solid resistance this week at the 10-week EMA (red)
This is expected.
However, ideally we need to see the market close above this moving average.
We are not there yet.
What"s more, I also think the recent level of support of ~4550 will act as a near-term resistance (n.b., this correlates with Point "A")
I remain divided here as to the market"s move… and it could go either way.
What I don"t like seeing are "10-20%" daily moves in names with market caps north of $1 Trillion.
That"s not a good sign… it"s a skittish market.
And whilst I remain bullish for the full year… I expect more volatility as the market sweats the Fed"s next move.
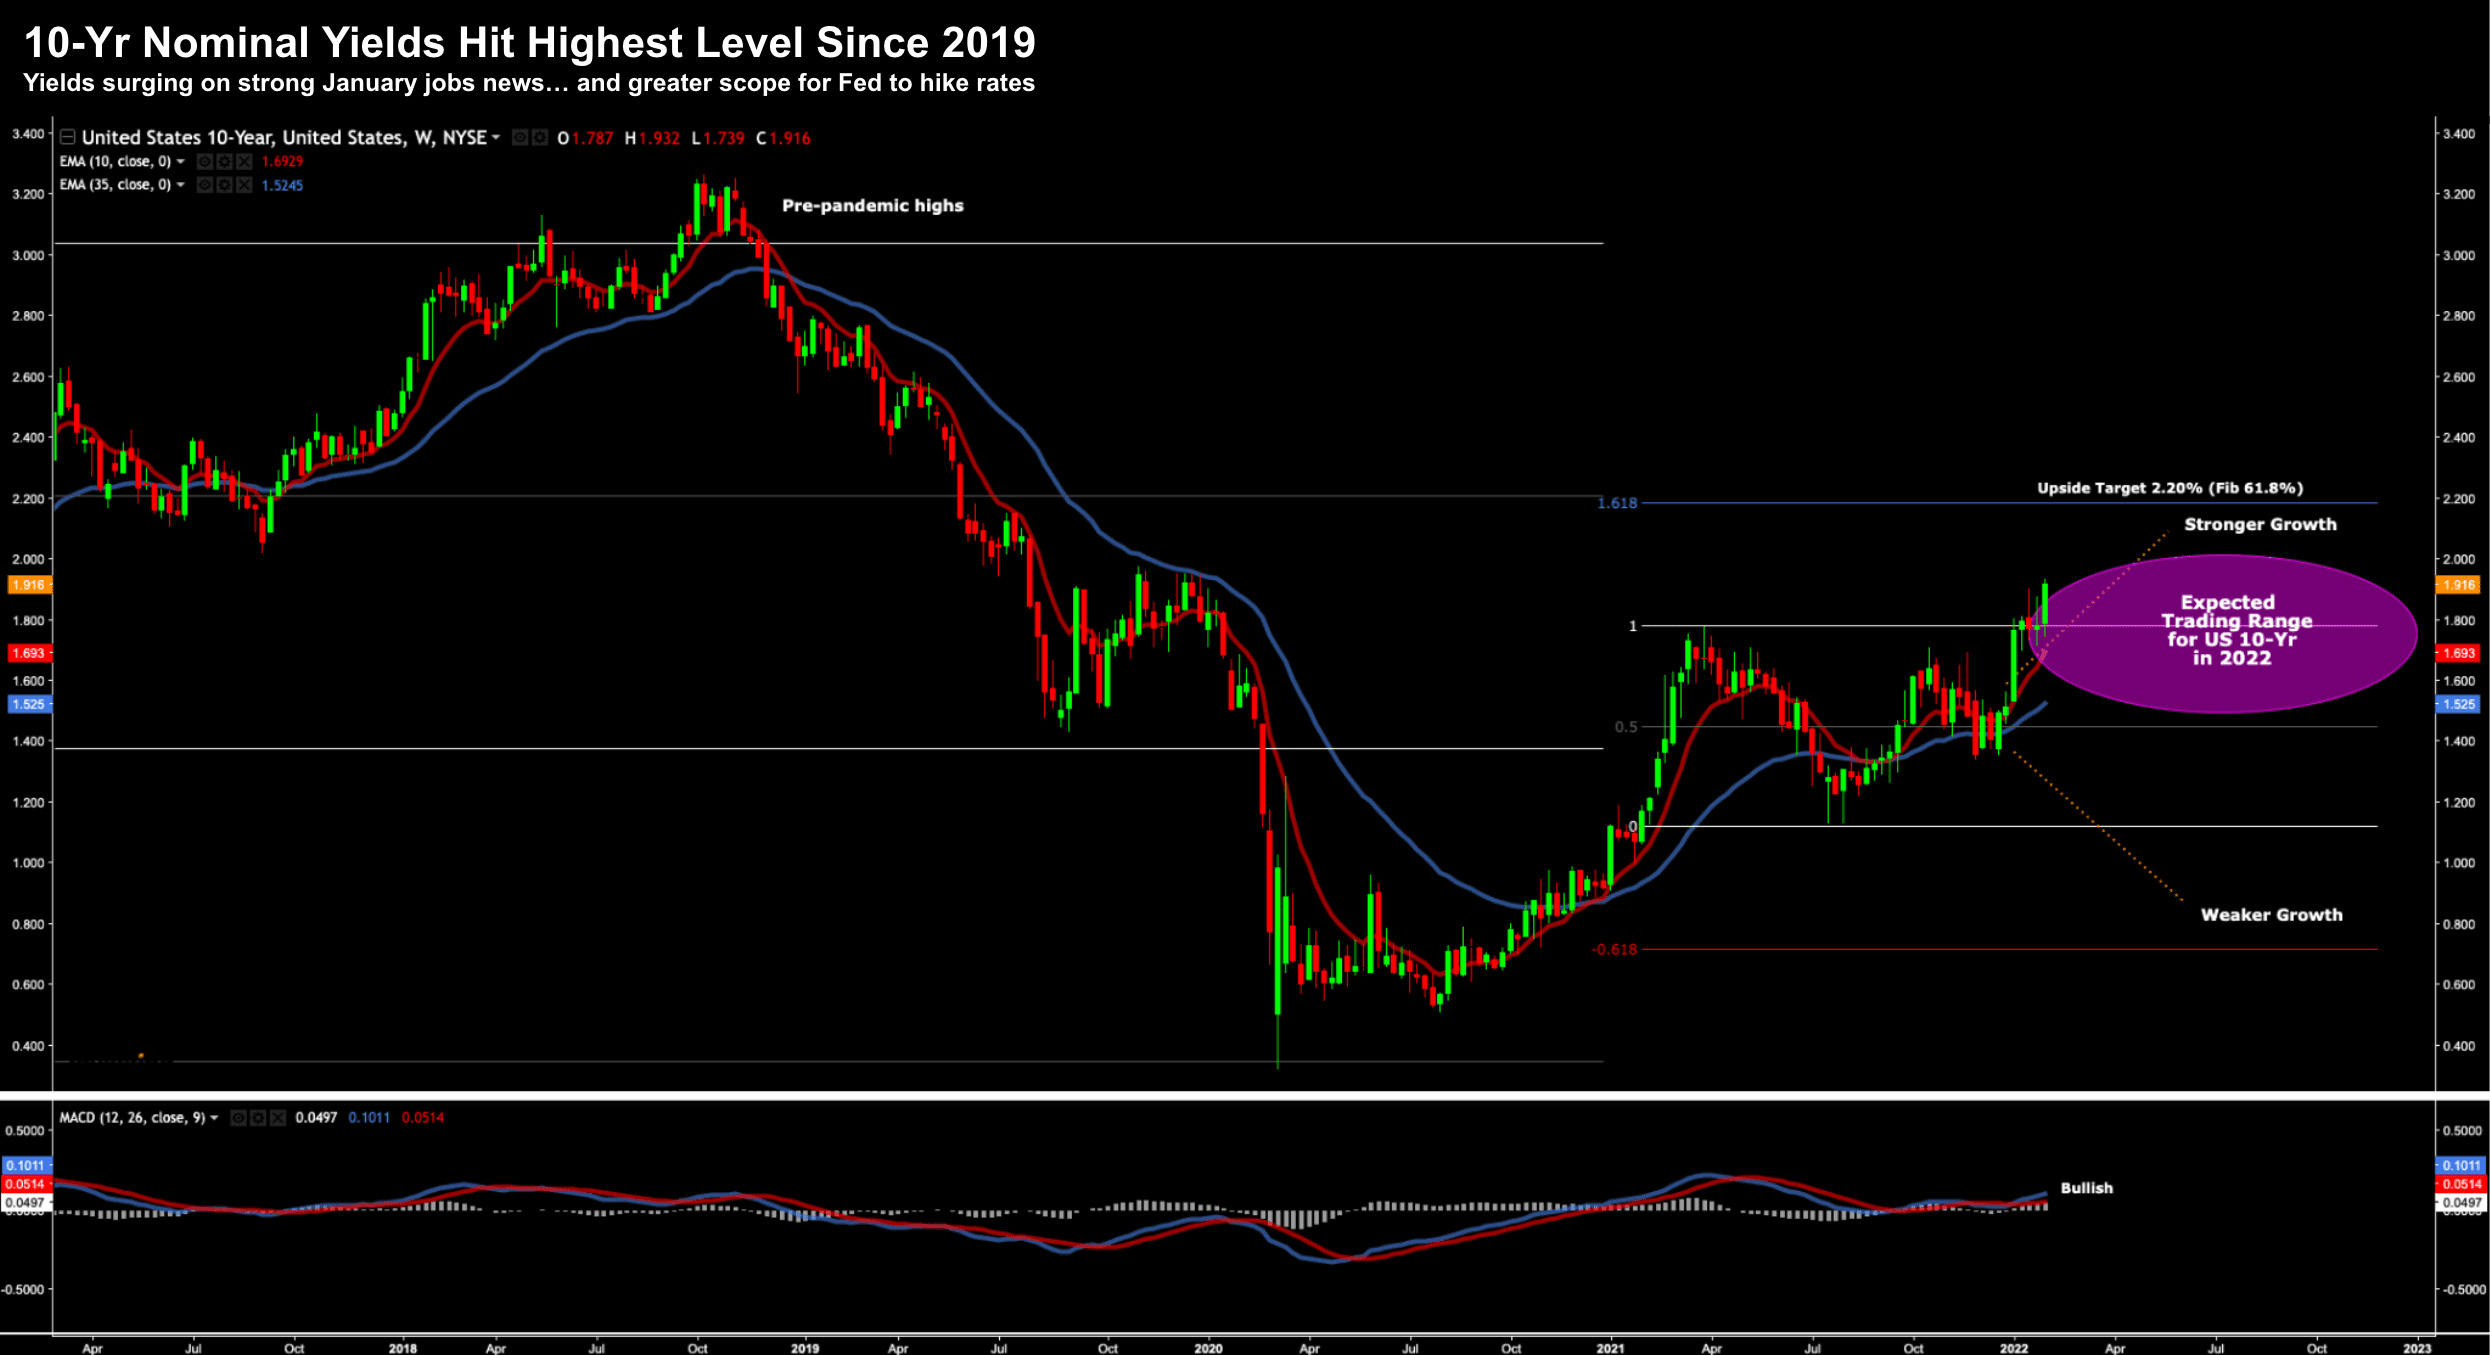
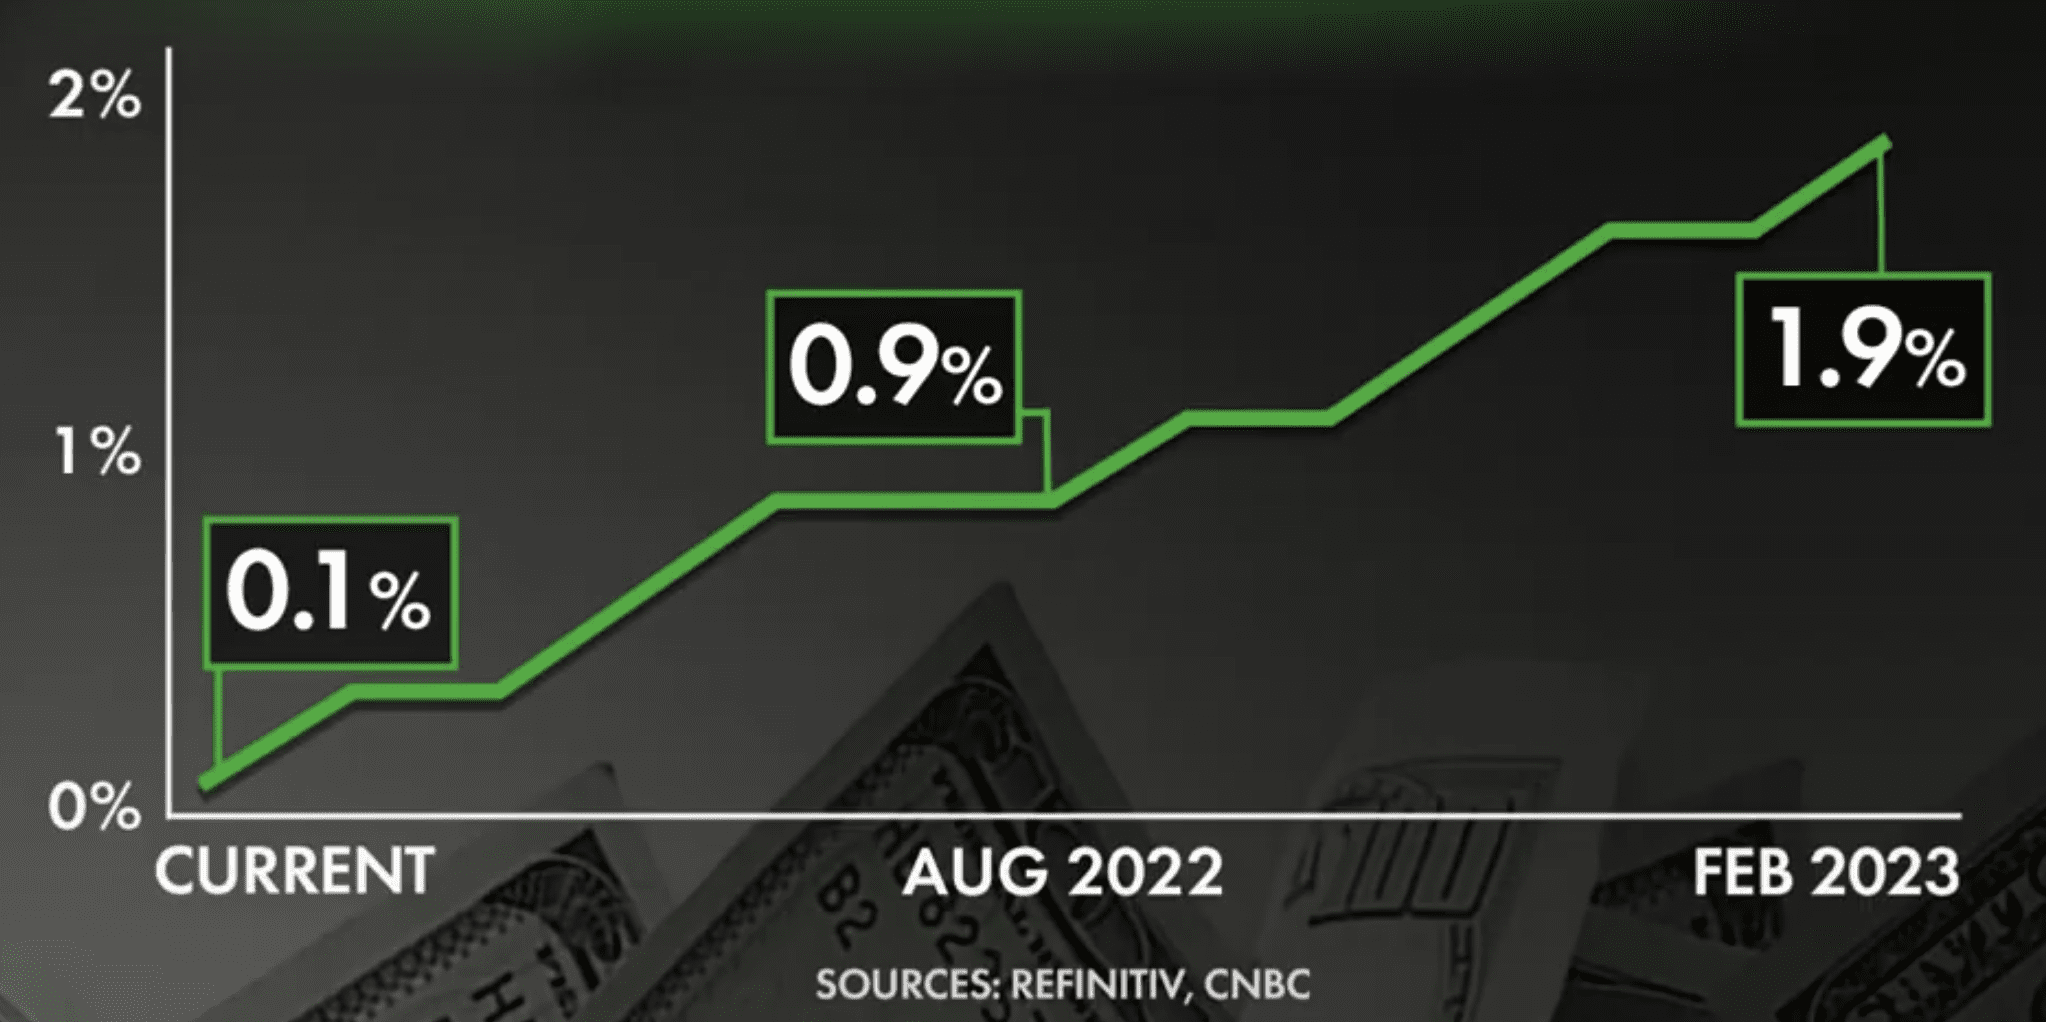
10-Year Bond Yield Above 1.90%
A positive this week was the US 10-year treasury climbing above 1.90%
This is exactly what we need to see.
Now I nominated the US 10-year as one of my five key charts for the 2022 – where I expected it to trade as high as 2.20%
However, I don"t see the 10-year sustaining this level for any meaningful period.
My expectation is it will trade inside a range between 1.50% and 2.00%
Let"s take a look…
Feb 04 2022
Technically speaking, these yields have a clear pathway to run higher… challenging the zone of 61.8% outside the retracement from early 2021.
For those less familiar, a rising 10-year yield is the market showing more confidence in growth.
For example, traders and investors are selling bonds and moving into riskier assets.
Bond prices trade inversely to yields.
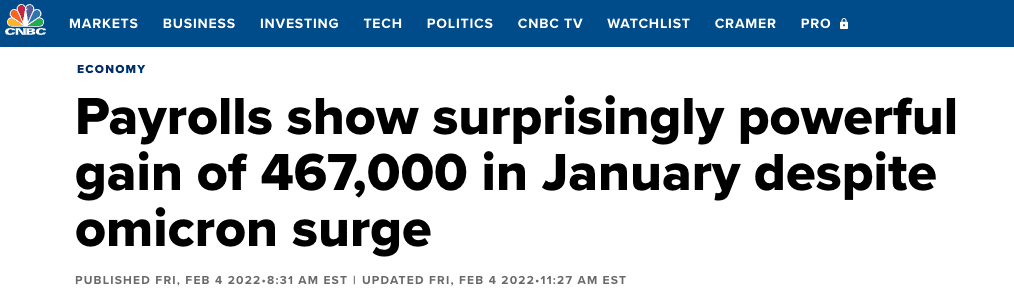
One plausible explanation for the stronger yield was news of a bumper January jobs report.
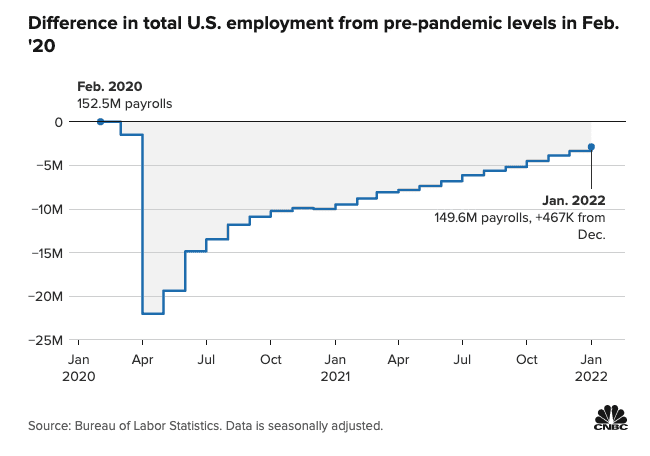
This positive trend line began in May 2020 and has consistently been improving.
At this pace, sometime in the next ~4 months we will have recovered almost all the jobs lost from the pandemic.
So far we"ve seen ~6.7M jobs added over 12 months.
And almost 20M jobs since April 2020!
Markets were concerned about a potential January slowdown due to Omicron – however it was non-existent.
Instead of the market "catching pneumonia"… it barely caught a cold.
What"s more, previous month"s job additions were revised sharply higher.
- December revised up to 510,000 jobs added (from 199,000 initially reported); and
- November revised up to 647,000 jobs added (from 249,000 initially reported)
Below we find the unemployment rate is back to almost pre-pandemic lows… i.e., full employment for all intensive purposes.
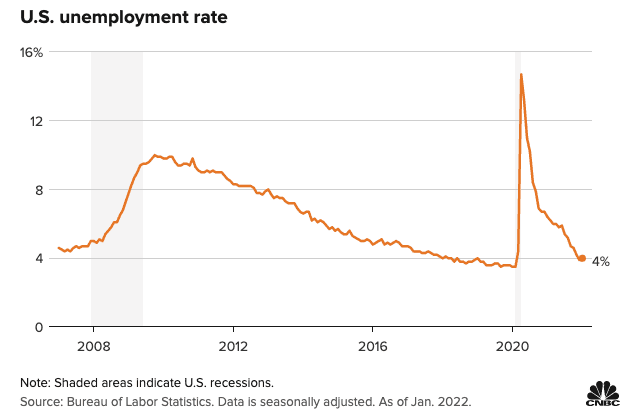
But here"s your inflation kicker:
Wages also rose sharply, accelerating 0.7%, good for a 12-month gain of 5.7% (still behind CPI at around 7%)
This kind of inflation is "sticky".
That yearly wage move was the biggest gain since May 2020 when wage numbers were distorted by the pandemic.
Which brings us to the market"s real fear…
How Many Rate Hikes are Coming?
The stronger-than-expected economic news will give the Fed more scope to raise rates.
Call it another shot in the chamber.
Some now see a 50% probability of 6 rate hikes by December 2022. The market has also priced in a 100% chance of 2 rate hikes by June.
I think the market is fine with the prospect of 4-5 rate hikes.
For example, with inflation still expected to north of 5% by years" end – that will still mean rates are negative in real terms.
What was interesting today was growth stocks and yields rallied in unison.
Now previously a 10-year yield of around 2.0% sent fear through the tech sector… not now.
But the big unknown is less about rate hikes – it"s more about possible Fed balance sheet reduction.
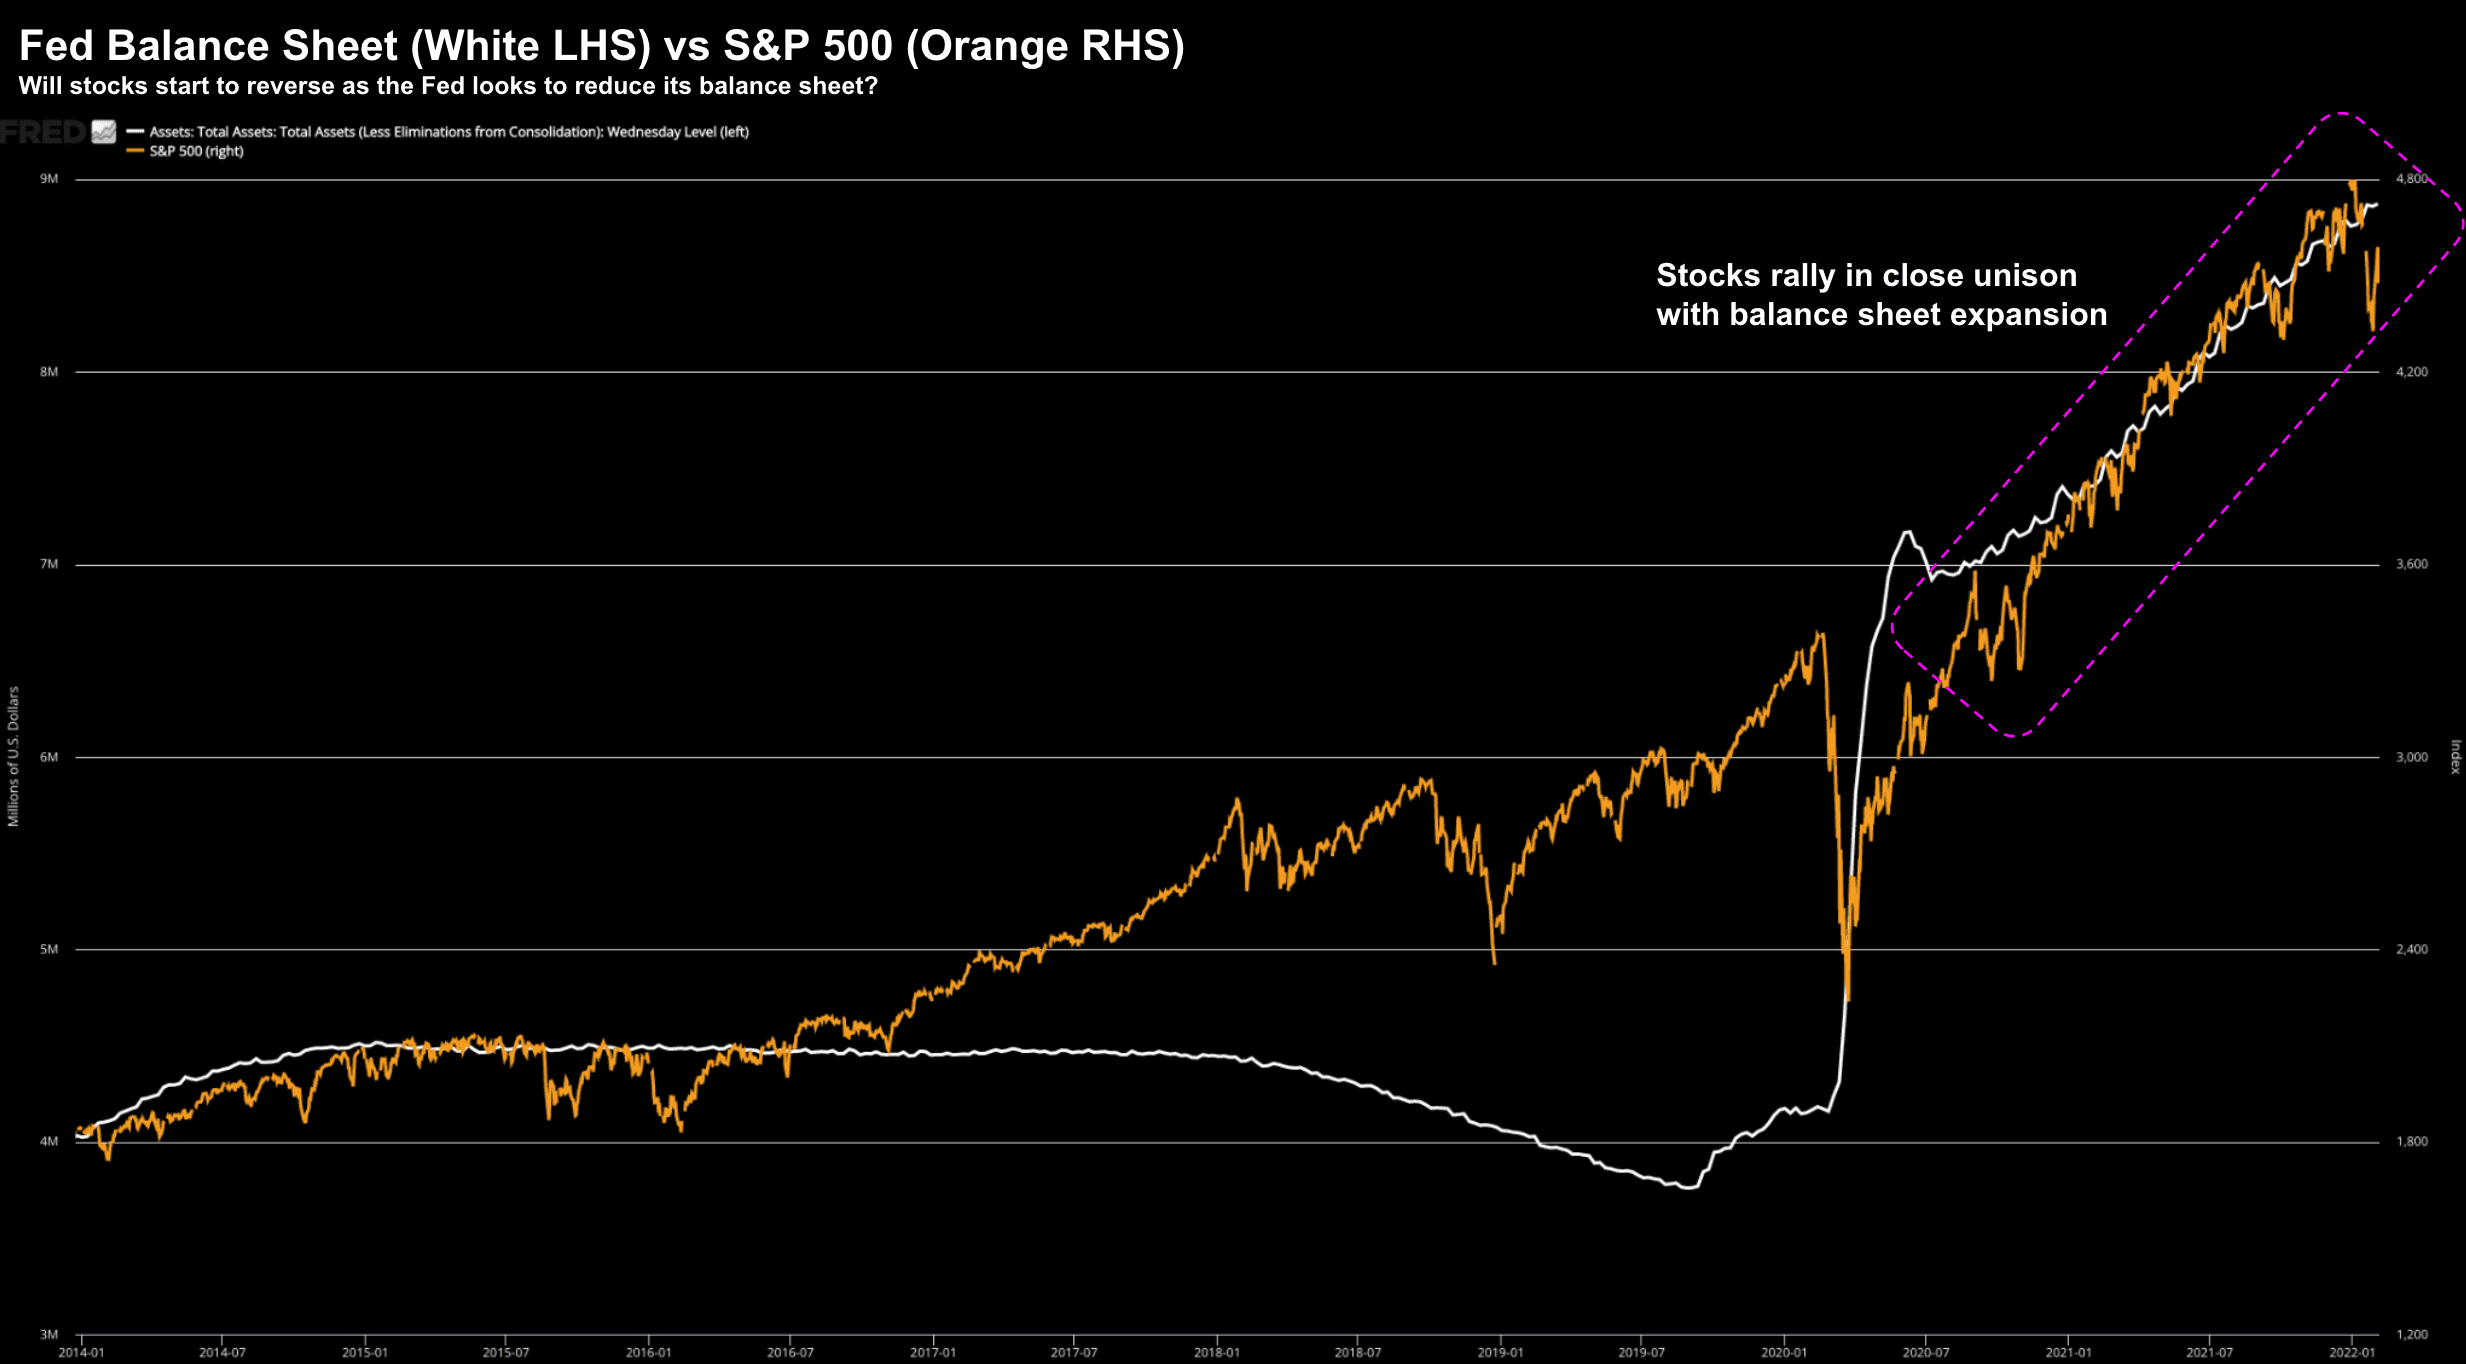
Feb 04 2022
As we can see above, there is a strong correlation between the rate of expansion of the Fed"s balance sheet (white line) and the acceleration in stocks.
The question to ask is what happens when the Fed"s balance sheet stops expanding (or worse – turns lower)?
My guess is we won"t see the same path of acceleration in stocks… and why I suggest only single digit gains this year.
Don"t get me wrong… there is still a mountain of liquidity sloshing around to support asset prices.
However, the hyper-gains of 20% plus are gone for now.
Putting it All Together…
I can"t close tonight"s missive without diving into Amazon…
Let me start with the key metrics
- Earnings per share (adjusted): $5.80 vs $3.57 expected
- Revenue: $137.4 billion (growth of 9.4%) vs $137.6 billion expected;
- AWS (Cloud) revenue: $17.8 billion vs $17.37 billion expected
- Advertising Revenue: $9.7B up 32% YoY
- Free cash flow decreased to an outflow of $9.1 billion for the trailing twelve months (due to a major capex cycle)
Whilst the Q4 result was strong – forward guidance may raise concern.
Amazon guided Q1 revenue of between $112 billion and $117 billion, below the average estimate of $120 billion.
Operating profit in the fourth quarter will be in the range of $3 billion to $6 billion.
As I say – typically this would result in caution – however the Q4 blowout was enough for investors to push the stock higher.
What perhaps caught my eye was the explosive growth they are seeing in advertising.
In my previous post I called this out as something to watch (given the sheer volume of product searches which occur on the site).
Amazon disclosed revenue from its fast growing business for the first time. Advertising services grew 32% year over year to $9.7 billion during the quarter.
All of a sudden, Amazon now has a $31B per year advertising business growing at 30%+
What few realize is this places Amazon third in digital advertising only behind Google and Facebook.
Amazon trades at a premium… but this is what you are buying:
- ~40% of all e-commerce total spend;
- ~32% of all cloud spend; and now
- ~12% of all online advertising spend
My expectation is Amazon will likely be a $4,000+ stock within the next two years.