Are We About to Experience 1970s Stagflation?
- Further downside to come…
- Growth forecasts are being slashed
- Bond yields suggest stagflation may return
Markets were awash with red-ink again today – as they assess the economic impacts of Russia"s evil invasion of Ukraine.
Growth forecasts are being revised lower globally… as are year-end equity targets.
The Dow and S&P 500 had their worst day of the year… but it may not be the last.
The technology-heavy Nasdaq Composite dropped 3.6%…. now in what"s technically a "bear market" (i.e., more than 20% off its Nov 19 record close)
More on this in a moment when I look at the chart for the ETF QQQ…
I think there"s more downside to come – but we might be closer to a bottom.
We will see…
Global Growth Forecasts Lowered
With WTI Crude trading at its highest level since 2008 (above $130 p/barrel) – global growth expectations are coming down.
For example, strategists from Citi to UBS, Yardeni Research and Evercore ISI have lowered their U.S. equity outlooks.
Long-time market bull Ed Yardeni now sees the S&P 500 suffering a 16% decline in 2022 to end at 4,000.
The "good news" that"s only around 4.8% lower than where we are at the time of writing.
Analysts are also starting to weigh the possibility of "stagflation".. as central banks wrestle with the likelihood of much slower growth opposite unwanted inflation.
We saw this rare toxic economic mix in the 1970s / early 80s… and it"s possible we see a repeat.
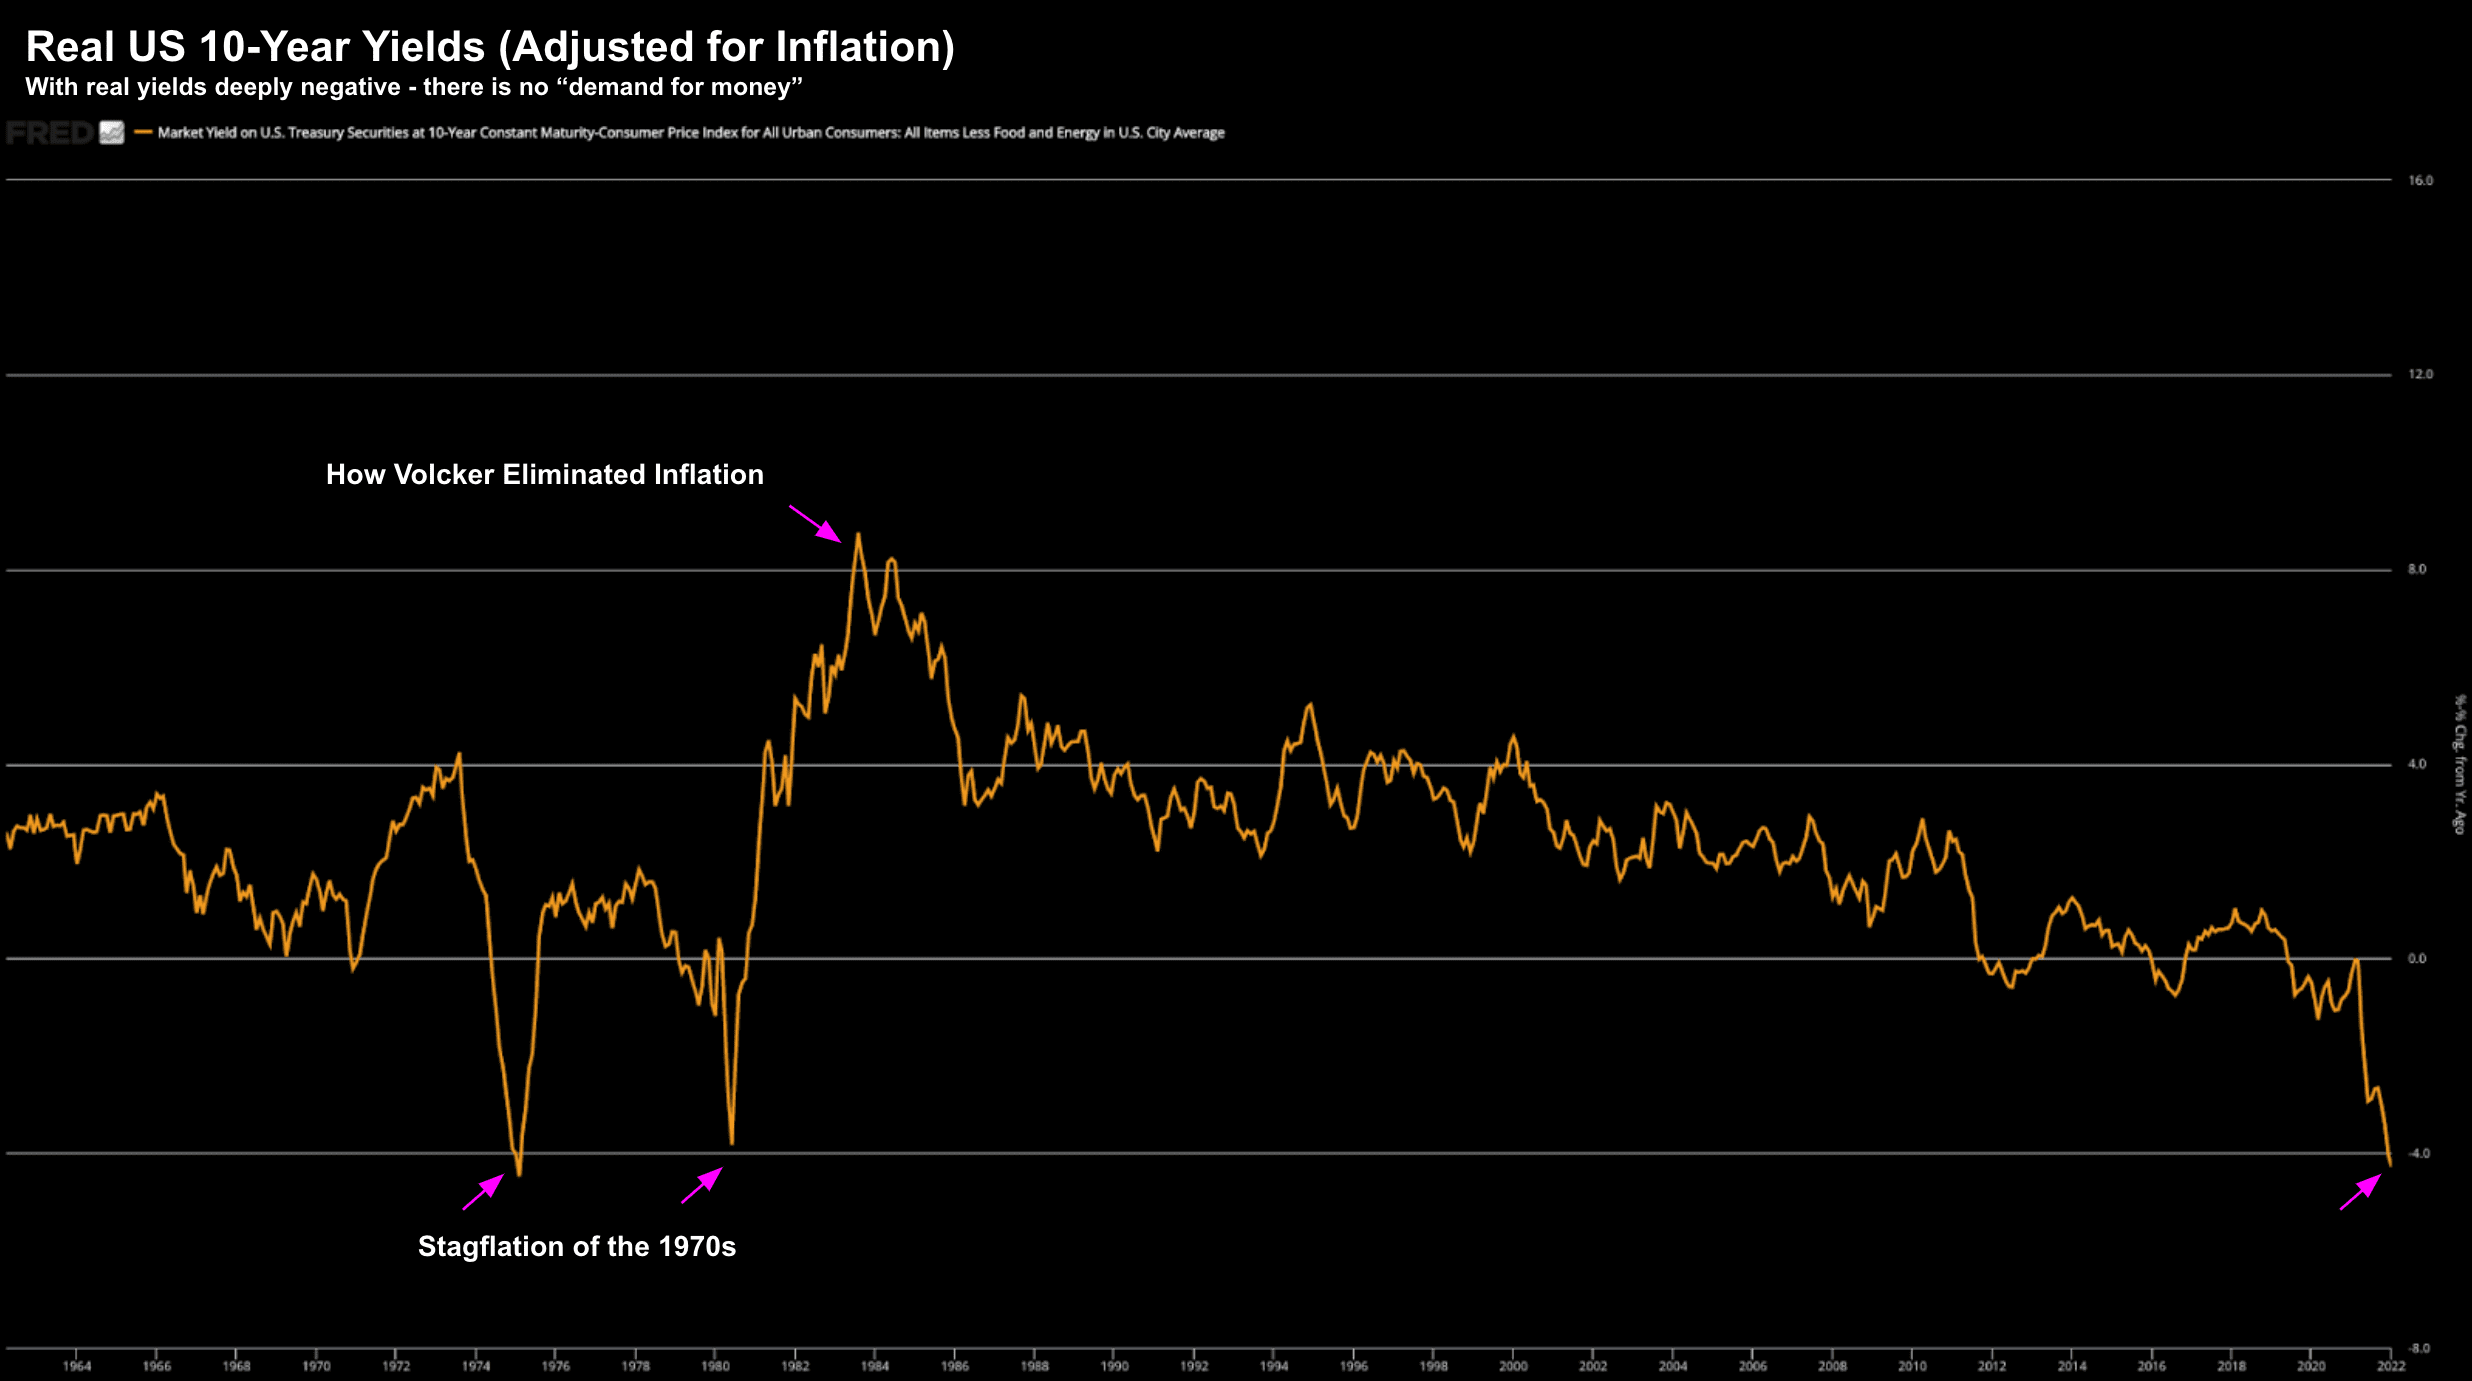
For example, this is showing up on real yields (as I demonstrated yesterday – plotted against gold) – where all the increases driven by the hawkish pivot at the Fed have been undone.
10-Year TIPS yields are back at historically extreme lows… which suggests the "smart money" is pricing this as a possible scenario.
I shared this chart last week:
Meanwhile, 5-year inflation breakevens have touched the highest in the 20 years… as the all-important 2/10 yield curve flirts with 20 basis points:
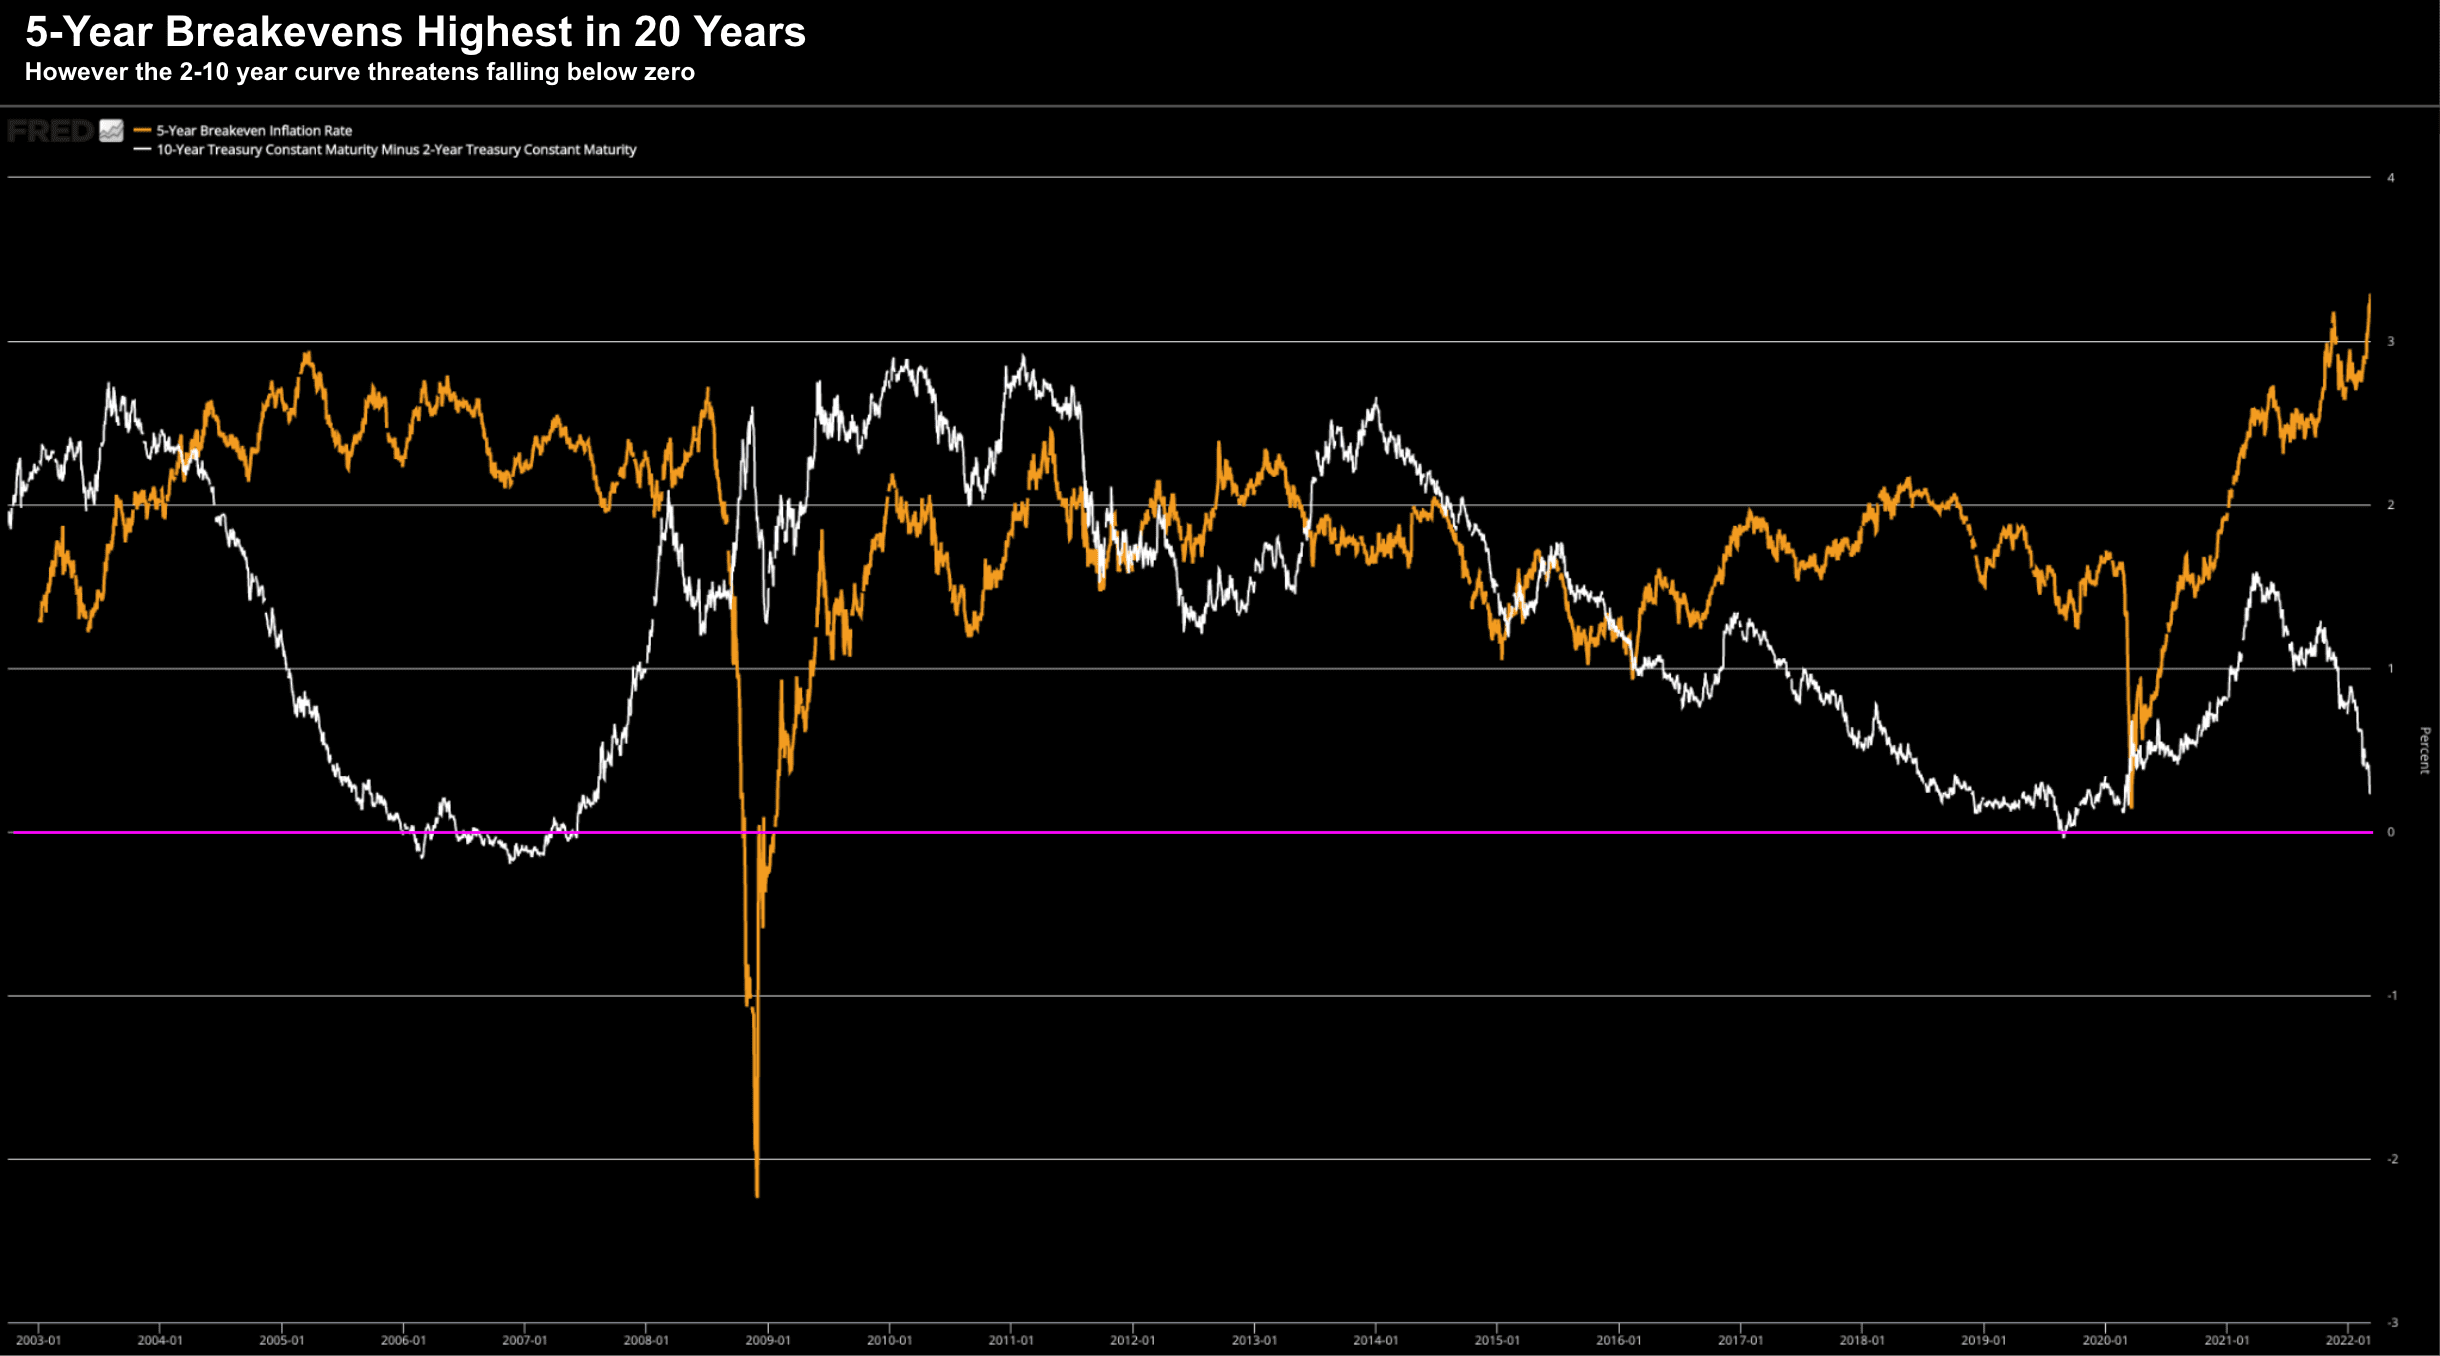
The yield curve (white line) steepened during the top of the economic cycle – but has since plummeted on the worsening economic outlook.
From mine, it seems an inversion is imminent over the coming months… which tells me recession could strike somewhere late in 2023.
Recessions are very hard to predict… however the Fed will likely play a large part in that.
Are they walking straight into another "policy mistake"?
Now case in point – look at the white line in late 2006 / early 2007.
We had crossed below the zero line for a lengthy period as the Fed aggressively hiked rates.
The Great Recession of 2008 was to hit ~18 months later.
We could be looking at something similar… unless 10-year yields start to meaningfully improve on a better outlook.
Will they?
Well for that to happen we need to see (a) inflation reduce sharply; and (b) an end (or at least easing) to the Russia / Ukraine conflict.
Neither feel likely at the time of writing.
Commodity Surge to Kill Demand
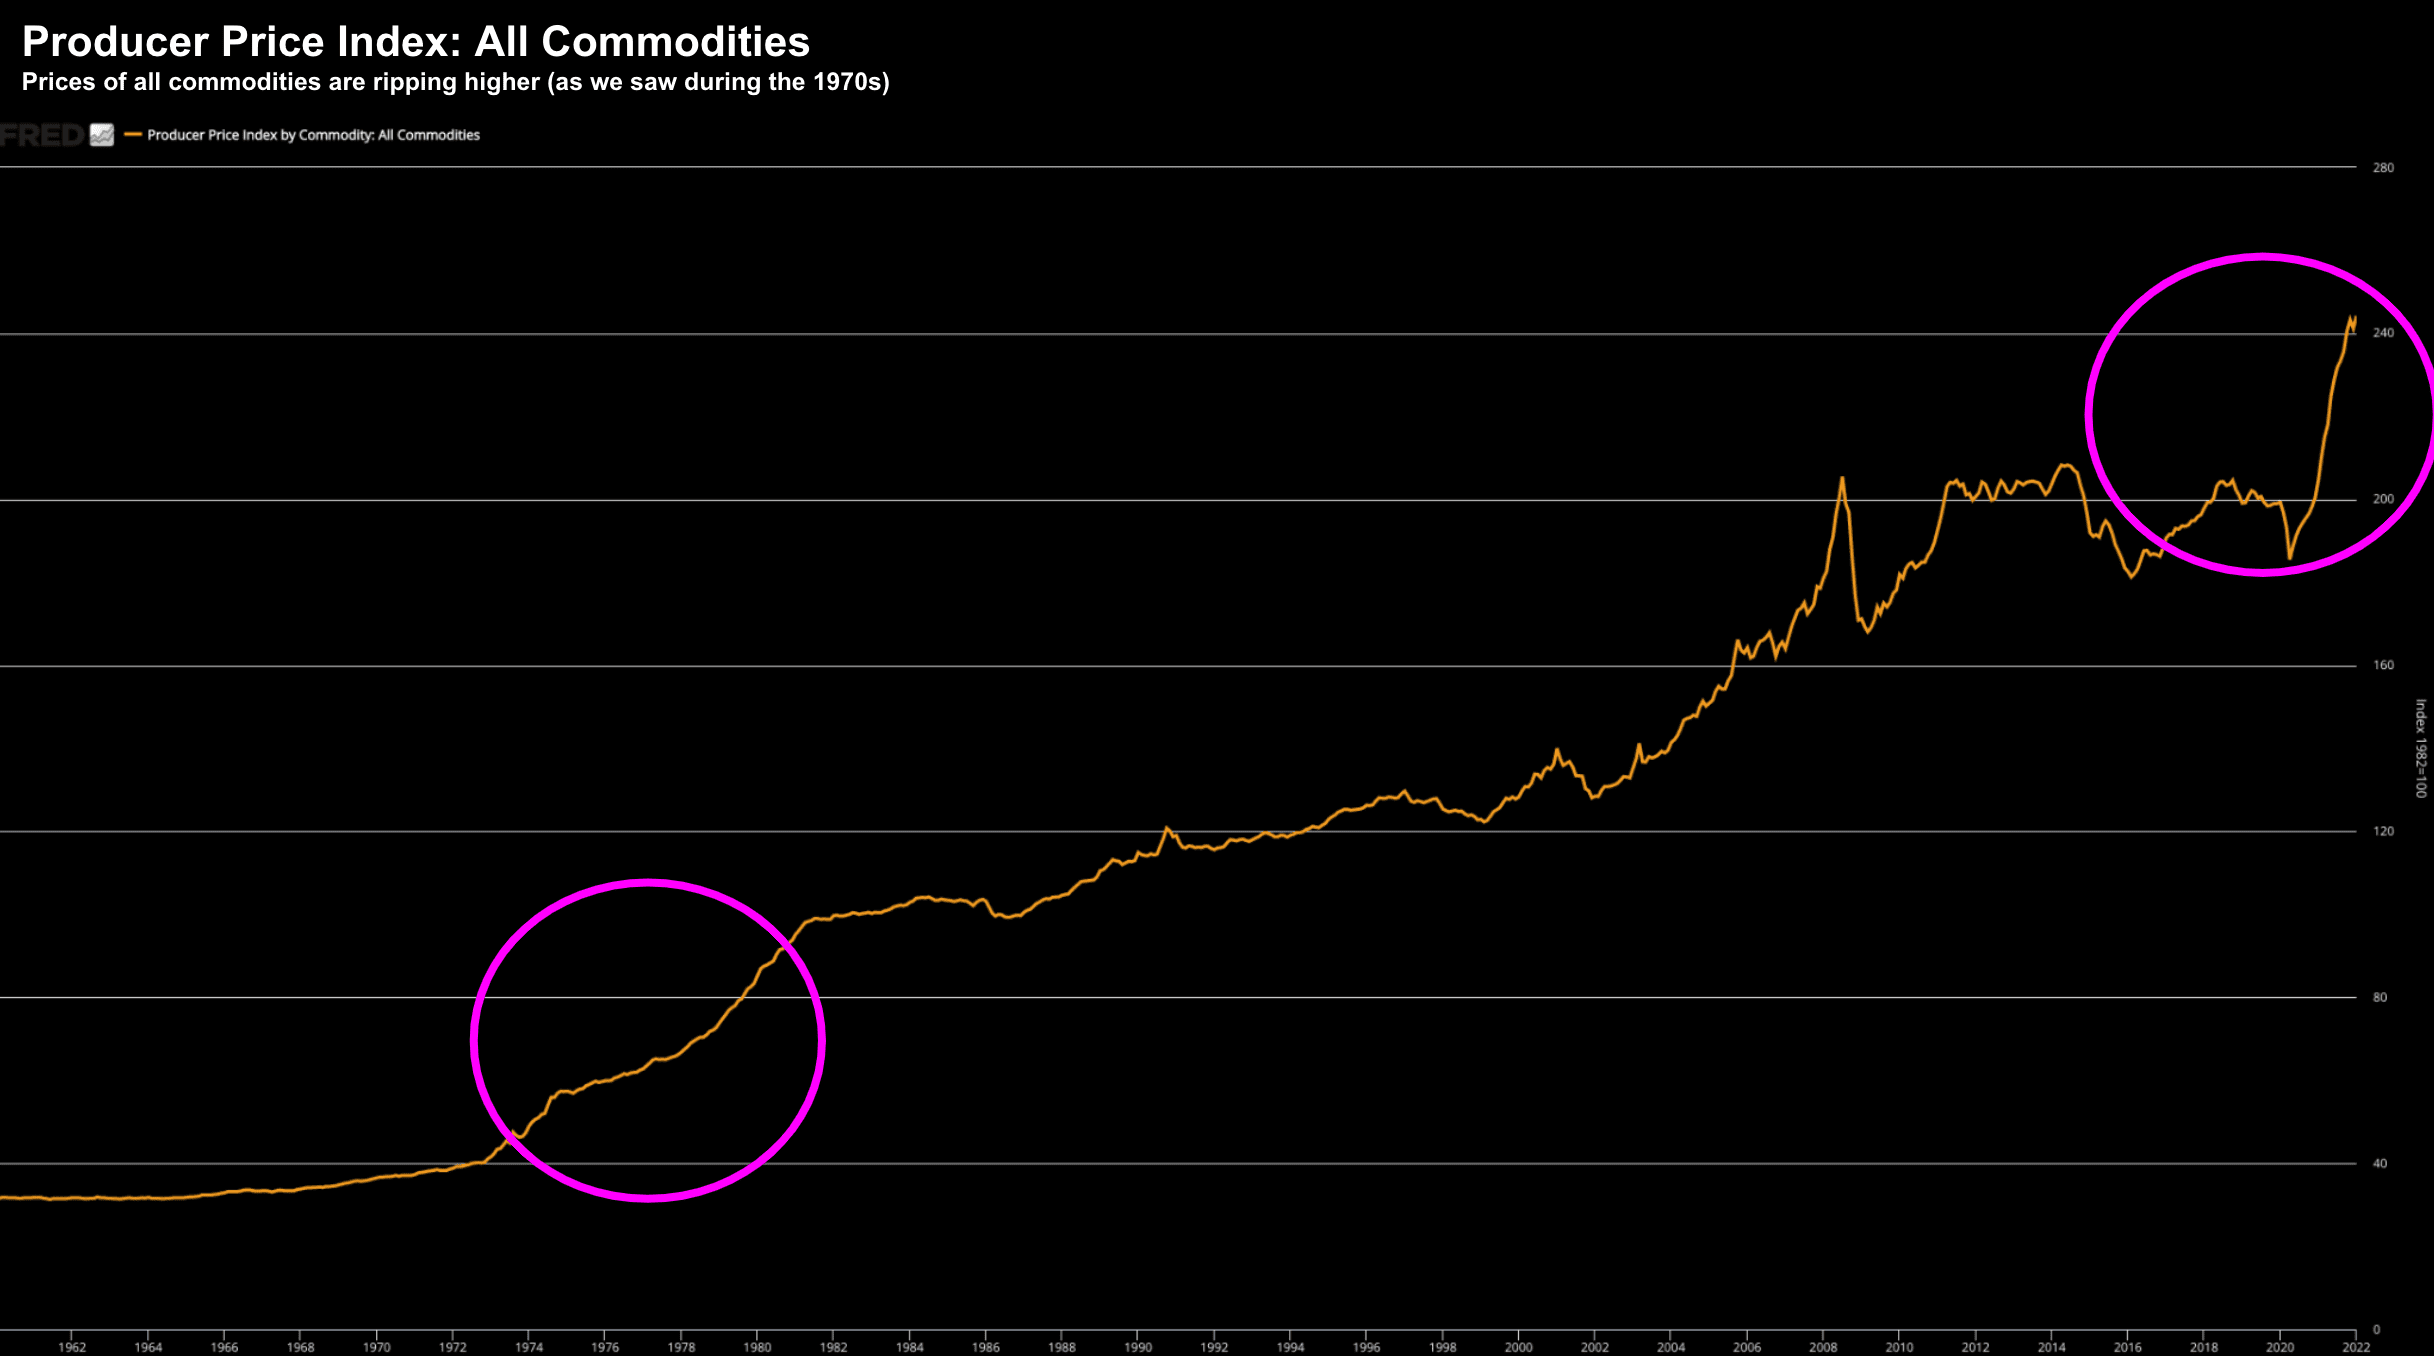
In addition, it"s hard to be remiss of what"s happening with the price of all commodities… and it"s not just oil.
Again, you only have to go to the your local supermarket to see what"s going on.
For example, wheat has traded "limit up" for five days in a row. Copper also touched a record high as warehouses are emptied.
I was listening to one Bloomberg analyst today and he said
"In 30 years of trading commodities I"ve never seen this… we"re running out of just about everything"
Well, I am 50 years old and I"ve never seen inflation like this!
Obviously this only adds to the already pressing on-going inflation concerns (evidenced below by the Producer Price Index for All Commodities)
Now at "some point" unbearably high prices create demand destruction.
I believe (or hope) oil could be close to that point above $130 p/barrel.
But it"s hard to know…
But any thoughts on "transitory inflation" impacts from the Fed"s $9 Trillion monetary experiment are gone.
Higher commodity prices all but ensure that inflation will remain extremely high in the months ahead.
As I say, my expectation is for CPI to now hit 10% in the months ahead.
This is why growth (and equity) targets coming down.
Checking with the QQQ ETF
Before I close, a few weeks ago when the market thundered lower – I said that traders were likely to "get another bite at the cherry"
You are now getting that "bite"…
The popular tech ETF QQQ is now 20.6% off its high… and in a bear market:
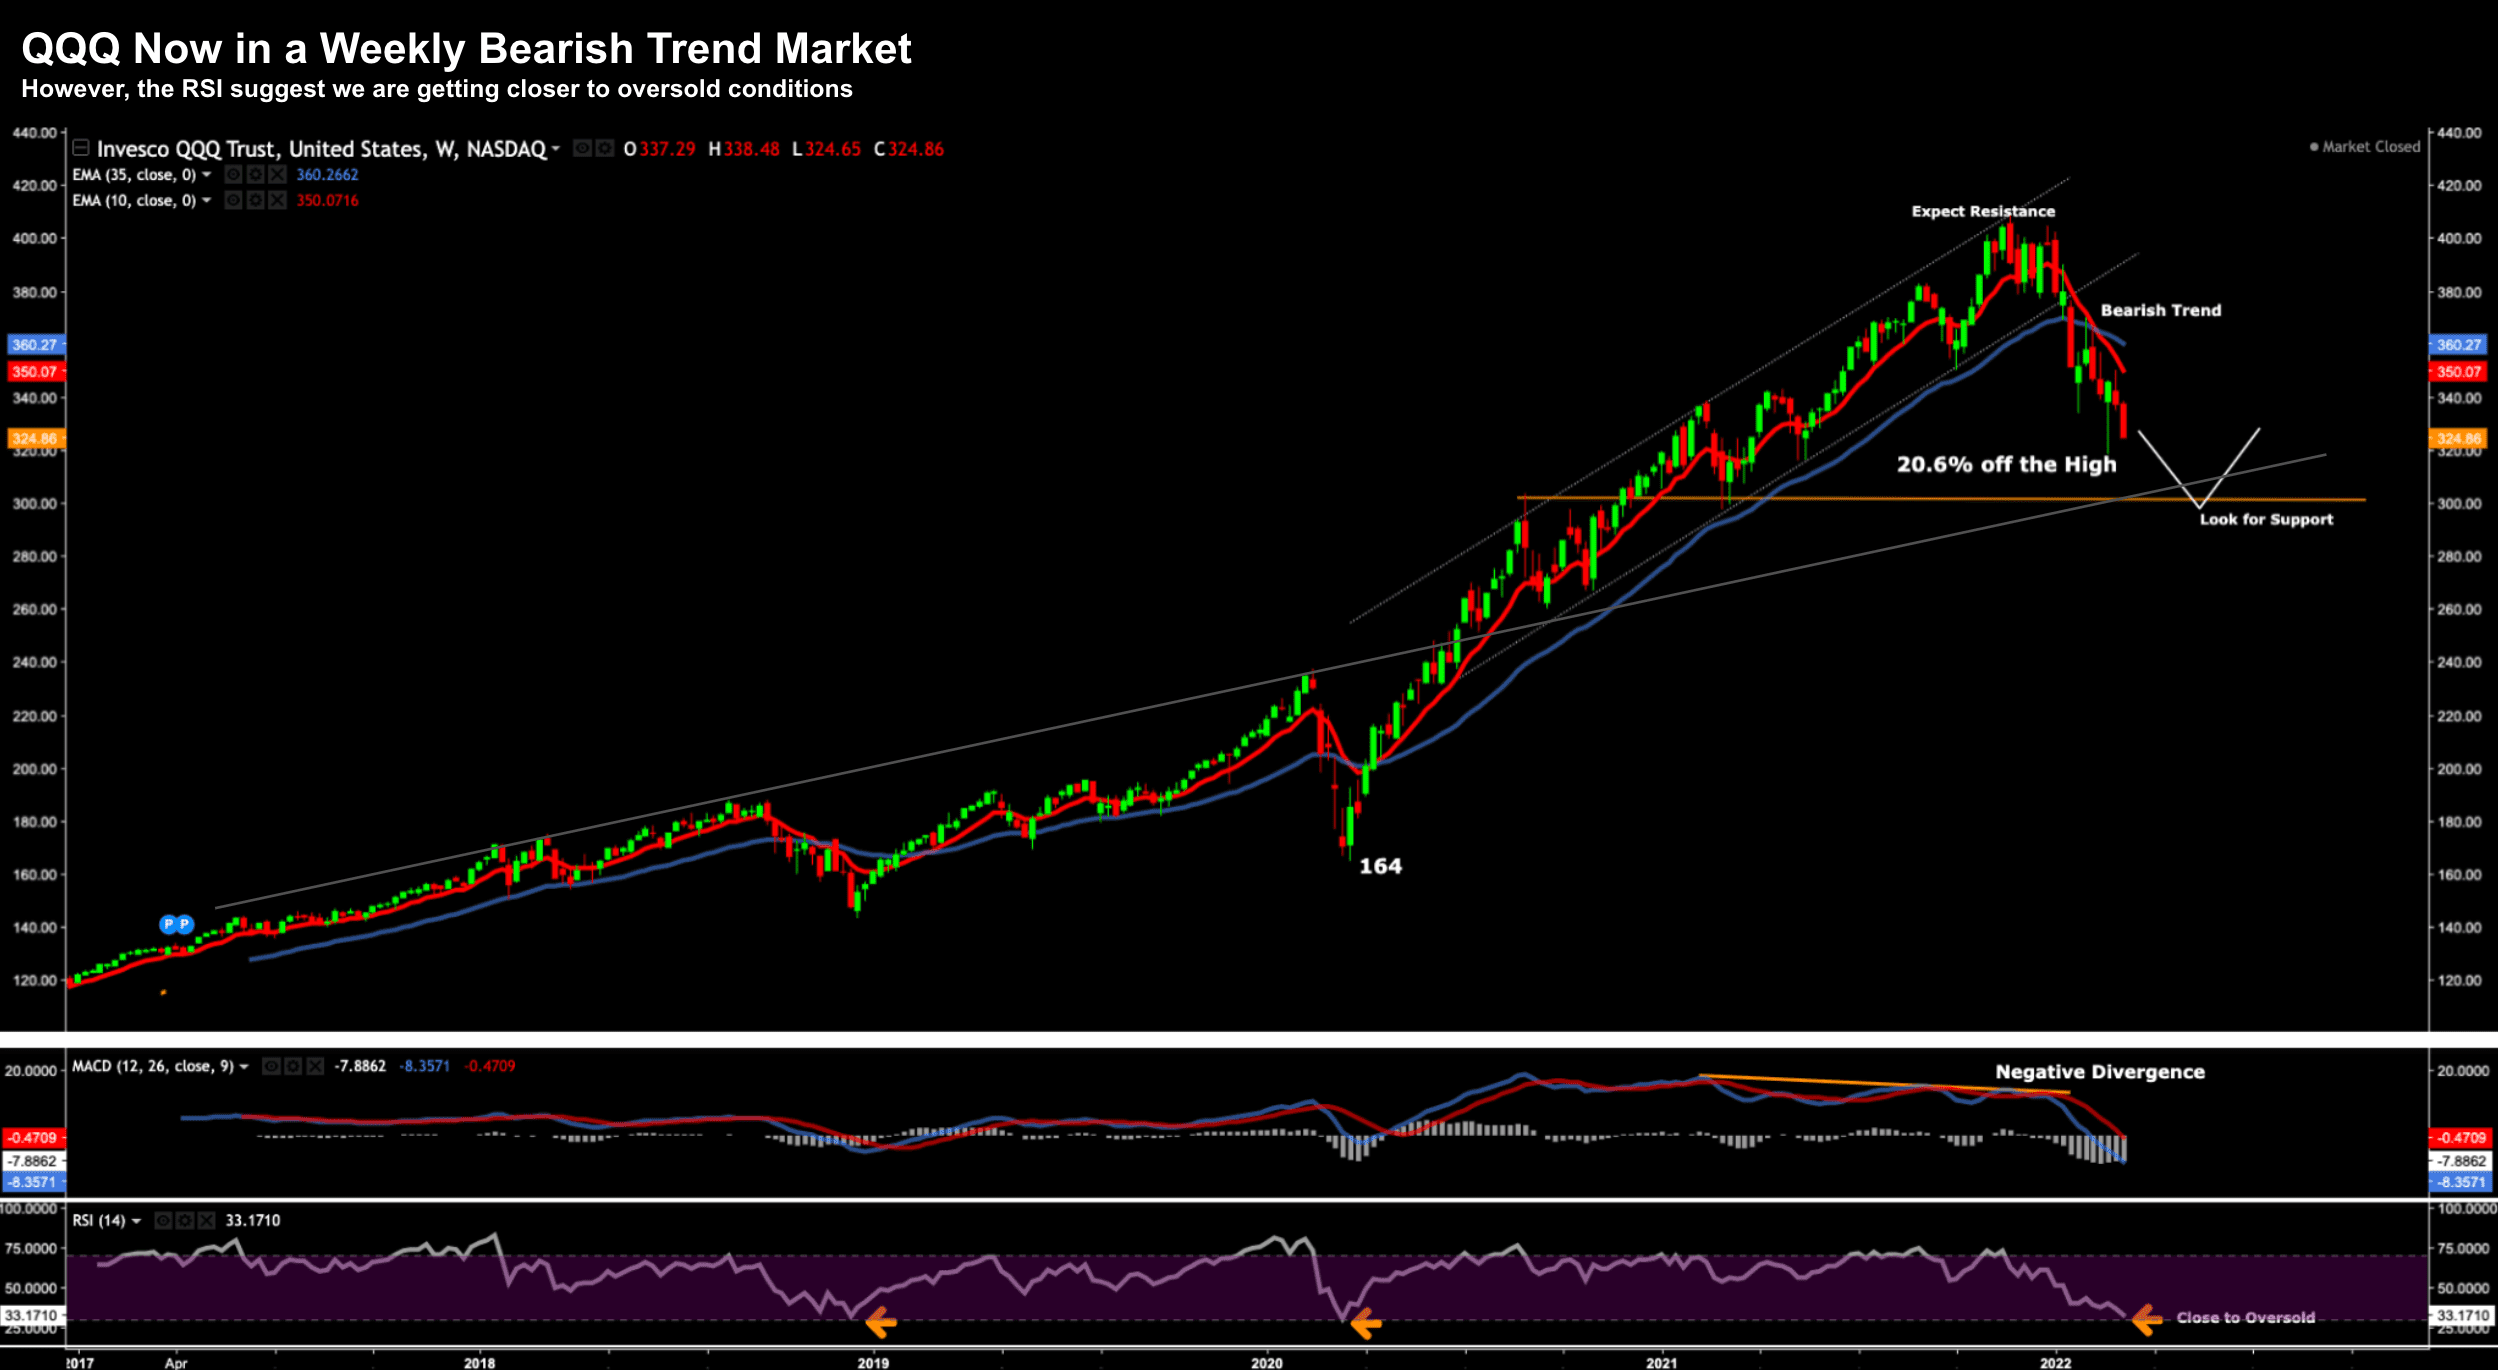
Three things with this chart:
- The weekly trend is now bearish which tells me to expect lower prices
- We could see support at the previous major low – which was also resistance August 2020
- The RSI indicator (lower window) suggests are getting closer to oversold conditions
With respect to the RSI – highlighted are two previous occasions we saw the weekly RSI below 30.
On both occasions we saw the Index rallied sharply and started a new bullish trend.
But be warned… we are not oversold yet.
Personally I think the QQQ will find support around the zone of 300 – which is around 8% lower than the current level.
And if you don"t have any exposure to the MAGA complex (Microsoft, Apple, Google and Amazon) – I would definitely start nibbling around the current levels.
And if we see another ~10% downside… I would increase my position in these names for a strong second half of 2022.
Putting it all Together
Just on headline inflation… this hurts most people.
The extra $2,000 per year (or $40 per week) at the pump is meaningful for anyone earning less than $100,000 year.
And then add to that perhaps an extra $2,000 per year to cover 20% higher food costs… and it adds up.
It"s a poor man"s tax… as it doesn"t impact the wealthy.
For example, the wealthy could not care if gas was "$10" at the pump – it"s merely another $2,000 per year.
That"s not terribly painful if you are earning say $200,000 or more.
But not for anyone earning an average salary.
That extra "$4,000" could have been spent elsewhere… now it just covers "getting to work" and putting food on the table for the family.
With respect to the market, patience is being rewarded.
We might be getting closer to a bottom…
But the volatility is far from over… with the VIX (fear index) trading above 36 – expect the market to move at least 2% every day.
My best guess is the market finds support around the zone of 4,000 on the S&P 500.
That"s still a further 5% lower than today…. but it"s not 20% lower (as was the case at 4800)
I will be putting more cash to work here.