What Typically Happens after Rate Rises?
- Historical S&P 500 6-12 month returns after initial rate rises
- Why Brad Gerstner from Altimeter Capital remains optimistic
- Two fundamental metrics all businesses should have
Two years ago this week the world stopped on a dime.
Global economies were closed and stock markets crashed to the tune of 35%.
For example, the week ending March 9th 2020 – the S&P 500 plunged 20% from its recent high.
The following week "all-hell" broke loose – it was selling at all costs – where the Index fell a further 16%.
Investors were paralyzed by fear…
One week later – the S&P 500 surged 10.1%.
Time would show that the bottom was in for the market.
Today, a new fear engulfs investors. It"s fear opposite the following:
- Monetary policy in response to unwanted inflation (i.e. how much and how fast)
- The ongoing war in Ukraine; and
- Revisions to economic growth and in turn earnings.
Now where the bottom is – who knows?
That"s a fool"s errand to try and guess.
And if you pick it – it"s luck.
What I"ve been suggesting is we"re getting closer to a "bottoming zone" where valuations of quality companies are looking more attractive.
In fact, I think it"s the best they have looked in several years (especially large-cap tech – more on this shortly)
And whilst prices can easily fall lower – those companies with strong free cash flow, balance sheets, revenue and earnings growth – are looking like great risk/reward entry points if your horizon is longer than say 2 years.
That timeframe may not work for you – but it does for me.
To that end, you need to decide if you are a short-term trader (extremely difficult to do in this climate) or an investor.
I believe your chances of success dramatically increase if you are the latter.
Let"s try and add some further color to what"s going on with a few charts…
10-Year Treasury Yields Above 2.0%
As we started the year, I felt the US 10-year treasury yield would test the zone of around 2.20%
In fact, that was the outcome I was hoping for.
Put another way, if we saw yields headed in the other direction, this would not have been a good sign.
That said, I also did not think that yields above 2.20% were sustainable.
Today the world"s most important financial asset traded around 2.14%
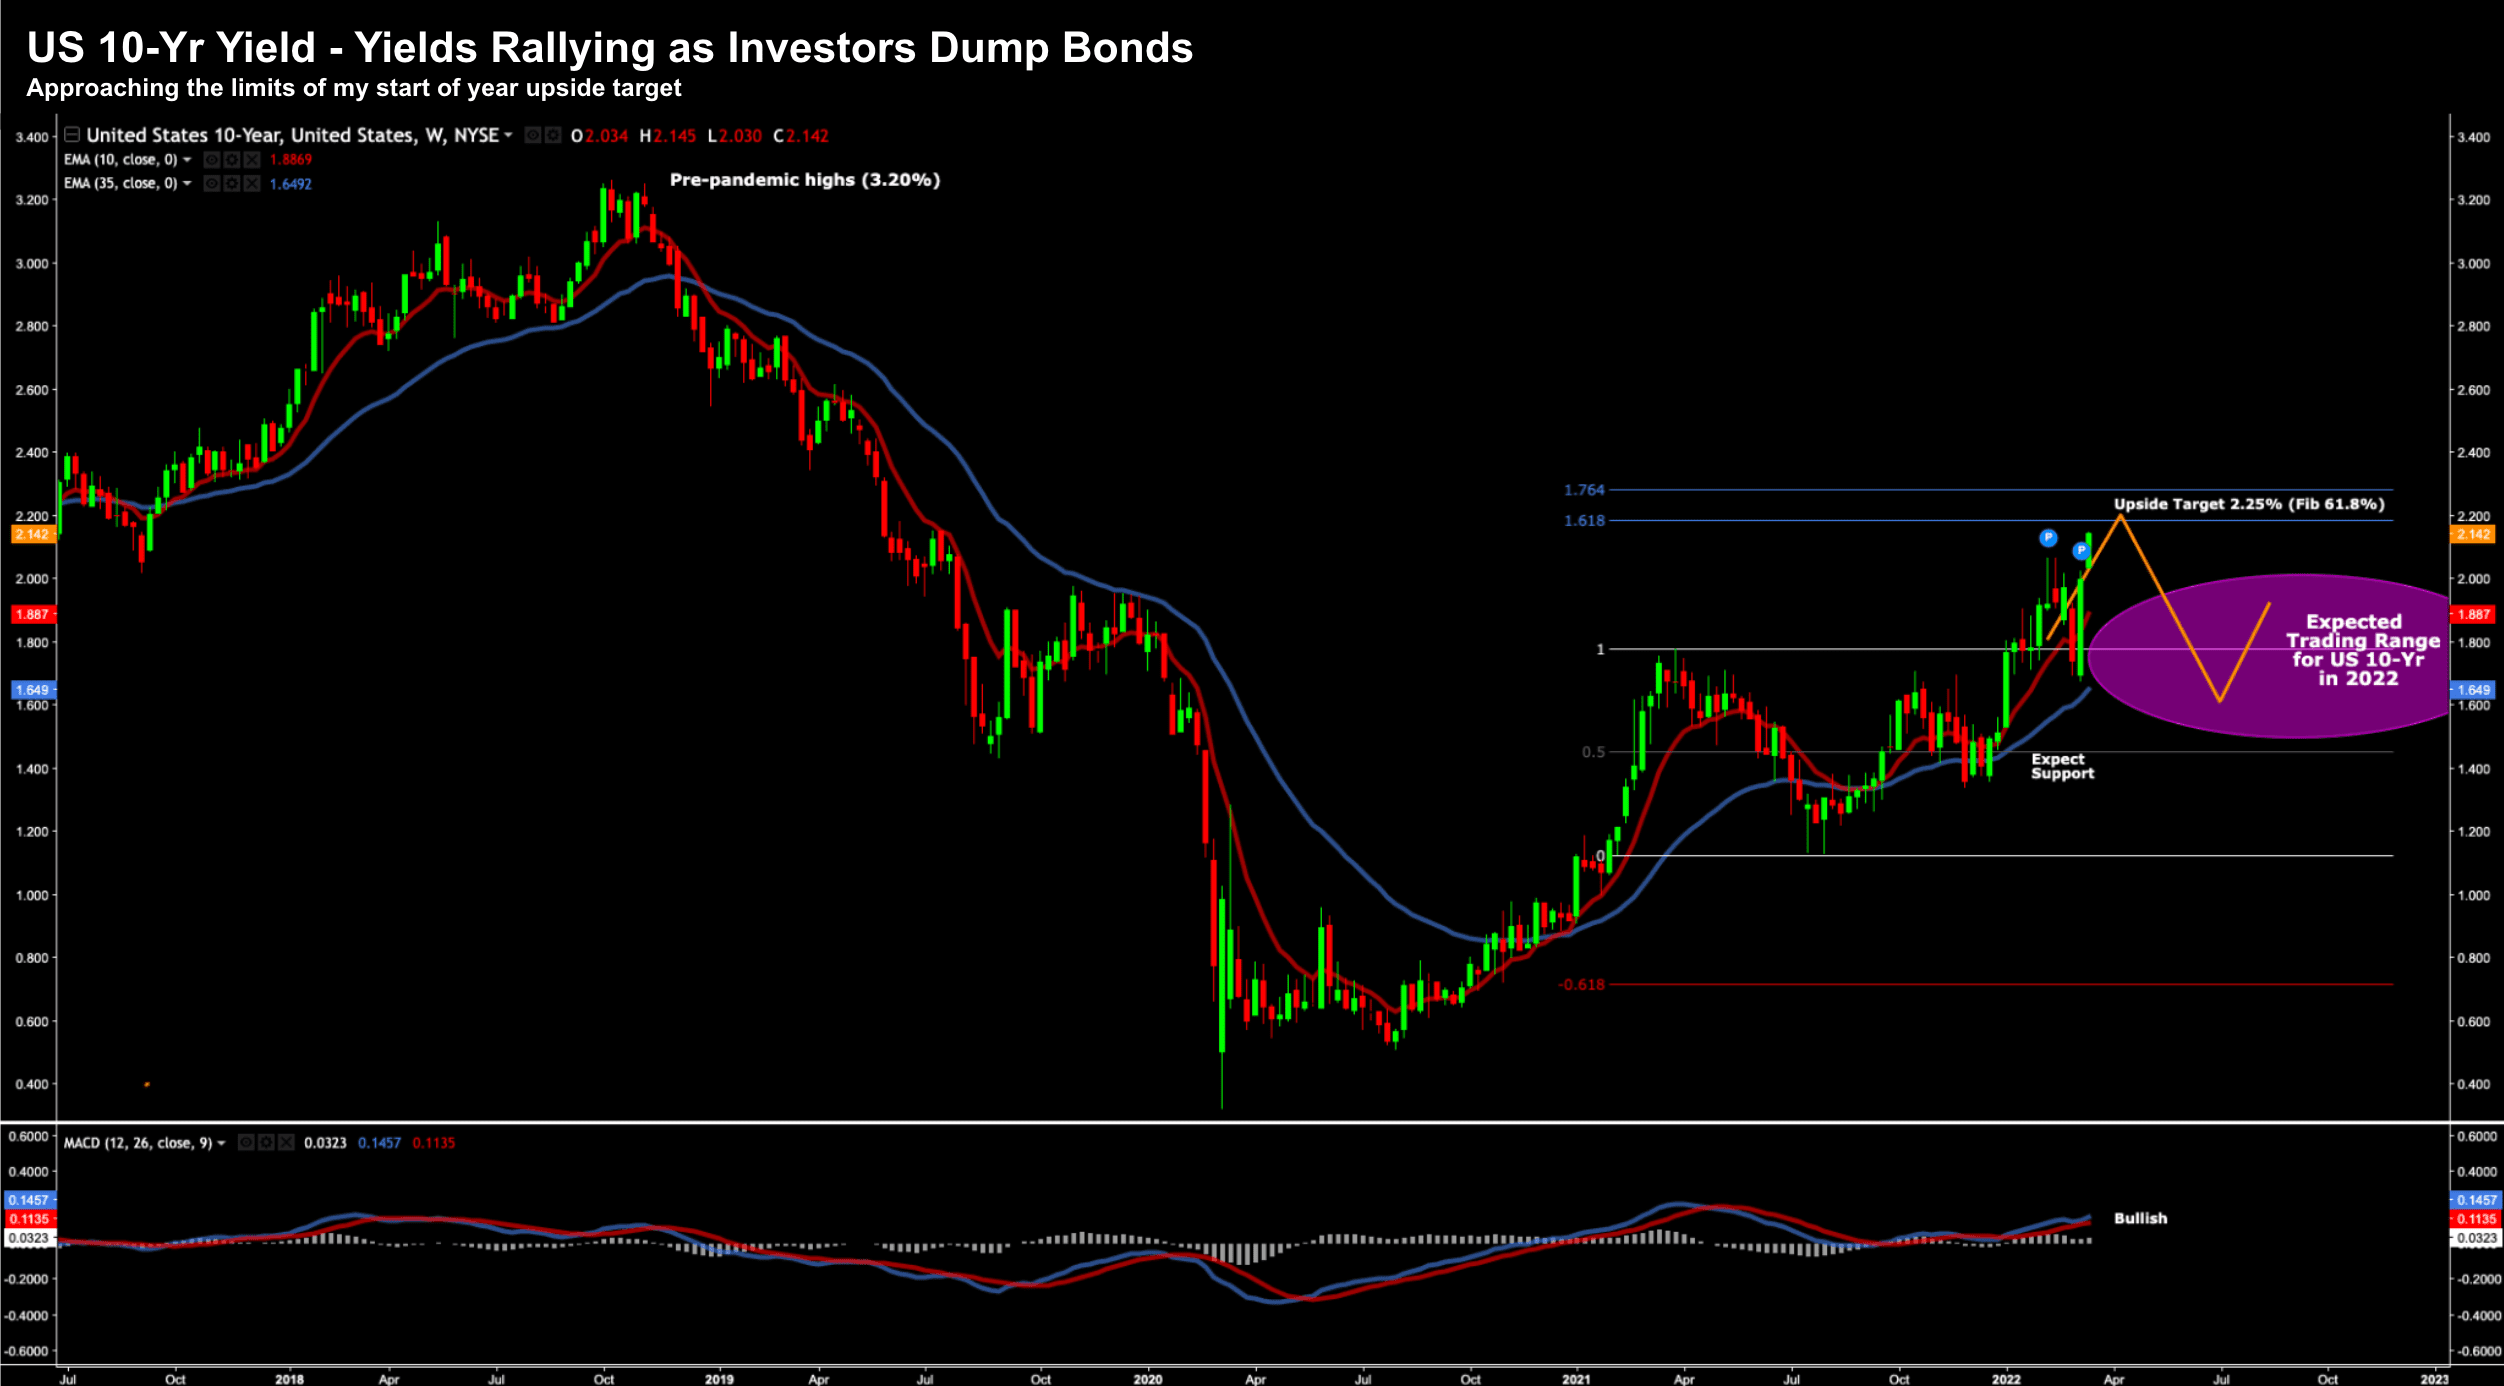
March 14 2022
This is a welcomed development as it helps steepen the yield curve.
For example, with the Fed likely to raise rates maybe 5-6 times this year (we may get greater insight into that later this week) – that would see the cash rate in the realm of 1.25% to 1.50%.
Now with the yield curve above 2.0% – in theory we should see a positively shaped curve (e.g. 2-year vs 10-year)
However, I also think we"re approaching the "upper limits" of where 10-year yields will potentially face resistance.
My expectation is for 10-year yields to ease over the coming weeks and months (i.e., as investors start buying bonds).
Crude Oil Comes Back to Earth
WTI Crude was my #1 chart this year in terms of shaping the macro economy.
This forecast wasn"t opposite any expected war with Russia…
This was due to the US domestic "war" on fossil fuel production.
My expectation was demand was likely to increase – but supply faced risks of being constrained.
The war in Ukraine has simply exaggerated the supply-side problem (which has Biden negotiating with other ruthless Dictators)
Beyond the obvious – the truth was in the chart:
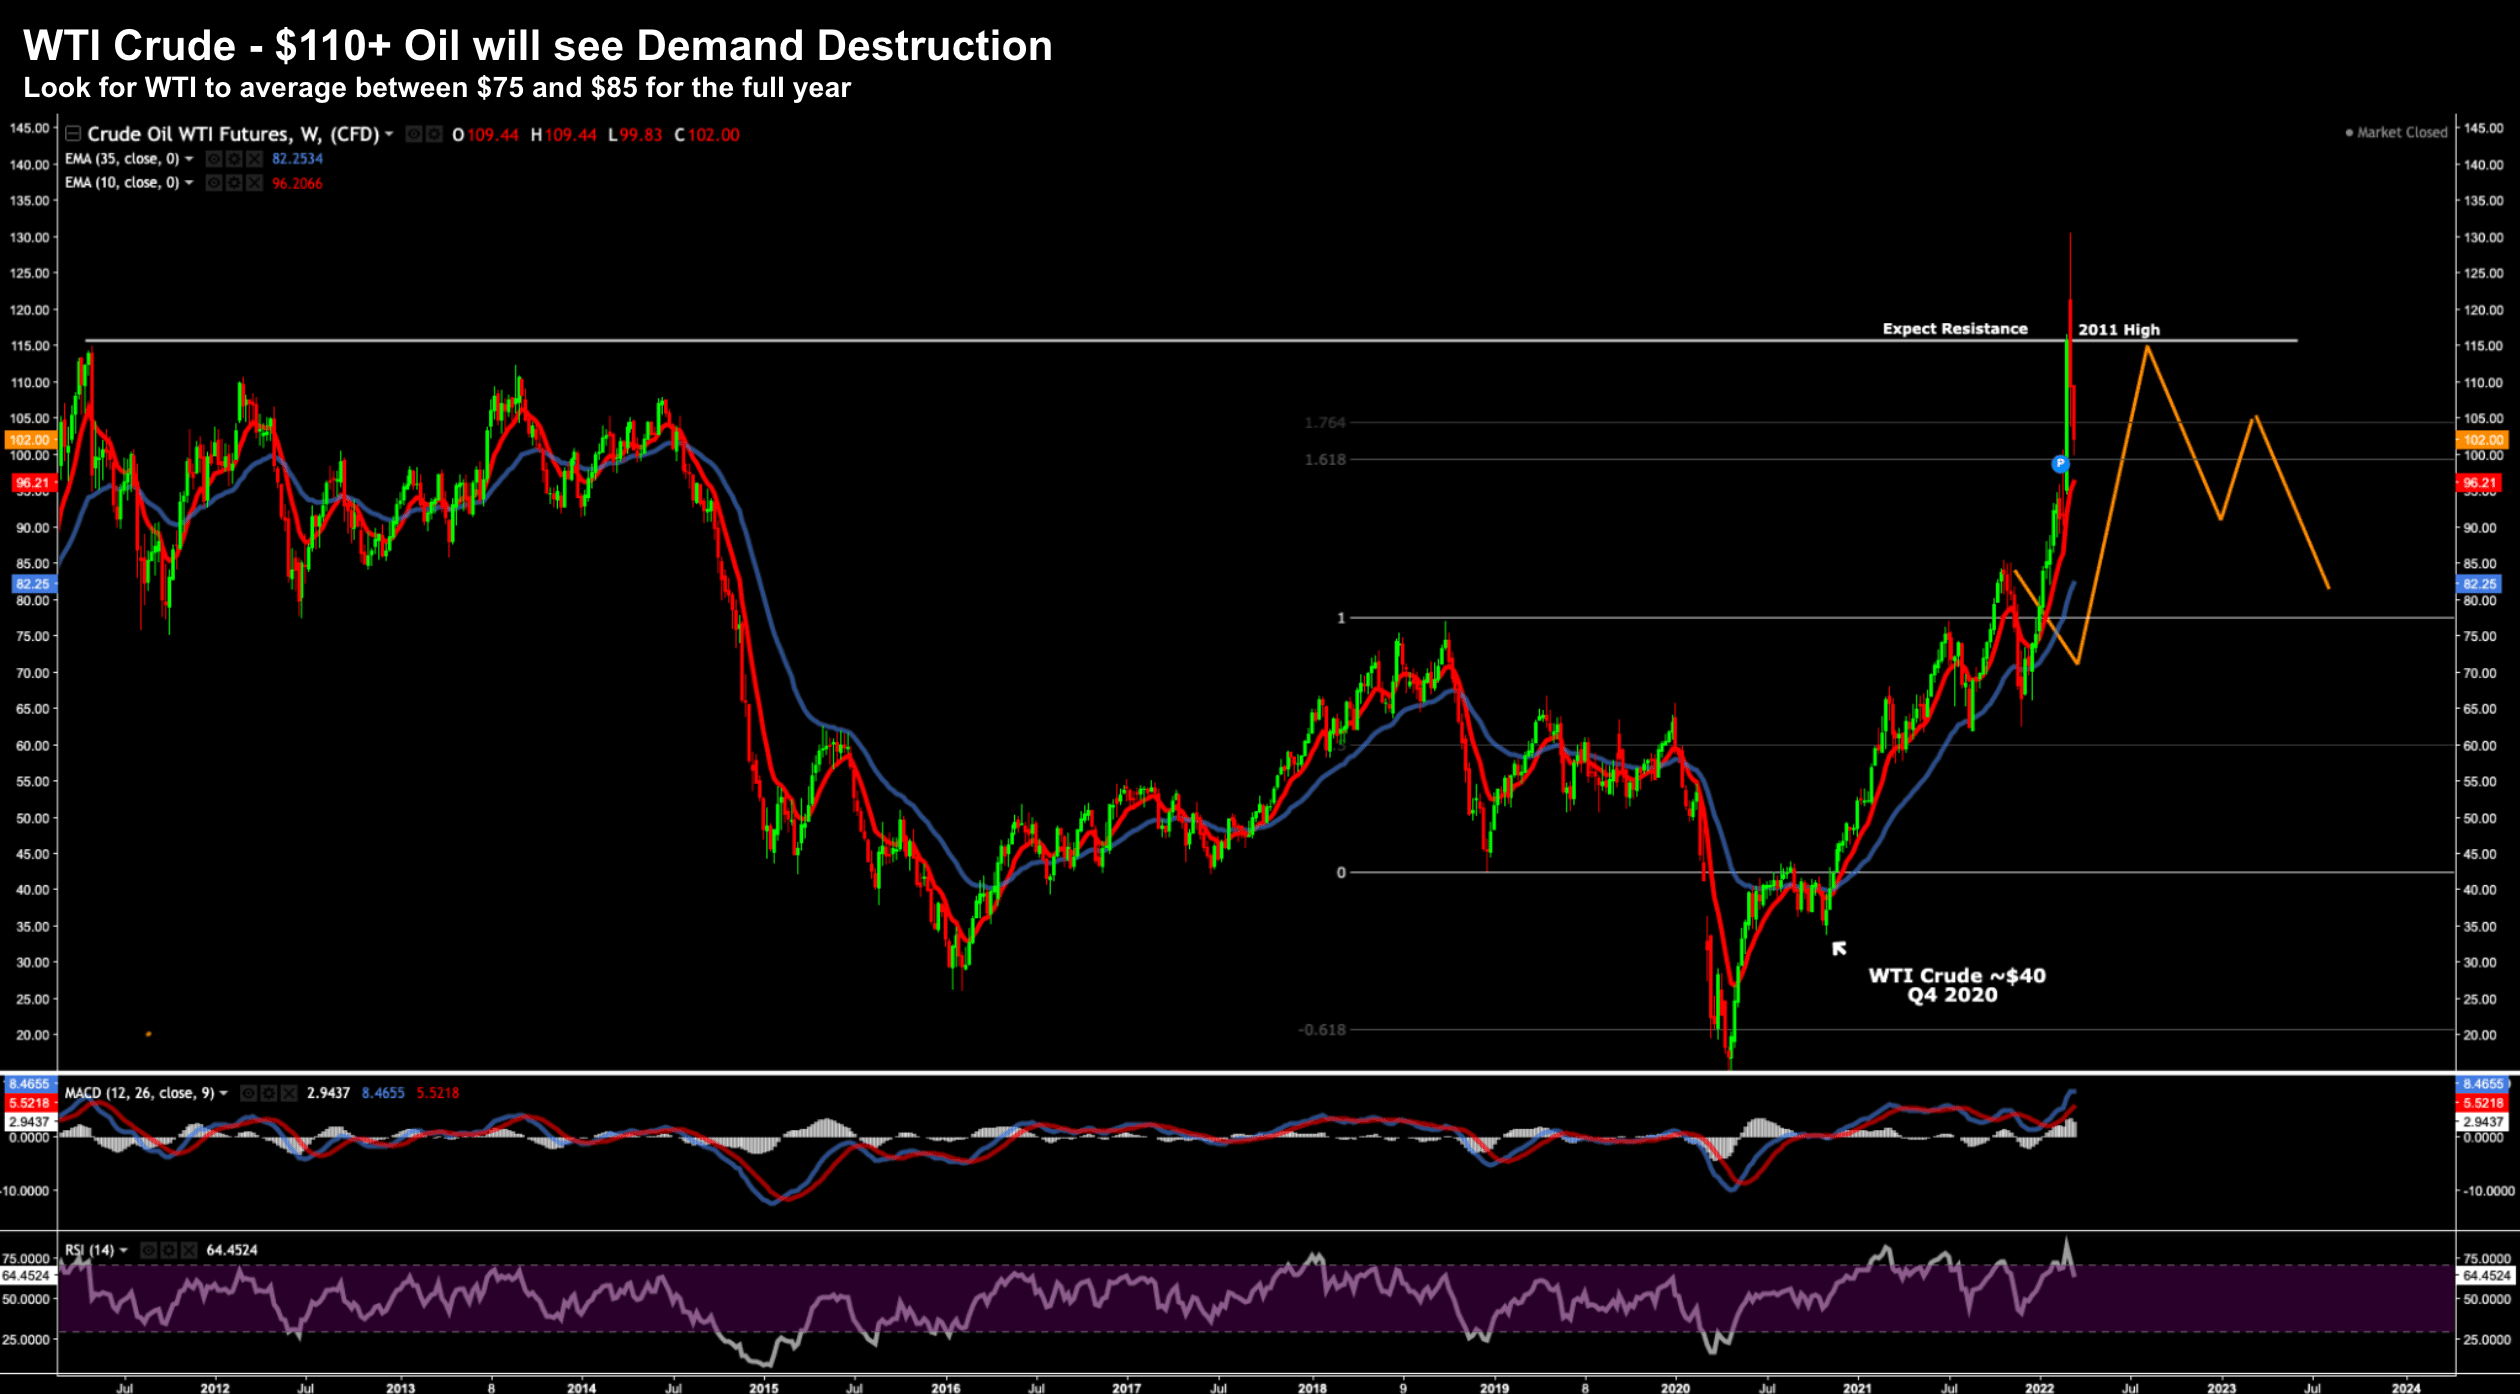
March 14 2022
Crude was flying higher well before any war broke out in Europe.
From mine, the path of least resistance was higher (not lower).
The good news is for WTI Crude to remain above $120 for a sustained period is almost economically impossible.
At some point, you get demand destruction. And I think we are starting to see that now.
For example, people are flying less given the high price of airfares; and shopping malls are reporting far lower foot traffic as people drive less miles.
What happens as a result?
The price of all has to come down.
And I am reasonably sure it will.
The other data point is what we see with oil futures. For example, June 2023 contracts are trading for around $79
This tells me the futures market also sees crude falling.
But what"s most important here is a lower oil price will help lift consumer confidence – which is now down a whopping 32% over the last 11 months.
Not hard to explain – you only need to ask if people feel better off?
The answer is likely to be a resounding no…. not with inflation pushing 8% year-on-year… and their 401Ks some 15% lower.
What Typically Happens after Rate Rises?
Above all else, I think the biggest concern facing investors today is neither Ukraine or $110+ WTI Crude – it"s the Fed.
And there are two questions which are very difficult to answer when it comes to rate tightening:
- How many? and
- How fast?
This week will most likely see the Fed lift rates by 25 basis points.
The market has this priced in… but I"ve read a range of estimates on where rates are at the end of this year.
For example, some believe the Fed doesn"t have the luxury to raise rates as much as "7-8 times" given Russia"s war with Ukraine and sharply slowing economic growth. Many now expect Q1 GDP to only come in somewhere in the realm of 0.5 to 0.8%.
On the other side of the coin – many feel the Fed needs to do more to rein in inflation (despite the risks of lower growth).
And I"m in that camp.
Irrespective – it"s reasonable to assume at least 4 rate hikes are coming.
So how will the market respond?
To help answer this question I looked at how the S&P 500 has reacted in the immediate 6 and 12-months after the Fed first starting raising rates:
In short, the reaction from stocks has been overwhelmingly positive.
Below is what we have seen with the effective Fed Funds Rate from 1983. Labelled are the 6 occasions when the Fed embarked on an upward rate cycle:
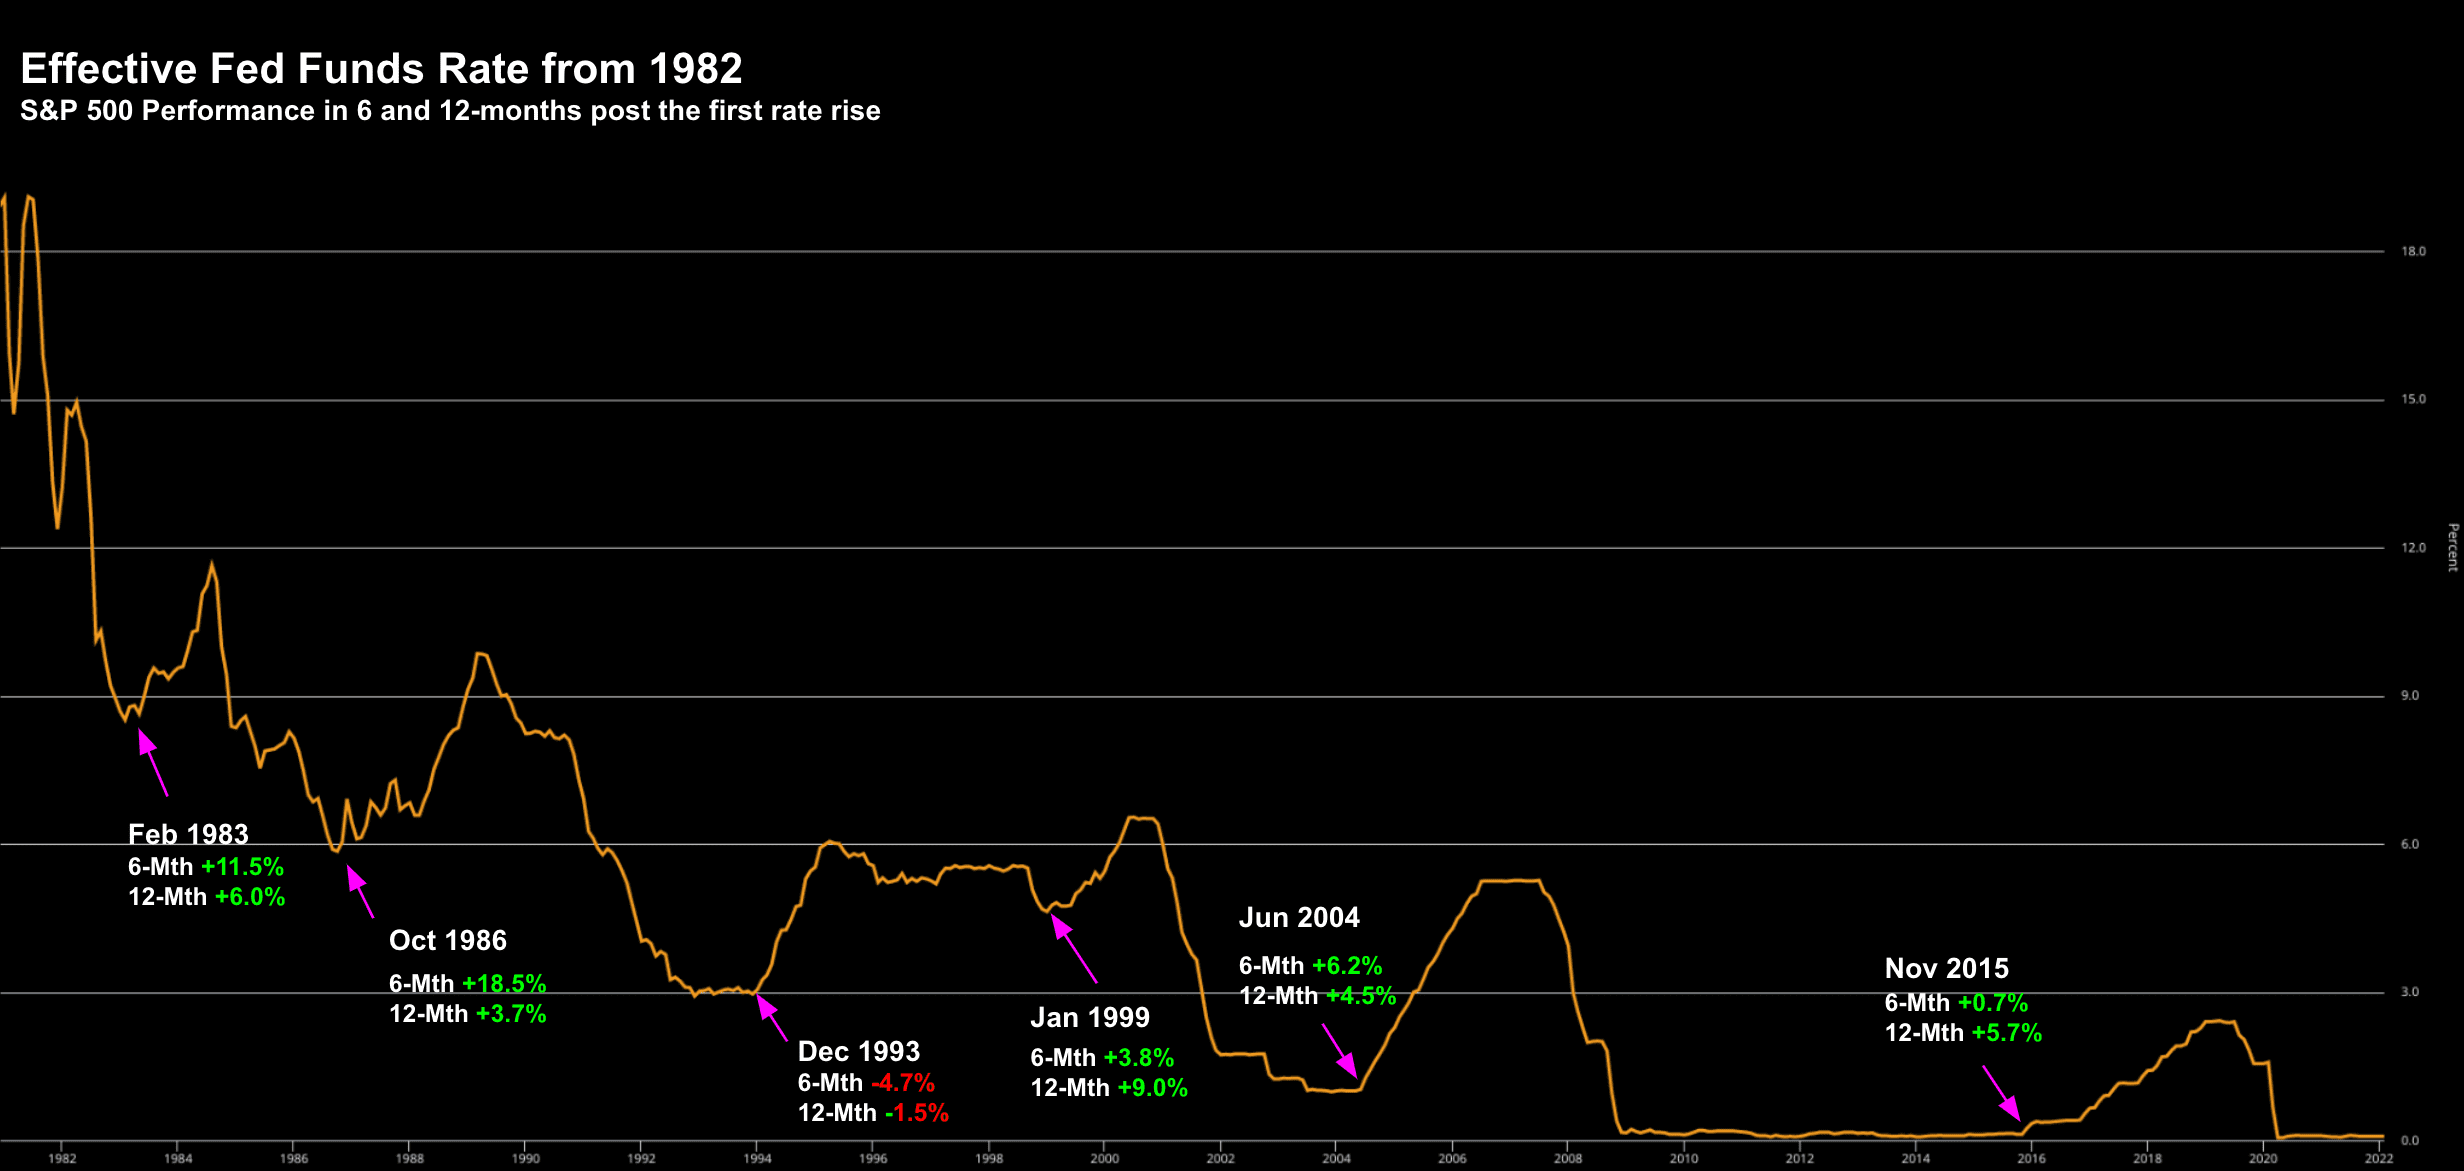
March 14 2022
Also labelled is the performance of the S&P 500 over 6 and 12 months respective.
For example, in Feb 1983, the S&P 500 rallied 11.5% the next 6 months after the first rate rise. And if measured over 12 months – the market rallied 6.0%
Across these 6 different cycles – below are the averages:
- Avg 6-month gain ~6.0%
- Avg 12-month rally ~4.6%
There was only one negative 6/12 month period – the initial rate hike of Dec 1993.
However, markets took off in 1994.
The takeaway (for me) is that equities typically react well (in the short-term) after initial rate hikes.
In addition, interest rates need to be sharply higher (e.g., a nominal rate closer to 3.0%) to pose a meaningful risk to equities.
And to that end – I think the second half sets up well for a relief rally.
However, those odds look even better if your time horizon is longer.
Brad Gerstner on the Tech Sell-Off
Earlier today I listed to a great interview with Brad Gerstner – who leads Altimeter Capital
Altimeter has enjoyed above average returns the past few years (outperforming the Index by several hundred percent) – however their (tech focused) growth fund has been slammed the past 12 months.
Below we see the S&P 500 in dark-green vs Altimeter (light-green) from 2020:
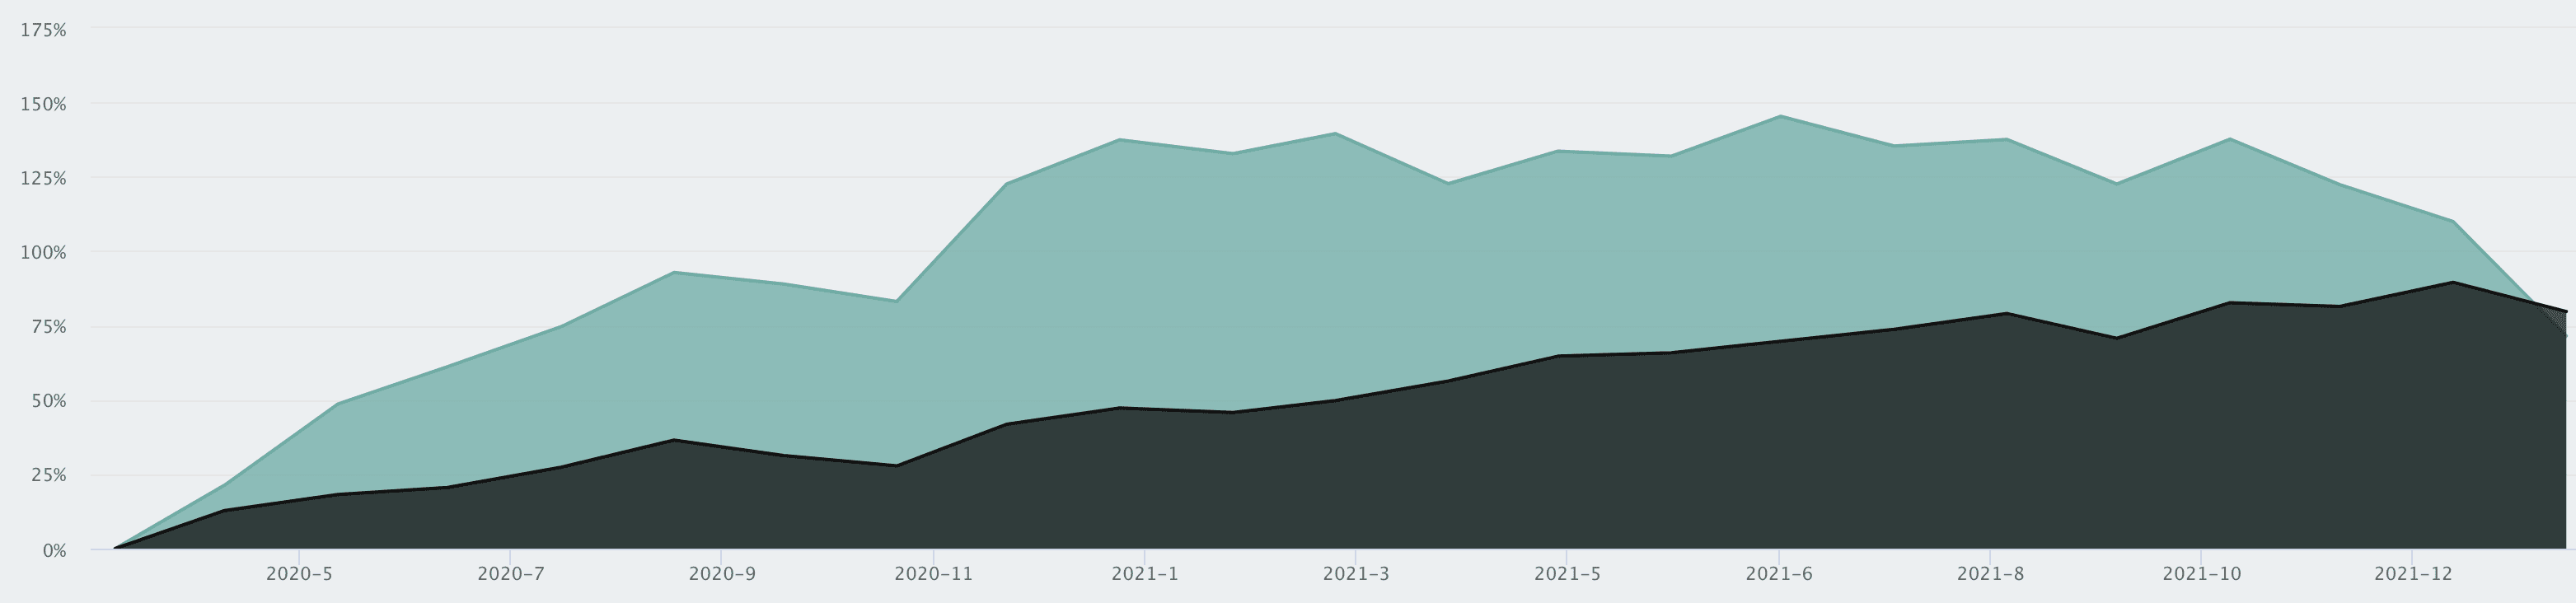
Altimeter vs S&P 500 – March 14 2022
Despite this, the founder and CEO remains confident on the longer-term view.
Altimeter"s largest Top 10 holdings are summarized below.
The table shows the relative allocation to each position; Altimeter"s average entry price; latest closing price; percentage move from the avg entry price; the stock"s all-time high; and the subsequent correction from the market high (right-hand column).
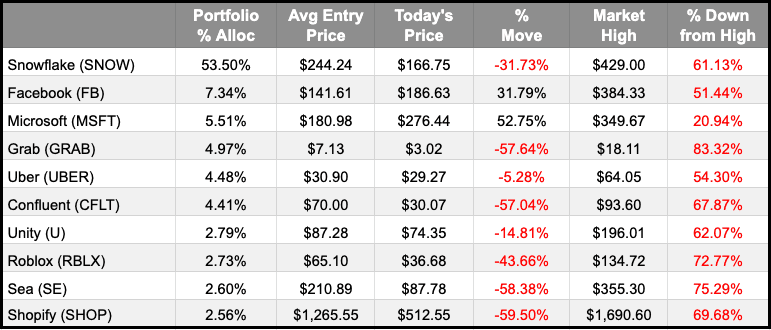
Altimeter"s Top 10 Holdings – 13F Filing Q4 2021
The right-hand column is tough to swallow…
These 10 stocks have fallen anywhere from 20.94% (MSFT) to a whopping 83.32% (GRAB).
And that"s pretty much consistent across the sector…
Now Altimeter"s largest position is Snowflake (SNOW) – which constitutes a massive 53.50% of the fund (~$2.7B market value at today"s price)
That"s a concentrated bet (not unlike Warren Buffet with his bet on Apple).
Despite the bloodbath in these stocks (and hit to his portfolio) – Gerstner feels good about these positions.
He stressed how each position shows strong positive free cash flow and is potentially set to gain as much "100% upside" over the next 2-3 years.
That said, he also said these stocks could easily trade lower before they recover.
And that"s fine from his perspective….
Gerstner added that the single biggest lever on growth multiples are interest rates.
To use his language "the Fed enabled massive distortion on the way-in… and now it will be on the way-out"
We are now on the way out!
The way I like to say it is "the Fed exaggerates both the boom and bust cycle".
To illustrate, he said over the past 12 months – something like $15T of market wealth has been destroyed (from the market).
What"s more, the drawdown we"ve seen in stocks over 2021/22 now ranks in the Top 3 of the past 20 years (only 2000 and 2008 were worse)
That said, he is not seller (despite the pain)
He believes that stocks such as SNOW, FB and UBER are going to be worth significantly more overt the next 2-3 years… emphasizing their sound fundamentals (e.g., strong free cash flow; profit margins) and strength of "moats" in their respective markets.
For example, Gerstner echoed much of that I shared on SNOW recently; i.e.,
- Adding ~$1.4B of incremental contracted value last year;
- Revenue growth at 106%;
- Smashing earnings expectations;
- Expanded use-cases; and all this growth with
- 15% cash flow margins (which is ~5 years ahead of target)
He reinforced what he sees as "endless demand" for the products and services he has in his portfolio.
Whether that is online advertising networks, enterprise cloud computing, content creation platforms (e.g., Unity and Roblox); or a direct-to-consumer B2B shopping platform like Shopify.
And given these companies are growing at double-digit (some triple digit) rates with strong free cash flow – he is not concerned about the near-term sell-off.
Putting it all Together
For me, the key takeaway from Gerstner"s comments was this…
You want to rotate your investment capital into companies with two key properties:
- strong free cash flow; and
- great margins.
He said that if companies can scale their business with these qualities intact – the share price will catch up.
And I agree with that.
The problem is many of these high-flying / high-multiple tech stocks were achieving strong revenue growth – but without strong free cash flow; or profit margins.
And that"s not sustainable.
Gerstner believes that "many" of these high-flyers will likely go broke over the next couple of years.
He maintained a strong conviction on the 2-3 year horizon for stocks like (but not limited to) "SNOW, MSFT, FB, SHOP and UBER" (n.b. I own each of these).
That said, there are risks.
We are likely to see more downside in the near-term given the economic climate and uncertainties; and there is always the risk of recession over the next 24 months.
And whilst he believes the Fed will hike no more than 5 times this year – he doesn"t believe the Fed will run the economy head-on into a recession.
But again, he said that remains a risk.