Markets Could see a Near-Term Bounce
- Looking for bounce soon – but will it stick?
- Bulls need to re-claim 4400 on the S&P 500
- Why the market has already priced in 7 rate hikes
Today stocks caught a bid…
The Dow popped 1.8% and the S&P 500 climbed 2.1%.
That said, the broader market is still some 11% off its early January all-time high (more on that shortly with the chart).
Tech led the charge (from oversold levels) and rallied ~2.9%
So here"s todays exam question:
Are we approaching a near or longer-term bottom?
That"s very hard to answer…
But I do think we might be about to encounter a short-term bounce.
That said, there are a few technical hurdles the market needs to overcome before we turn outright bullish.
This post puts on our technical hat… something I do to try and cut through all the noise.
And whilst I love owning exceptionally fundamentally strong stocks for the long-term (many of which are now ~20% off their highs) – technical analysis goes a long way towards understanding where things could be going.
And ideally – these two views align (which isn"t always the case).
First some words on the Fed…
Fed"s First Hike in 3 Years…
Tomorrow we hear from the Fed on their first rate hike in 3 years.
And whilst I think they are almost 12 months late – we are finally here.
Now markets have already priced in a 25 basis point rise.
In fact, I think market"s are already working with as many as 5-7 rate hikes.
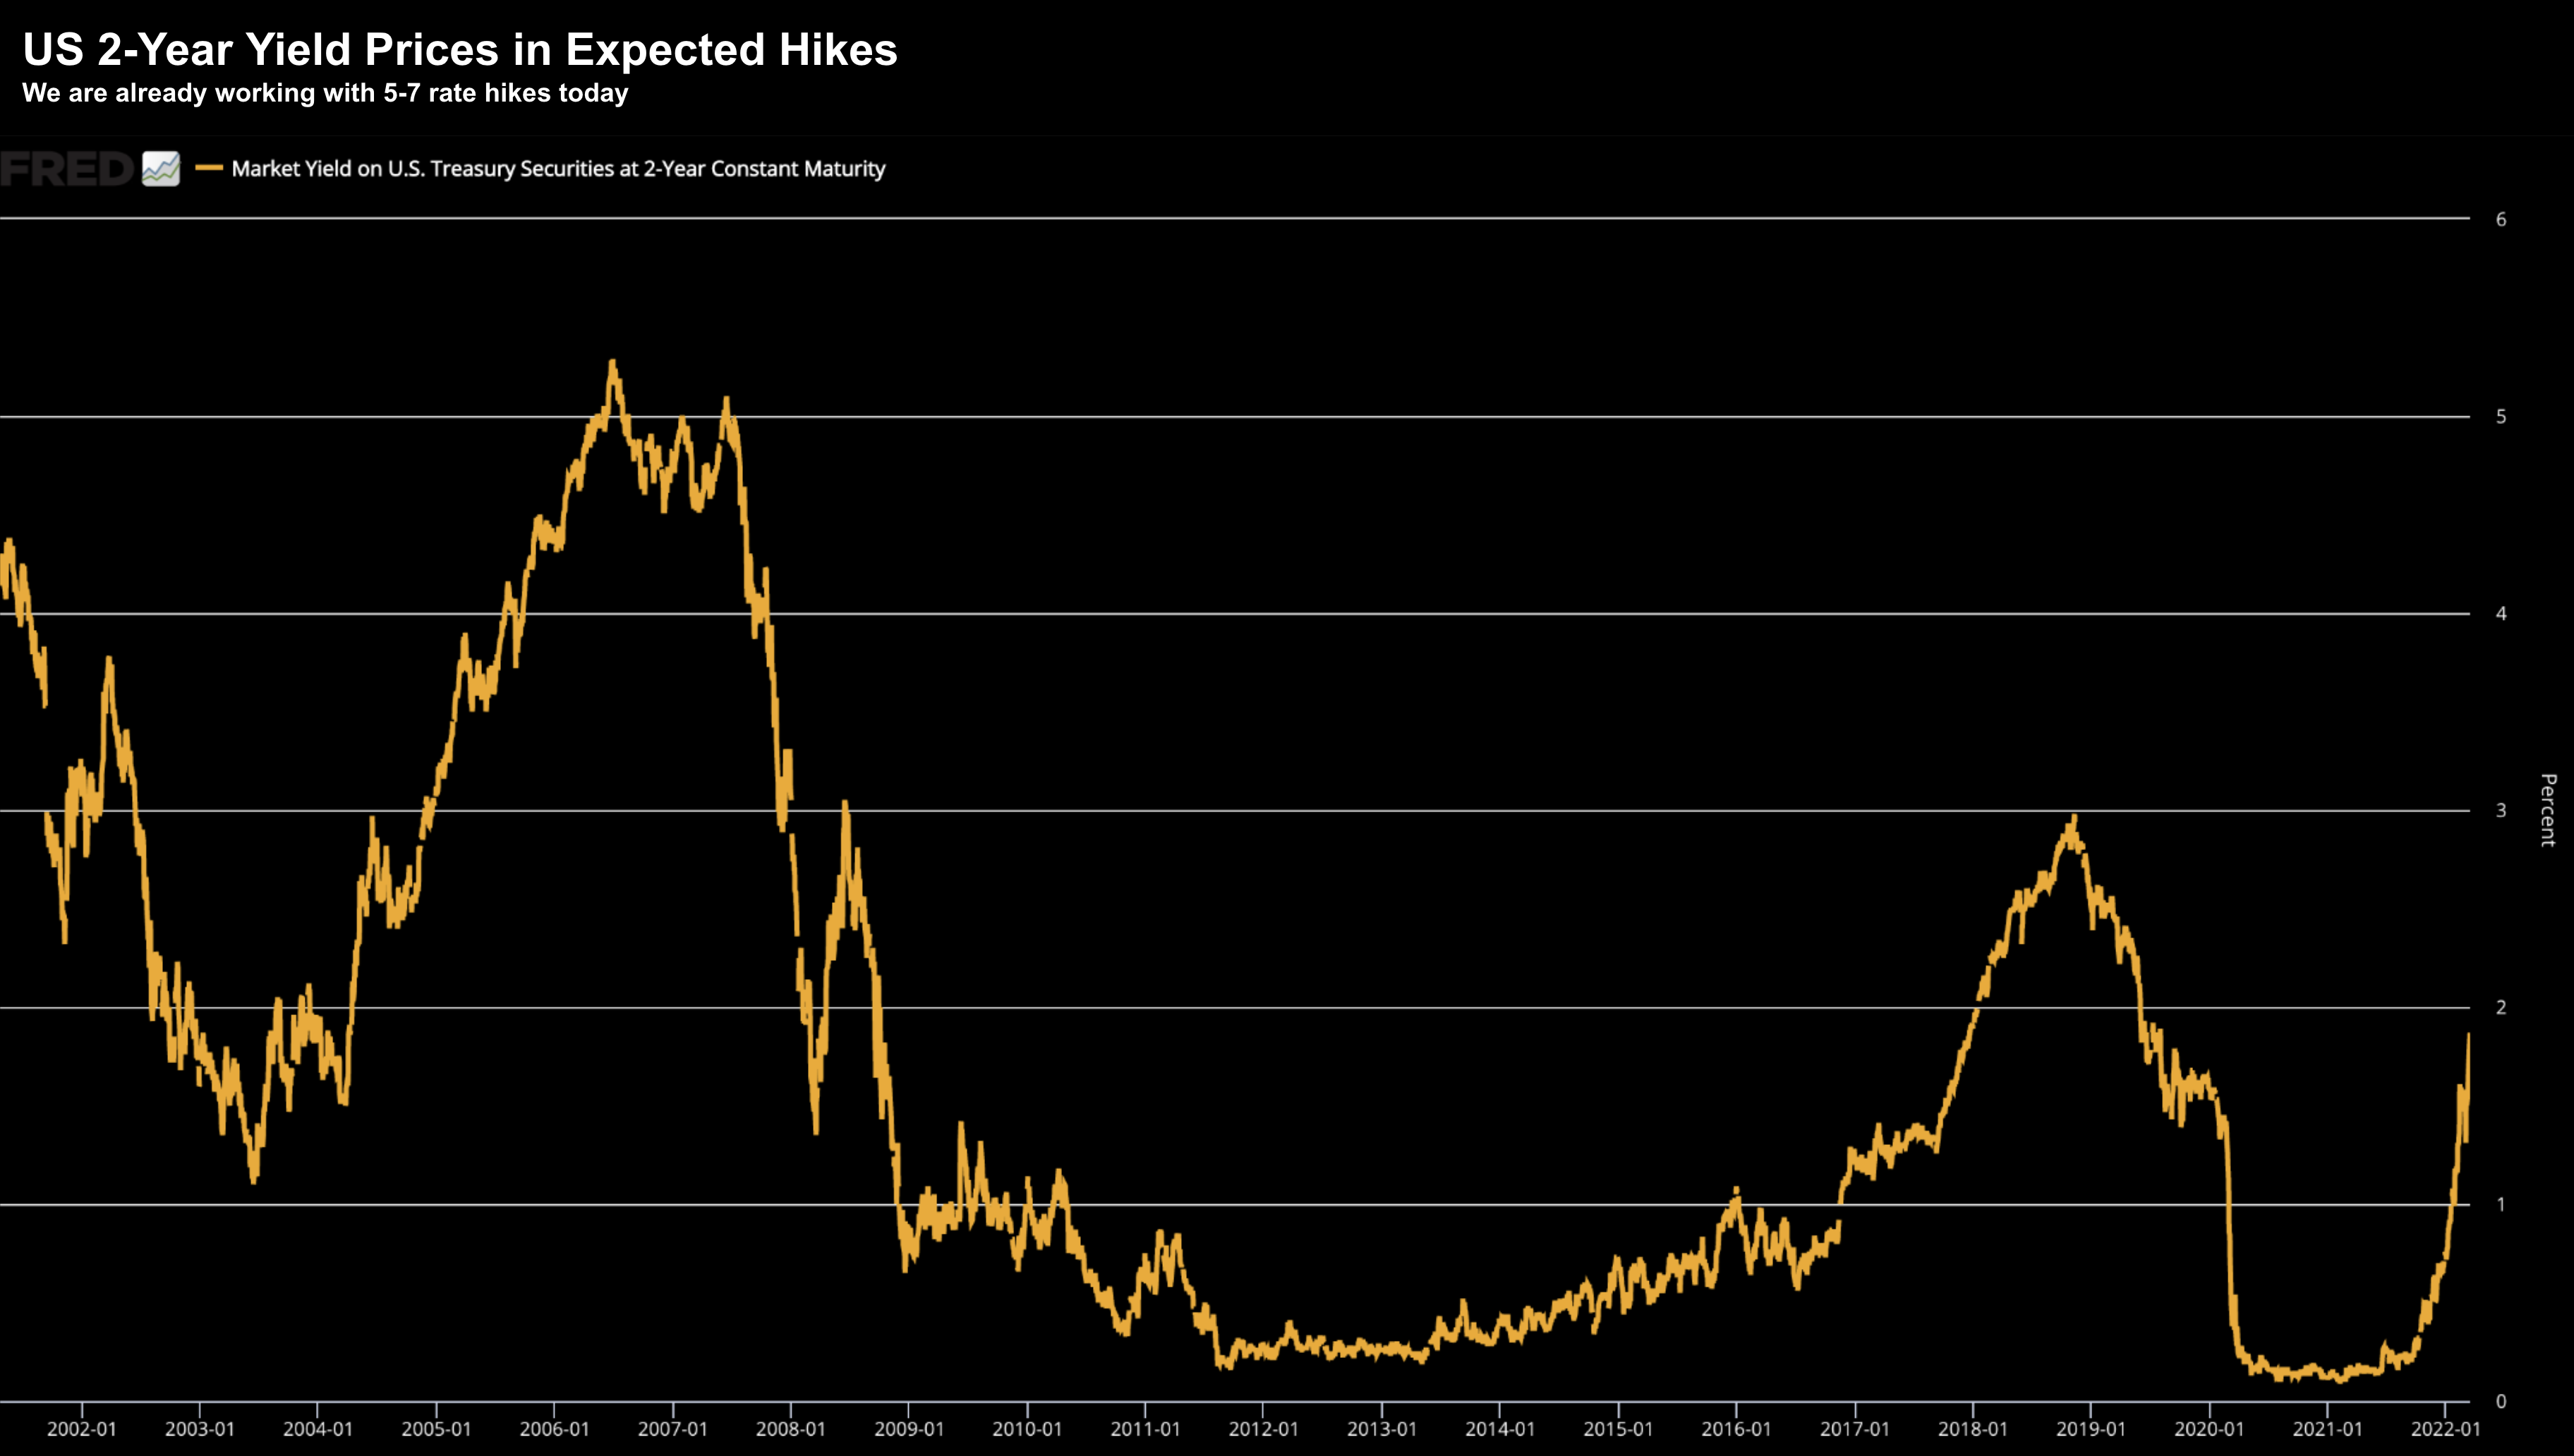
For example, we already see this with the 2-year treasury note
March 15 2022
As aside, if you"re doing business today or taking out a loan – you"re paying much higher rates than say 4 months ago.
And yet – the Fed have not yet raised rates.
Why?
Because the market is already doing that work.
2-year yields are trading at 1.87%… vs just 0.20% in September of last year.
That"s how far we have come…
Powell"s hawkish pivot was around November last year…. at that point these yields went straight up.
But it"s not just bonds…
Equities have also adjusted.
For example, look at what we"ve seen with hyper-growth / low-to-no earnings companies.
They have been crushed… a scene not unlike the dot.com bust of 2000.
Many of these names are down as much as 60% to 70% from their highs.
And they deserve to be!
We saw a huge rotation out of rampant speculative names (that don"t produce cash) into value names.
Names with strong cash flows, reliable earnings, dividends and fortress like balance sheets.
That was equities pricing in as many as 7 rate hikes the next 12 months.
This is all part of the market adjusting to the Fed well in advance.
And it"s exactly what Powell intended.
Powell takes pride in his clear communication. And it"s something he does well..
His goal is always not to panic markets (or blindside them).
In anything, I think he goes to pains to communicate exactly how the Fed are thinking and what they may do.
As a result, markets are not going into tomorrow "stone old".
They are going in very warm… expecting a hawkish Fed.
But will they get it?
We may not.
For example, "full hawk" may have been November last year?
There"s every chance that the war in Ukraine (and impact on slowing global growth) has given the Fed a bit more room to pull back on their aggressive stance?
I hope they don"t…. but we don"t know.
Could we see a Near-Term Bottom?
Readers have often heard me say it"s a fool"s errand to try and time bottoms.
Good luck!
When I look at the weekly chart below for the S&P 500 – I think we might be getting very close (i.e. within weeks) of forming a near-term low.
That said, now that I have put that out there, watch the market make a fool of me!
March 15 2022
Regular readers will be extremely familiar with this chart…
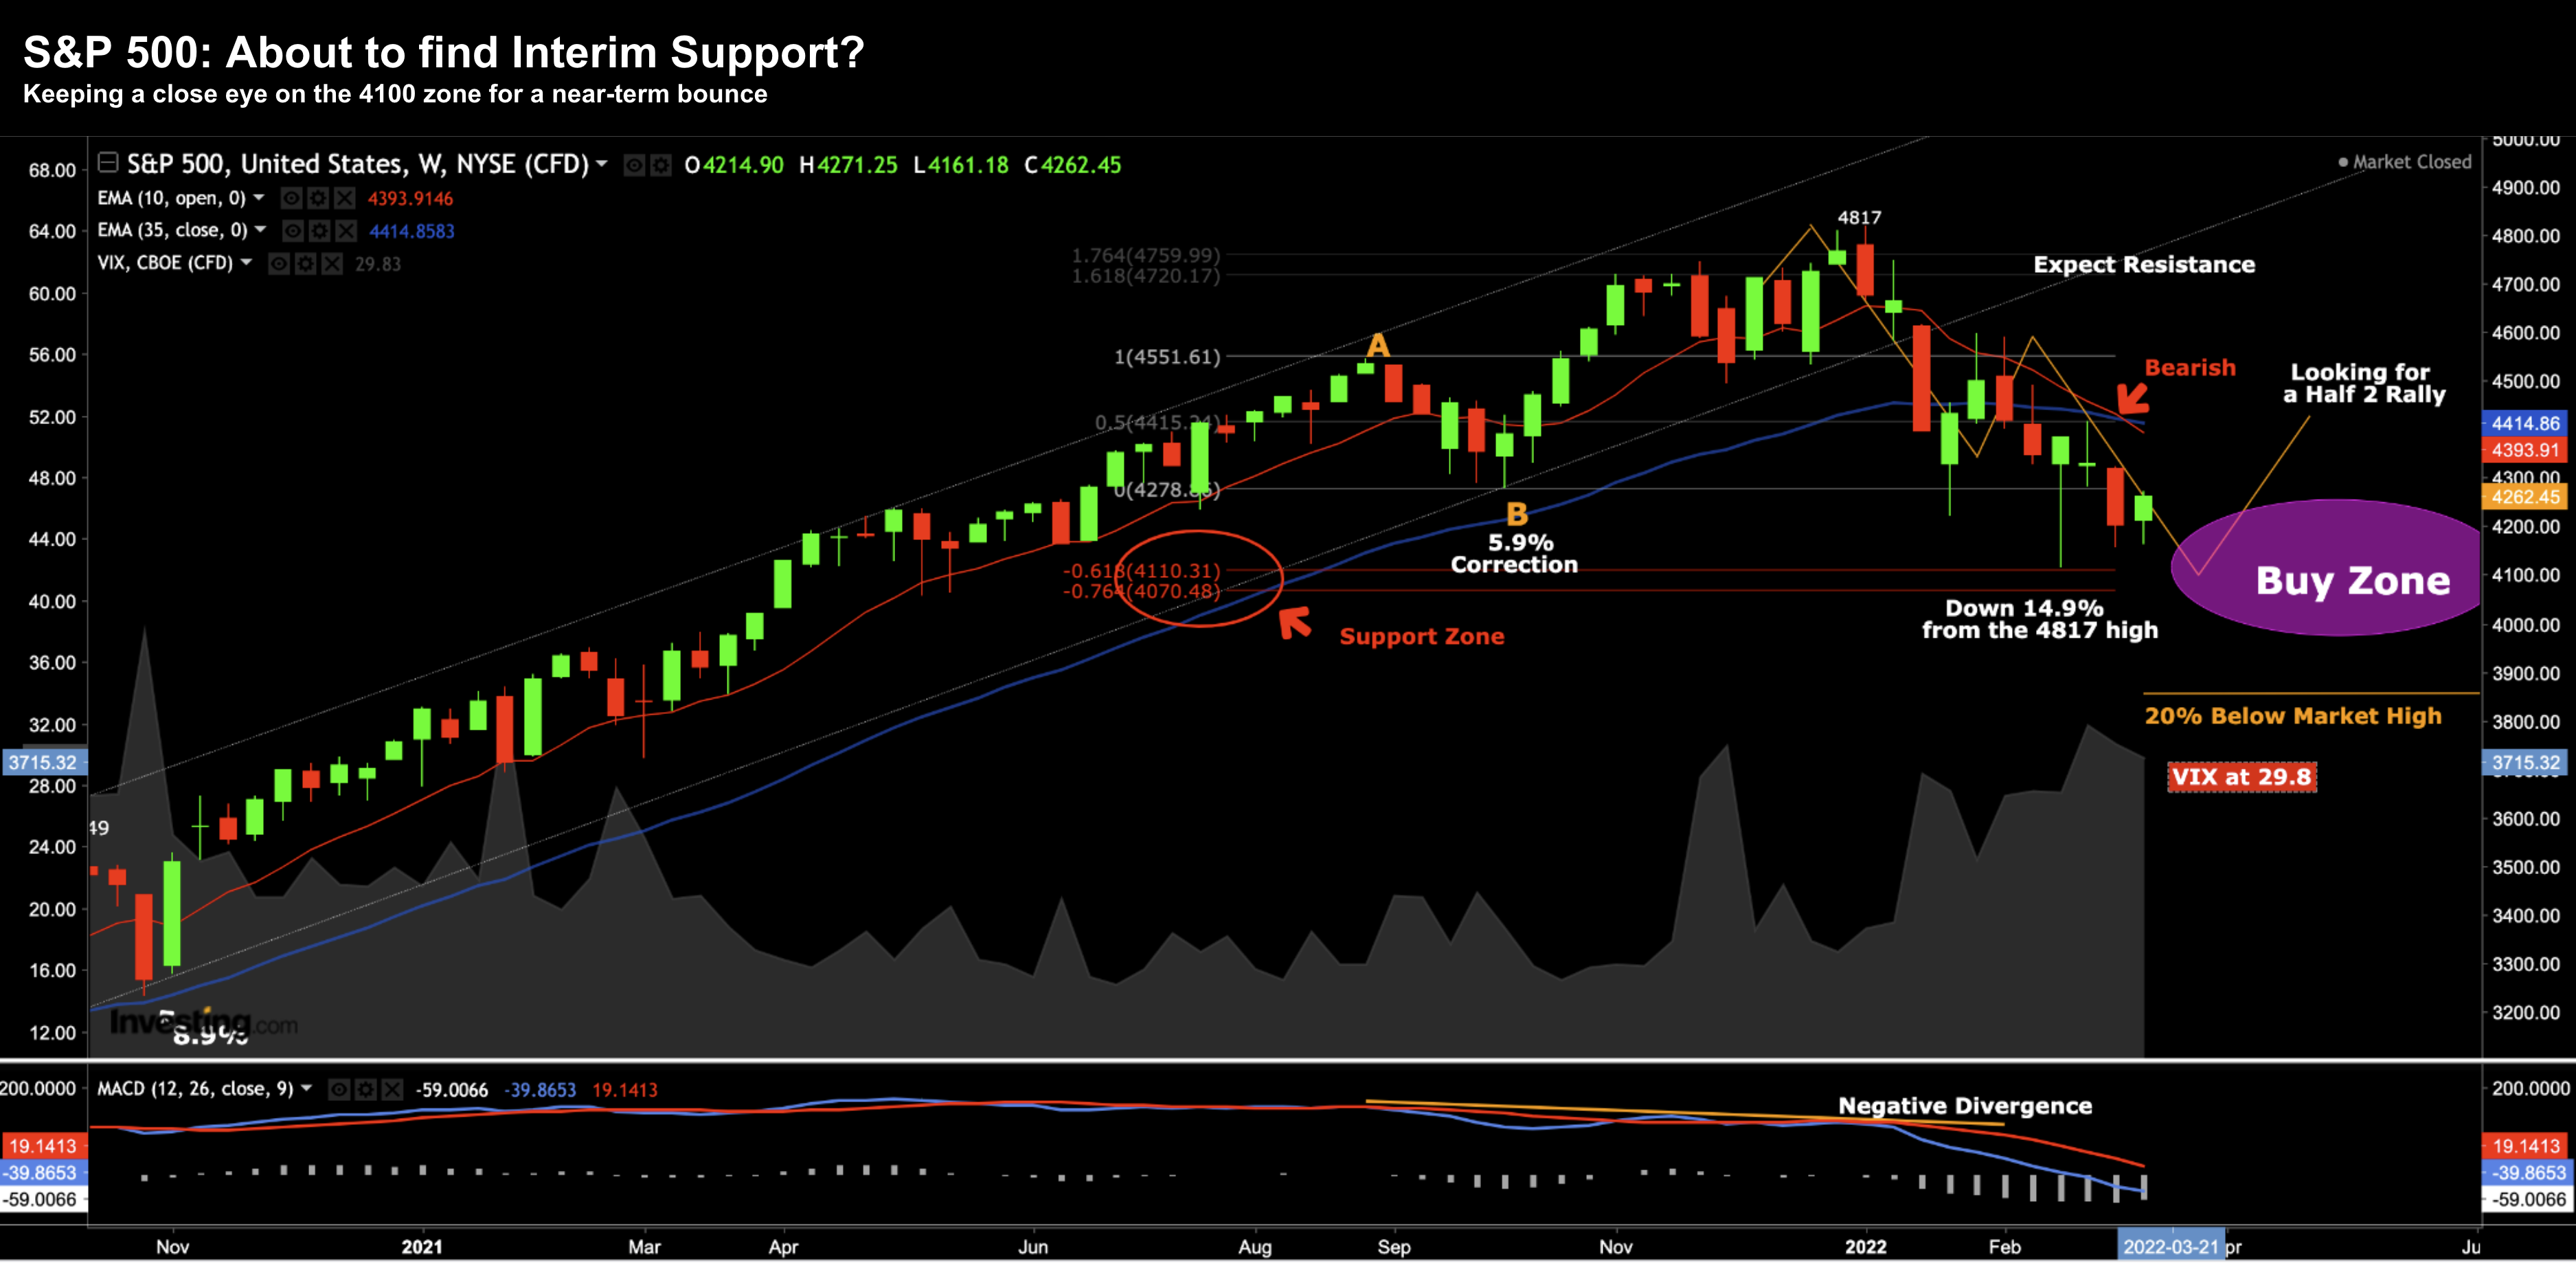
However, today I want to reiterate two important levels which may have gone unnoticed.
Circled in red are the 61.8% and 76.4% Fibonacci retracement zones outside the pullback labeled A-B
These levels are approx 4070 and 4110.
For my analysis (as I work with zones versus specific levels) – call it between 4,000 and 4,100
Based on the behavior I"ve seen over the past few weeks – I feel this is an extremely important zone for the market – and where we are likely to bounce.
For example, the bears have failed numerous times to drive prices below this level; and each time the bulls have stood up.
This week has been another example.
Stocks were under pressure (again) yesterday but today saw another strong wave of buying (led by tech).
But here"s the thing:
Whilst I think we are likely to see some near-term strength – my longer-term view is still bearish.
Why?
Note the change in weekly trend with the all-important 10-week EMA below the 35-week EMA.
This tells me we are more likely to see near-term strength sold.
And whilst I think we could see a rally all the way to around 4400 (i.e. the 35-week EMA) – this is most likely to act as overhead resistance.
What We Need to See
There"s a couple of things I would like to see before I turn more bullish on sustained higher prices.
The first is a close back above the 35-week EMA (blue-line).
That level is almost 4% higher than today"s close.
Second, I would also like to see the weekly-MACD (lower window) turn bullish.
The good news is the histogram (white bars) are showing a bottoming formation. This could be indicative of the tide turning in favor of a near-term reversal.
But it"s still too early to call…
Once we see the downside momentum start to fade… and that indicator starts to pick up… a longer-term turnaround could be in play.
However, as it stands today, my overall disposition remains bearish.
A lot of technical damage has been done the past three months.
And I warned about the risks as we closed quarter four… here"s my language from a post Dec 20:
The S&P 500 dropped ~3% over the past three days – marking the worst decline over a three-day span since September. I feel we are working through the early stages of a decent (buyable) correction.
Well we got it…
That said, I think it"s possible we see a near-term rally towards the 35-week EMA.
However, what we see the market do at ~4400 will be its litmus test.
Putting it all Together
I will often say that nothing rises or falls in a straight line.
And so far, the move to the downside in equities has been quite orderly.
There hasn"t been any panic selling… but more like a slow grind lower from January.
And if you look at tech stocks specifically – the sell-off started much earlier in highly speculative names.
With respect to tomorrow – I think equities are going into the Fed"s decision luke warm..
I also don"t think the Fed is going to try and catch the market off-guard.
It"s not Powell"s style.
The market began working with higher rates 5 months ago.
But what they will be looking for is guidance as to what that landscape could look like beyond 6-9 months?
For example, will we get any guidance on balance sheet reduction?
That kind of monetary tightening will have a far bigger bearing on equities versus say 5-7 rate hikes.
Let"s see how we go…