Stocks Rebound… With “Big Tech” Upgraded
- Tech surges ahead after recent sell-off
- Is the pre-Christmas volatility over?
- UBS says Google has ~32% more upside – here"s why
Are the lows in before Christmas?
That"s hard to know.
Stocks have rallied strongly to start the week after last week"s ~5.2% pullback
In particular, it"s been "higher-risk" names leading the rebound… with the Russell 2000 and tech surging.
My quick take is markets are moving past initial Omicron (lockdown) fears.
What"s more, Pfizer announced that three doses of its vaccine are effective at neutralizing the Omicron variant, citing its own preliminary lab tests.
Great news!
However, a healthy degree of uncertainty remains regarding how aggressive the Fed could be next year?
And further to that, is the market fully pricing this in?
I am less convinced.
We will get a sense of this December 14th…. after the Fed digests the latest CPI print this Friday.
It"s going to come in "white-hot"… that much we know.
Markets Bounce
At the end of last week I added to a few (quality) names.
These included TSM, SNOW, FB and DIS (names I"ve mentioned on the blog)
And in September (during the ~5% dip) I increased my exposure to AAPL and AMZN.
We will see how things go…
But here"s the thing:
I"m not trying to pick bottoms. I can"t do that (and rarely do).
However, I"m buying (what I think are) quality businesses which are well off their highs.
In some cases, more than 20% off the highs.
AAPL and AMZN look like being nice risk/reward entry points ~2.5 months later… but it"s still very early.
I might be wrong.
Let"s check in with the current market bounce for the S&P 500… as the market rips higher.
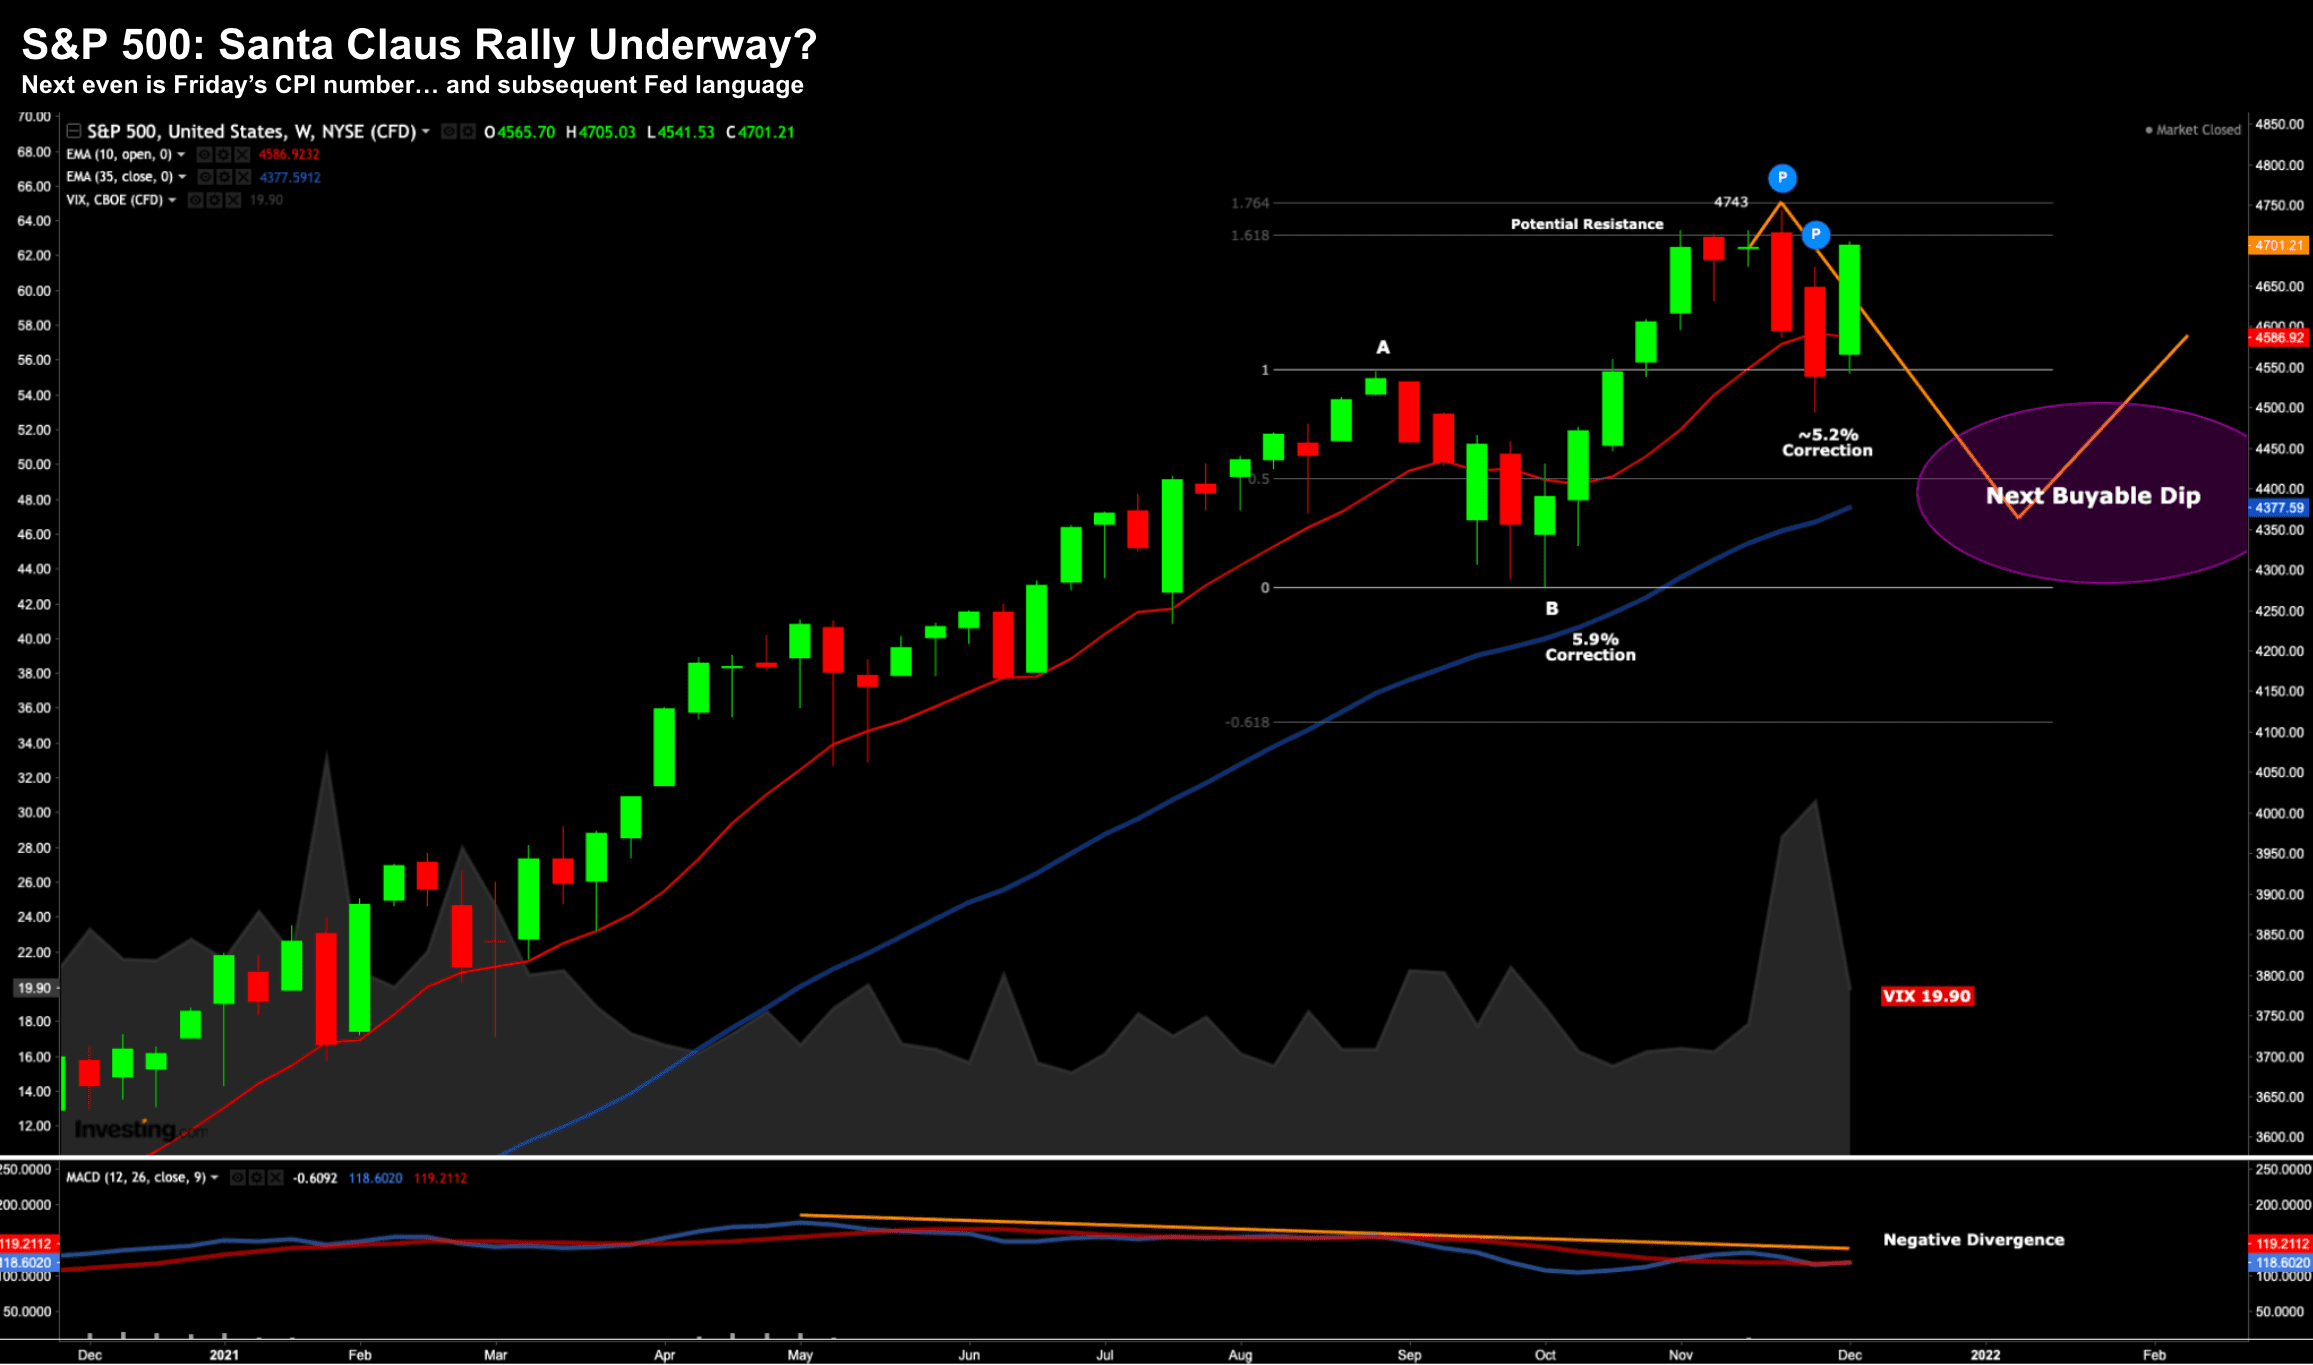
S&P 500 – Dec 7 2021
The current 3-day 4.7% rally is impressive…
However, look at what we see with market breadth… notably small caps and the ETF IWM
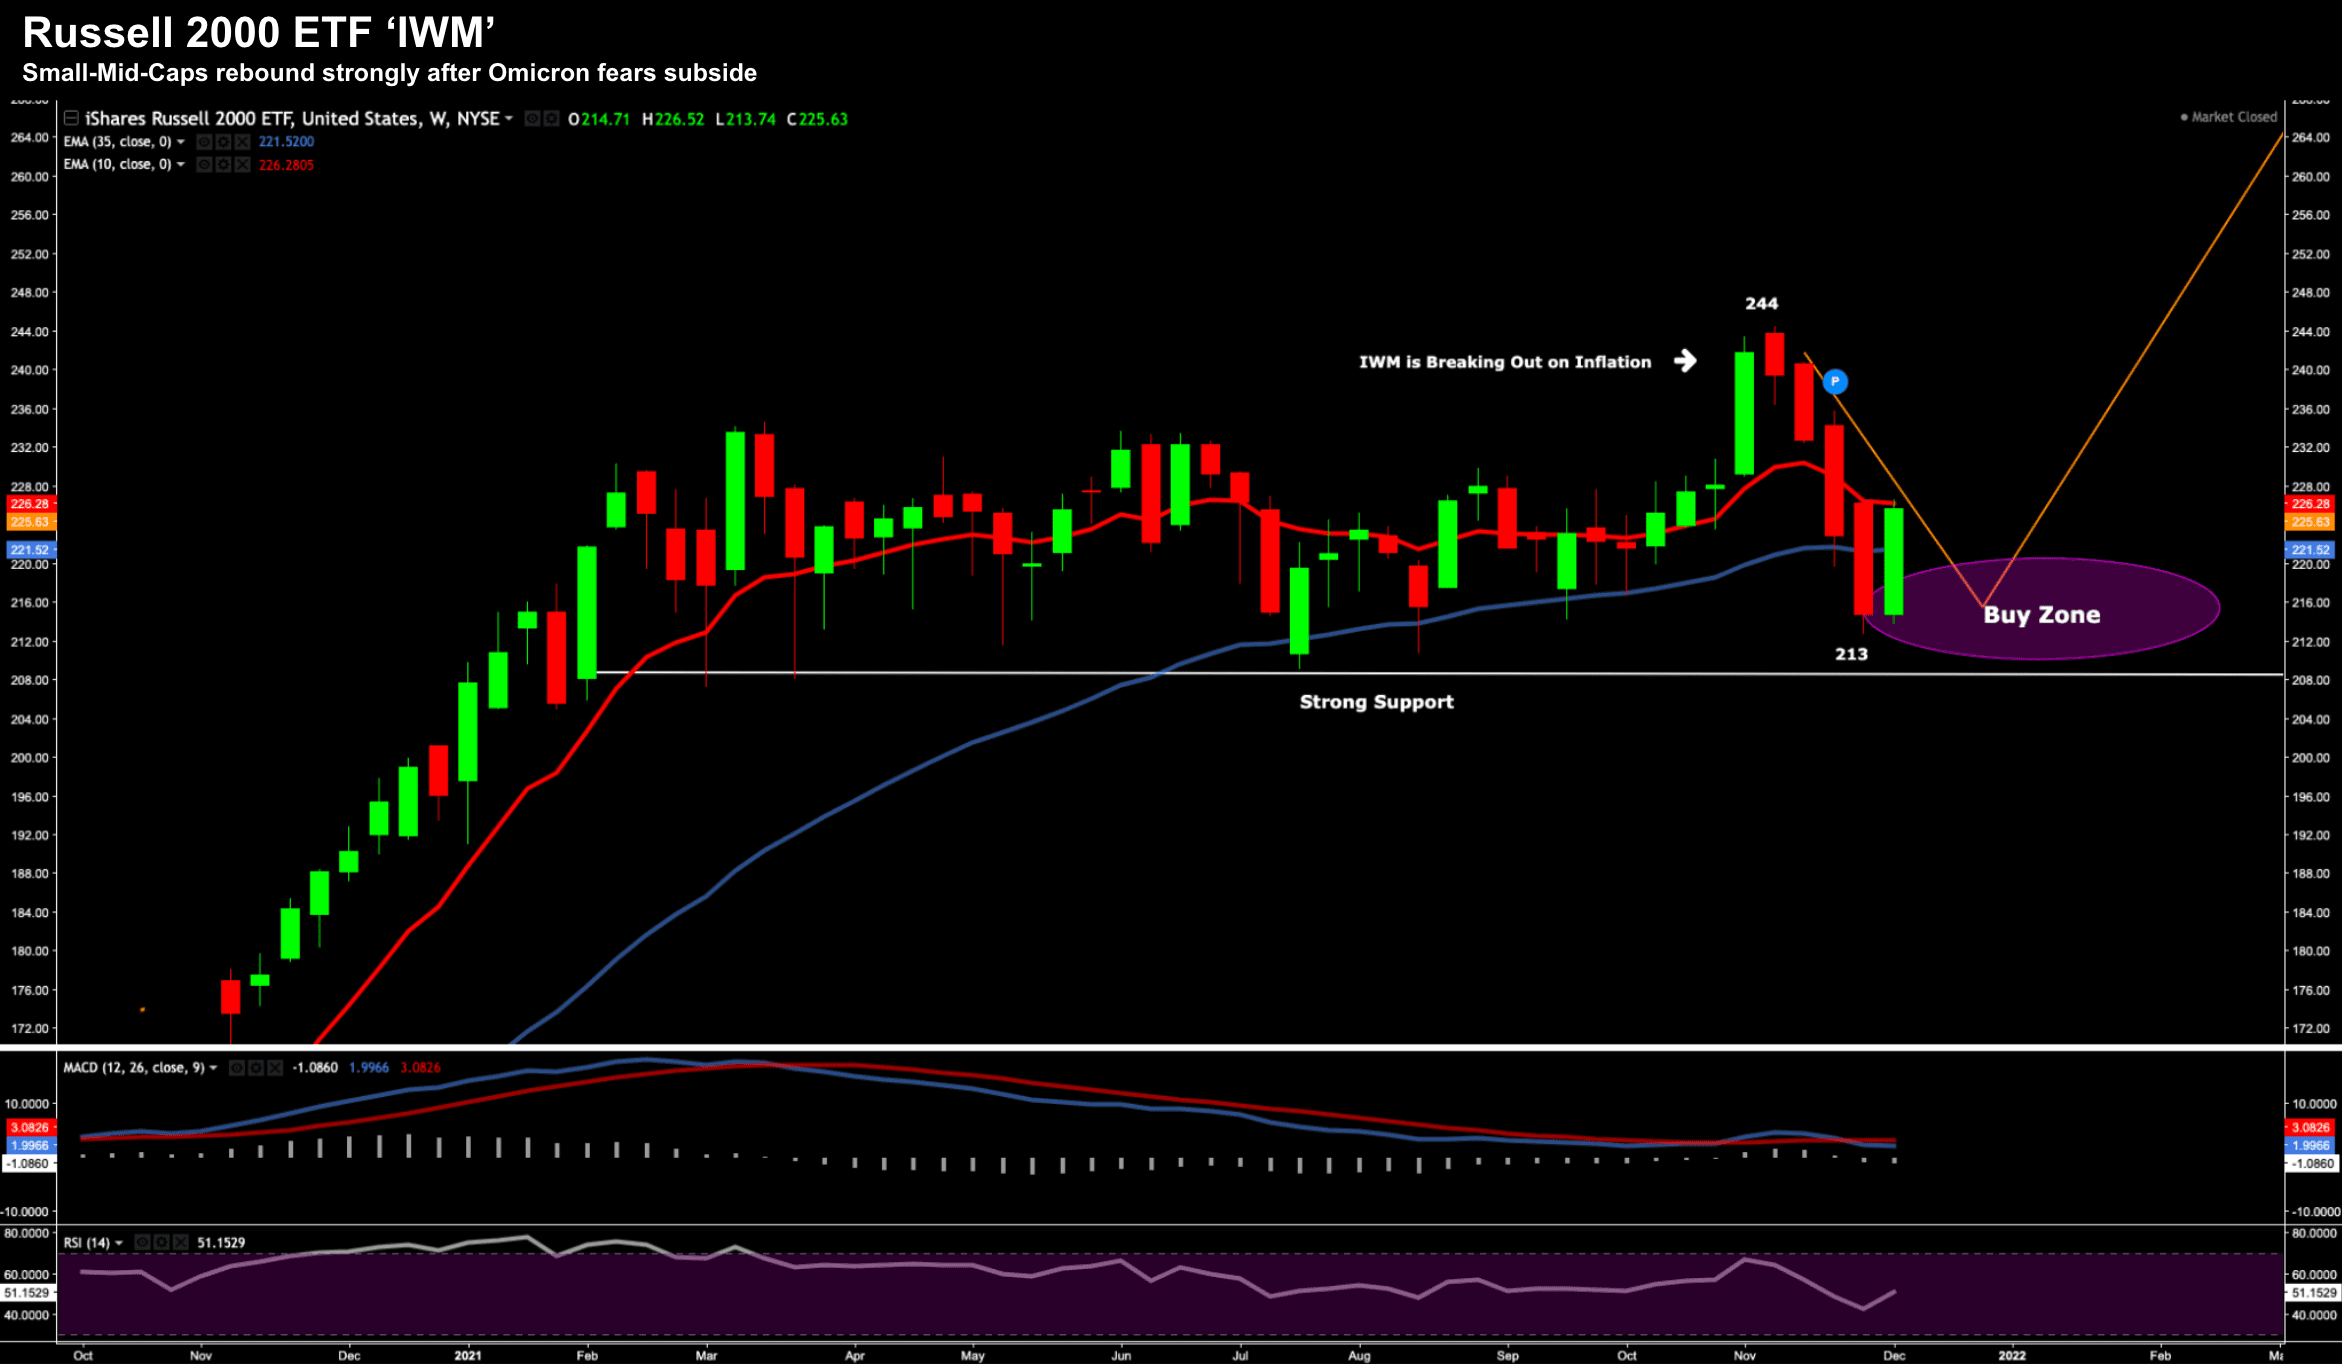
IWM – Dec 7 2021
It was crushed the past 4 weeks after I thought it could be breaking higher.
As regular readers know, I was looking for a move lower with support around the $208 – $220 zone.
It found it.
Things have traded-per-the-script… but we will see if it can continue with a "faster taper" from the Fed.
A more aggressive Fed will mean only quality names continue to do well…. so how does that play out for riskier small cap names?
First, let"s revisit big tech… as some notable names are being upgraded.
Big-Cap Tech Upgraded
As stocks found their footing this week – the "FMAGA" complex led the charge.
Apple made another all-time high – pushing $175 per share as I write.
I added to this name around $138 in Sept – believing it traded at an ~20% discount (more on how I arrived at this number shortly)
Over the past week or so, I"ve seen notable analyst upgrades given to Google and Apple.
In full disclosure, Google is my largest portfolio position (~17% at the time of writing) and it"s also where I work.
Now UBS just upgraded its price target for Google to $3,925 from $2,974 today.
That"s almost 32% higher.
But it wasn"t only UBS…
Widely followed hedge-fund manager Dan Niles (dubbed the "Michael Jordan" of Technical Analysis) said the S&P 500 will decline in 2022, but highlighted a few individual stock picks, including Google and Facebook (a stock I added to last week due to its very cheap valuation)
With respect Google – UBS talk to "significantly more" large cloud deals – which should boost revenue in 2022.
I agree there is meaningful upside in the enterprise cloud space. In fact, I think it"s still "very early innings" for Cloud.
Whilst not the focus of this missive – only ~10-15% of all enterprise IT spend has moved to the Cloud so far.
That"s how much "headroom" remains…
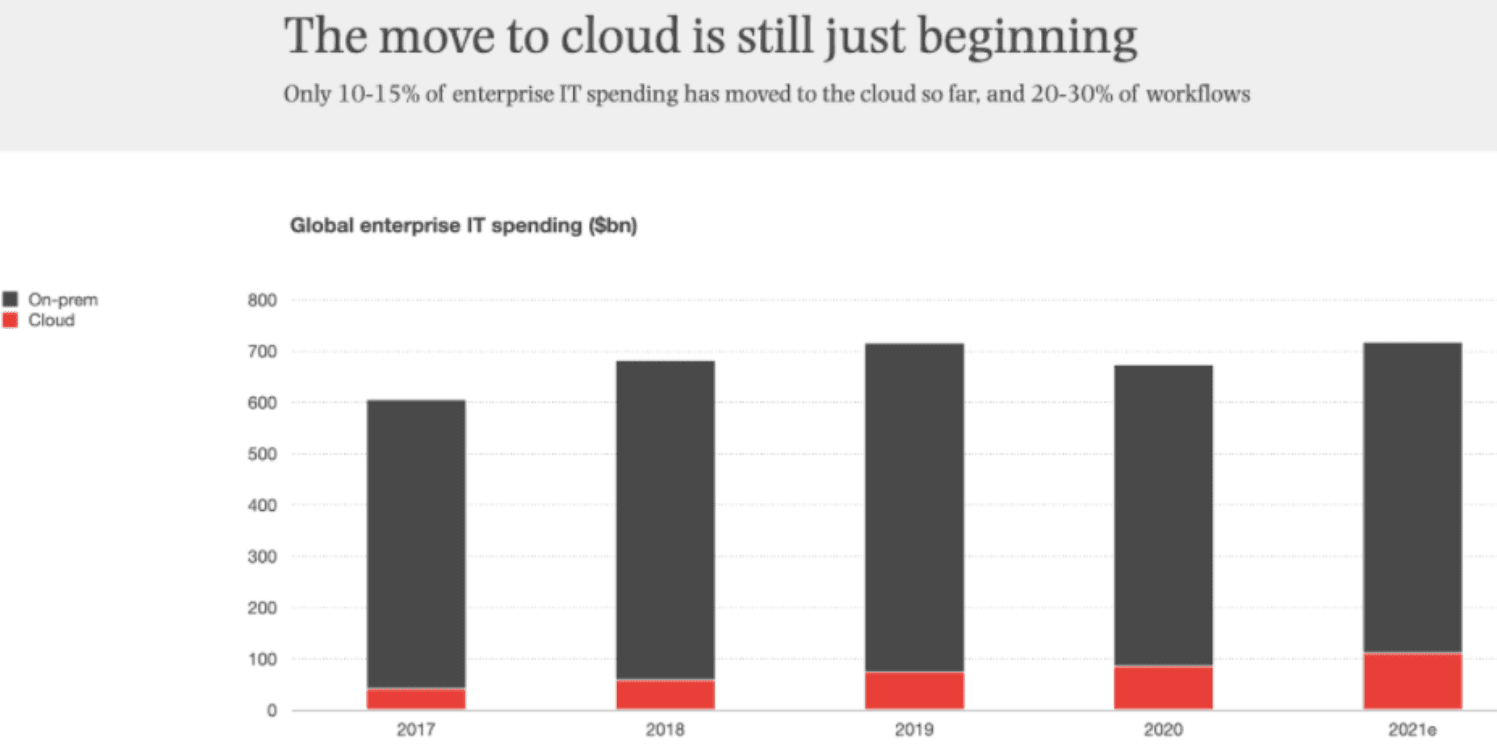
Companies such as Google, Amazon and Microsoft all continue to boast top-line Cloud revenue growth in the realm of 40% y/y.
Snowflake (SNOW) was my other recommendation with respect to enterprise Cloud growth.
But let"s look at FMAGA specifically – do you buy at what are record highs for some of these names?
Is "FMAGA" Worth Buying Here?
Longer-term readers will know my preferred method of valuation is using Discount Cash Flow (DCF).
As a preface, there numerous methods to "value" a stock and none are perfect.
For example, a "forward PE" ratio is a widely-cited metric.
What you will find is each stock, industry and/or sector has unique characteristics that may require multiple valuation methods.
Investopedia provides a good overview of the most widely used methods.
With respect to DCF – below is a recap:
Instead of looking at dividends, the DCF model uses a firm"s discounted future cash flows to value the business.
The big advantage of this approach is that it can be used with a wide variety of firms that don"t pay dividends, and even for companies that do pay dividends
The DCF model has several variations, but the most commonly used form is the Two-Stage DCF model.
In this variation, the free cash flows are generally forecasted for 5 to 10 years, and then a terminal value is calculated to account for all the cash flows beyond the forecasted period.
The first requirement for using this model is for the company to have positive and predictable free cash flows.
Based on this requirement alone, you will find that many small high-growth companies and non-mature firms will be excluded due to the large capital expenditures these companies typically encounter.
To be clear, DCF doesn"t pretend to be a panacea – but is useful for those companies that have positive and largely predictable free cash flows (i.e. FMAGA).
As an aside, billionaire investor Bill Ackman says in this video about why FCF is the only fundamental metric you need to know.
And here"s a short 3-min clip where Buffett describes the best way to value a company.
Google"s DCF Valuation
Let me start with Google…
Today GOOG trades for $2,974 per share at the time of writing – up 69% so far this year.
This places Google at a market cap of some $1.89 Trillion
GOOG has been the outstanding mega-cap tech stock over 2021 – and arguably still trades at a reasonable valuation (which I will explain)
For those less familiar, a stock"s market cap approximates what investors expect each company to earn over its entire future corporate life, discounted at a high enough rate to compensate for the risk of holding the stock.
Now an "entire life" could be 100+ years (in theory) – but I would recommend using a time horizon of at least 10 years (also what Buffett uses).
First up, last year to Sept 2021, Google had free cash flow of $65.7B
That"s where we begin…
The question is how much do we think that will grow (and what discount rate we apply)?
Taking a purely impartial view – analysts believe the growth rate for Google will be 21% for the next 5 years.
You may think it"s higher or lower – based on what information (or informed views) you have.
For the subsequent 5 years (i.e., years 6 to 10) – it"s likely growth will slow. For Google, I have assumed a growth rate of 14%
These two-phased growth rates enable us to calculate future cash flow (FCF) by year.
With respect to Present Value (PV) – this is the current value of a future sum of money given a specified rate of return.
Here I simply discount the FCF for any given year by a discount rate of 10%.
This is the annualized rate of return you expect from holding the stock.
For example, I use at least 10% as I know that over ~10 years… I could hold the broader S&P 500 index and be confident I will average 8-9% (with much lower concentrated risk). This is why we need to discount these cash flows.
From there, we add up the PV of all future earnings (see far-right column below) and you have an approximation of "fair value".
The final element is we add the terminal value.
This is what we would want to sell the stock for. Typically higher quality businesses (like Google) will attract a multiple of at least 15x. A lower quality business might be say 10x.
Put that all together – and it looks like this (with GOOG at $2,975 per share):
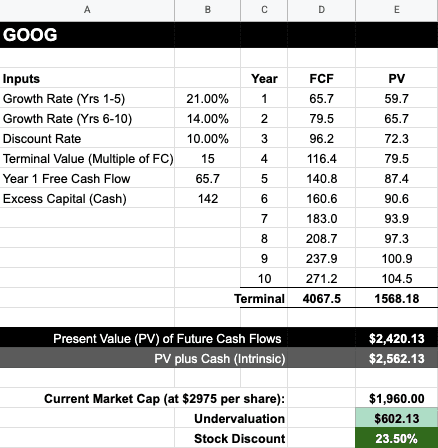
Based on the growth (and discount) rate assumptions over 10 years – Google Present Value plus Cash on Hand ($142B) is ~$2.56 Trillion.
However, we find its current market cap is $1.96 Trillion.
Therefore, it"s possible to suggest that Google currently trades at close to a 24% discount.
As such, when I read a price upgrade from UBS for 32% upside (based on cash flow) – I can understand.
One more thing:
In the event we see a more aggressive Fed taper and/or rate hikes in 2022 – Google is the type of stock which is likely to attract capital.
I say that because of its exceptionally strong revenue growth, profit margins, free cash flow and balance sheet (i.e. $142B in cash)
What"s more, the forward PE is only 26x… lower than similar names trading at lower growth rates / certainty of earnings.
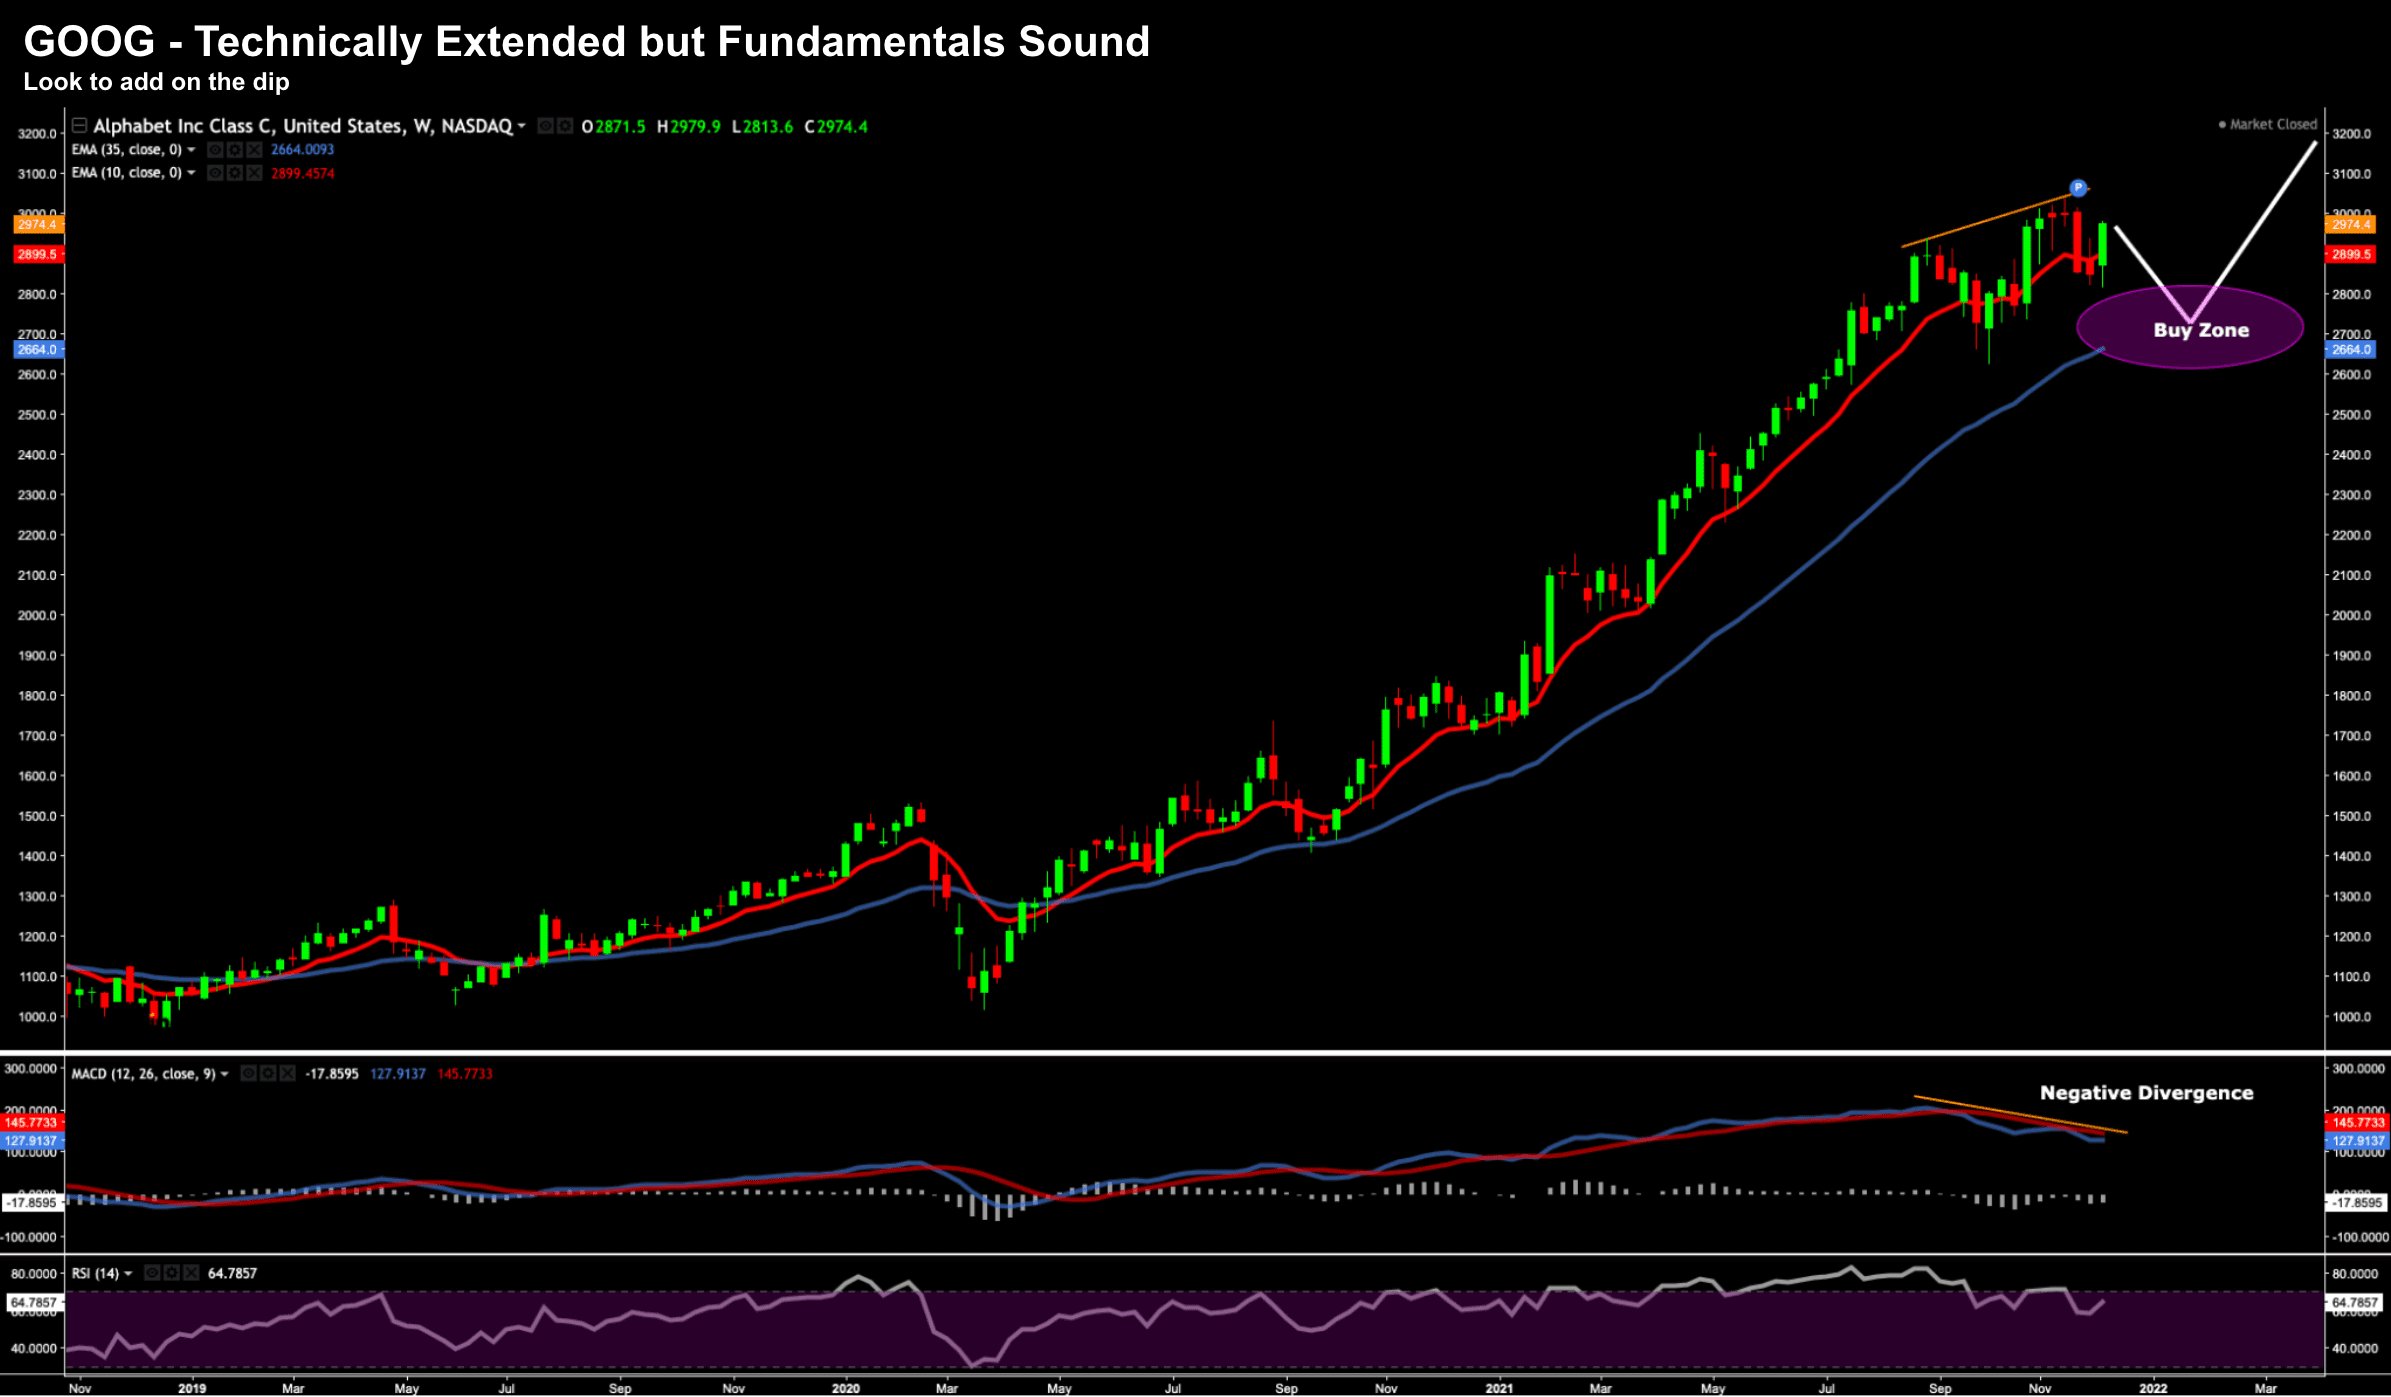
Dec 7 2021
Add this one to your list of quality stocks to own / add to.
Apple"s DCF Valuation
Again, if we see market anxiety around the "aggressiveness" of Fed tightening (to tame unwanted inflation) — Apple is likely to weather any market storm.
We saw that last week.
The market fell 5% however Apple made ground.
Apple received a price target upgrade from Morgan Stanley this week to $200.
But is that value?
I will apply the same DCF model with the following assumptions:
- Year 1 to 5 Growth Rate: 15.4%
- Year 6 to 10 Growth Rate: 10% (my assumption)
- Discount Rate: 10% (my preference)
- Terminal Value: 15x (as it"s a quality business)
- Year 1 Free Cash Flow: $92.9B
- Cash on Hand: $62.6B
When it comes to Apple, it"s current market cap is $2.71 Trillion (at ~$175 per share)
However, it trades at a forward PE of closer to 30x (almost 5x more expensive than Google; and 8x more expensive than FB)
But let"s take a look at the DCF analysis…
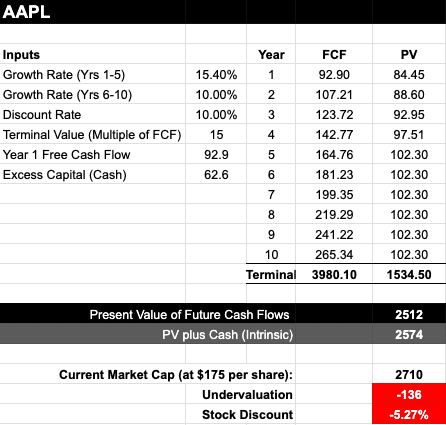
My view is Apple is trading slightly above fair value (5.27%) at ~$175 per share.
However, here"s the thing with assumptions:
If you change the 1-5 year growth rate assumption to 20%… it"s total Intrinsic Value is closer to $3 Trillion (8.5% higher than today)
Now I added to the stock around $138; i.e., 27% cheaper than today.
At this price – I felt there was a reasonable discount (e.g., based on its free cash flow).
What"s more, the price was testing its 35-week EMA zone which is often an area of support.
Dec 7 2021
I think you can be patient despite the $200 price target from Morgan Stanley.
I do think Apple will get to $200… but it won"t be in a straight line (it never is!)
Apple has rocketed higher… despite a market pullback… which has continued this week.
It"s hard to know if we will see anything around the $140 zone anytime soon… but I think you will get it cheaper than $175.
Putting it All Together…
Determining whether a company is over (or under) valued is not a precise science.
There are all kinds of moving parts… and plenty of assumptions.
What"s more… the environment continually changes (e.g. look at what we saw with supply chain impacting growth rates)
In that sense, you could say it"s more "art" than "science".
The objective is to get you in the ballpark.
No-one get this stuff exactly right. It"s not meant to.
This is why I balance fundamentals (e.g. cash flow, balance sheet, revenue growth) with the tape (or technicals).
Using fundamentals I create a list of companies which I think are higher quality (e.g. leaning into key things such as revenue growth, customer acquisition growth, free cash flow, profit margins, market share etc)
And from there, I check-in with the tape.
Take Apple…
The weekly chart highlights how it has tested its 35-week EMA zone 6 times since 2019 and found strong support.
And if you think the "business model" for Apple remains intact (n.b., its strong free cash flow and margins suggests this is the case) – these are the zones to buy.
Before I close, I think the market offers one more pullback before the Santa Rally.
And if you managed to add to some quality names on recent weakness… hopefully you are in good shape for the long-term.