Is this Near-Term Rally the ‘Real Deal’?
- Parallels to October 2007
- Expect a late 2023 recession combined with high inflation
- Market can rally in the near-term – longer-term feels less certain
This market has a "2007 feeling" about it…
October 2007 to be precise.
Approx. 15 years ago, markets were setting new record highs (up ~50% over 3 years) however the bond market was telling us something else.
This is what we saw with S&P 500 in the lead up to 2008:
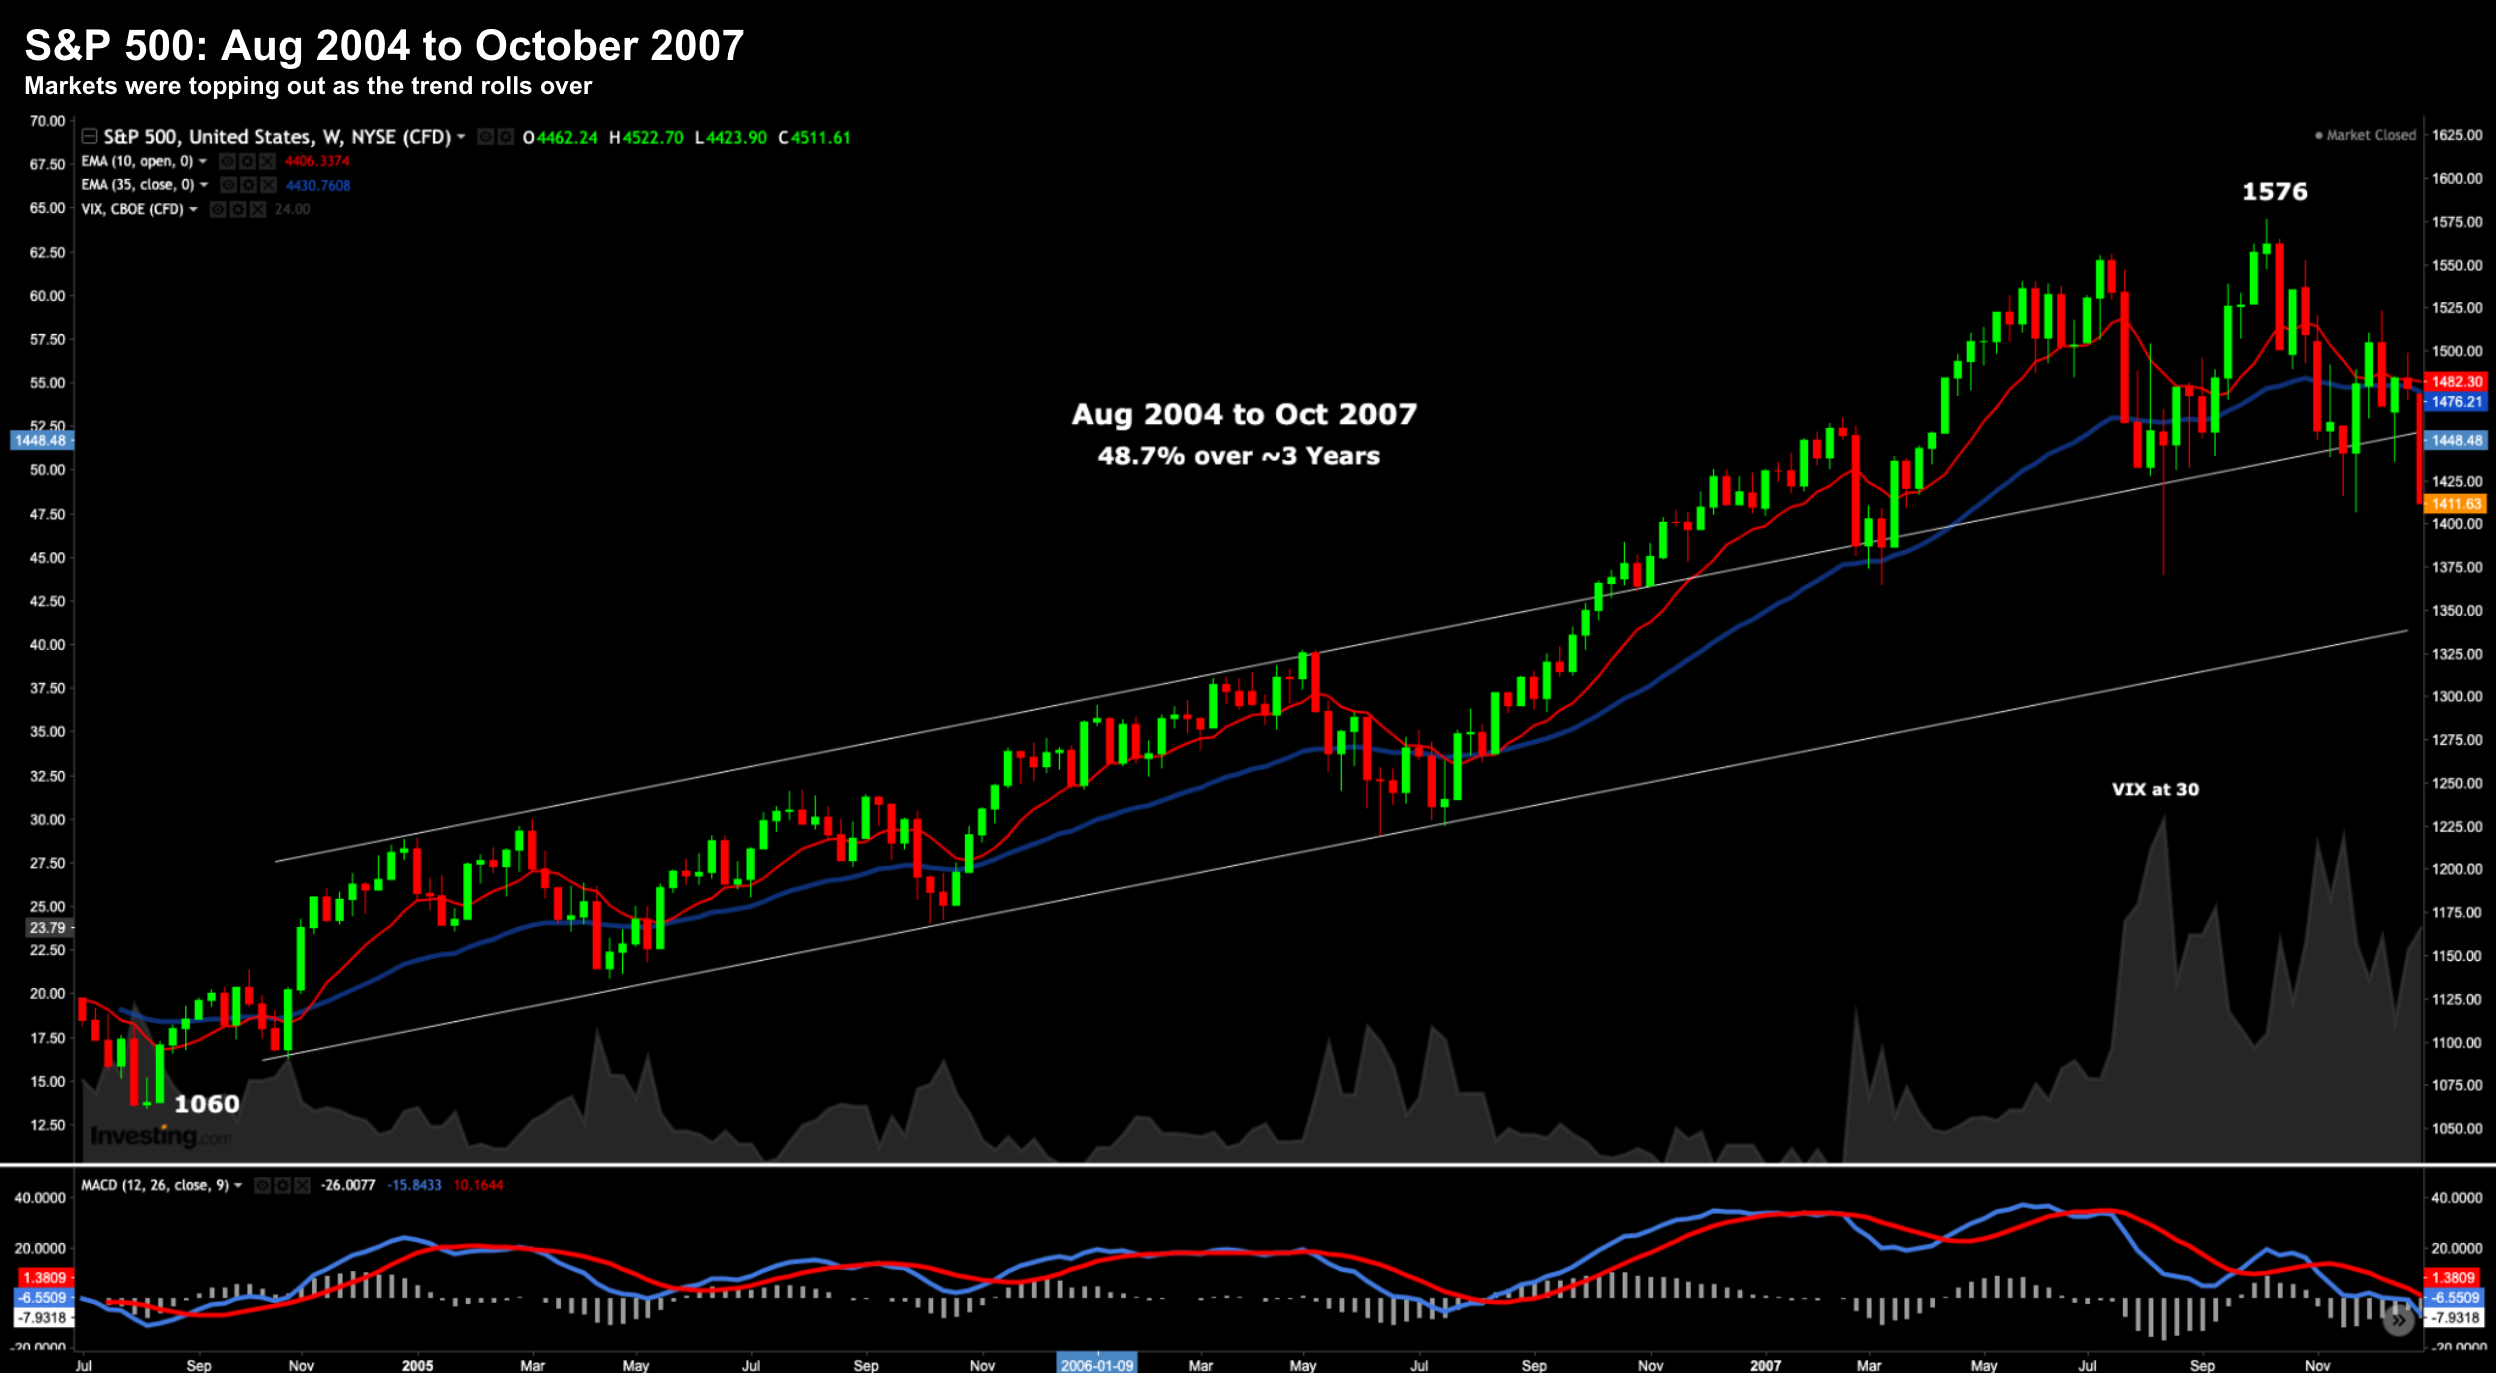
The market peaked in October 2007 at 1576
Confidence was high and the economy was expanding.
However, the bond market was not onboard. They didn"t agree with the optimistic outlook..
For example, the all-important 10/2 yield curve turned negative in Feb 2006 (below in green) – as the Fed hiked rates some 300 basis points (causing the yield curve inversion)
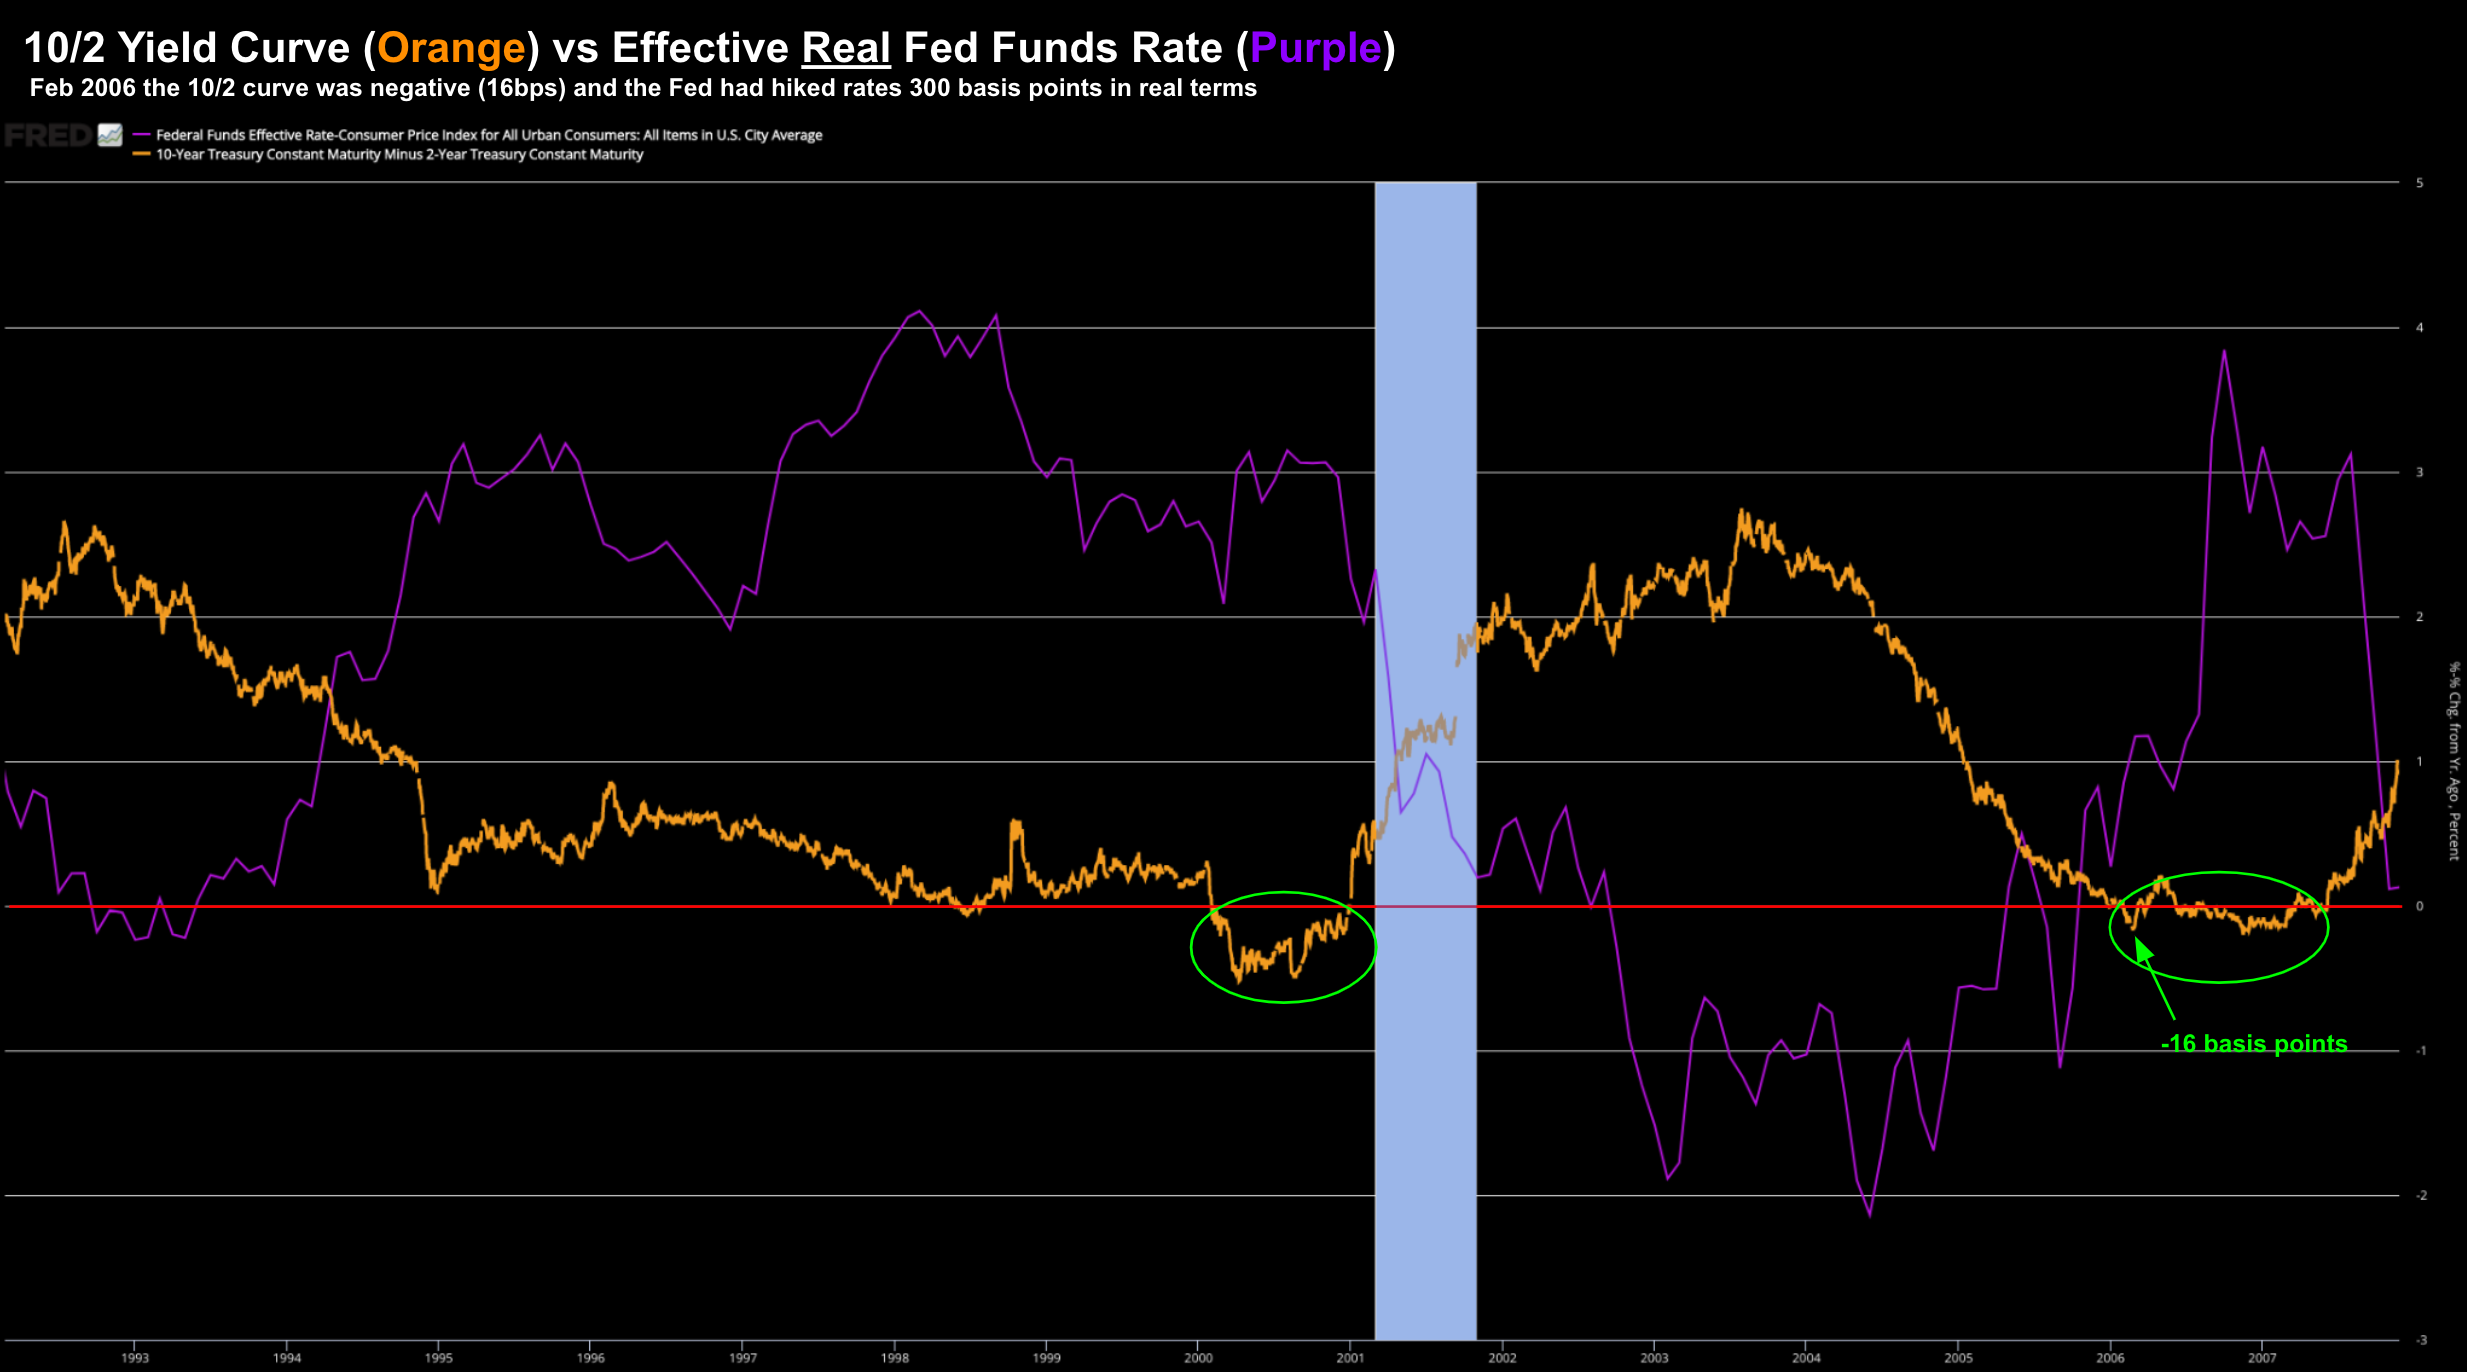
1993 to 2008
The Fed would continue hiking rates through October 2006 – with the real Fed funds (adjusted for inflation) trading around 4%
Equities saw the inversion on Feb 06 – but didn"t sell off (not immediately).
Now the market corrected slightly between May and June 2006 – losing ~8%.
But it was brief… and traders bought the dip.
The market surged through to October 2007… as the yield curve remained negative.
However, as soon as the probability of recession strengthened – equities followed bonds (which is always the case).
Here"s what happened with the S&P after October 2007:
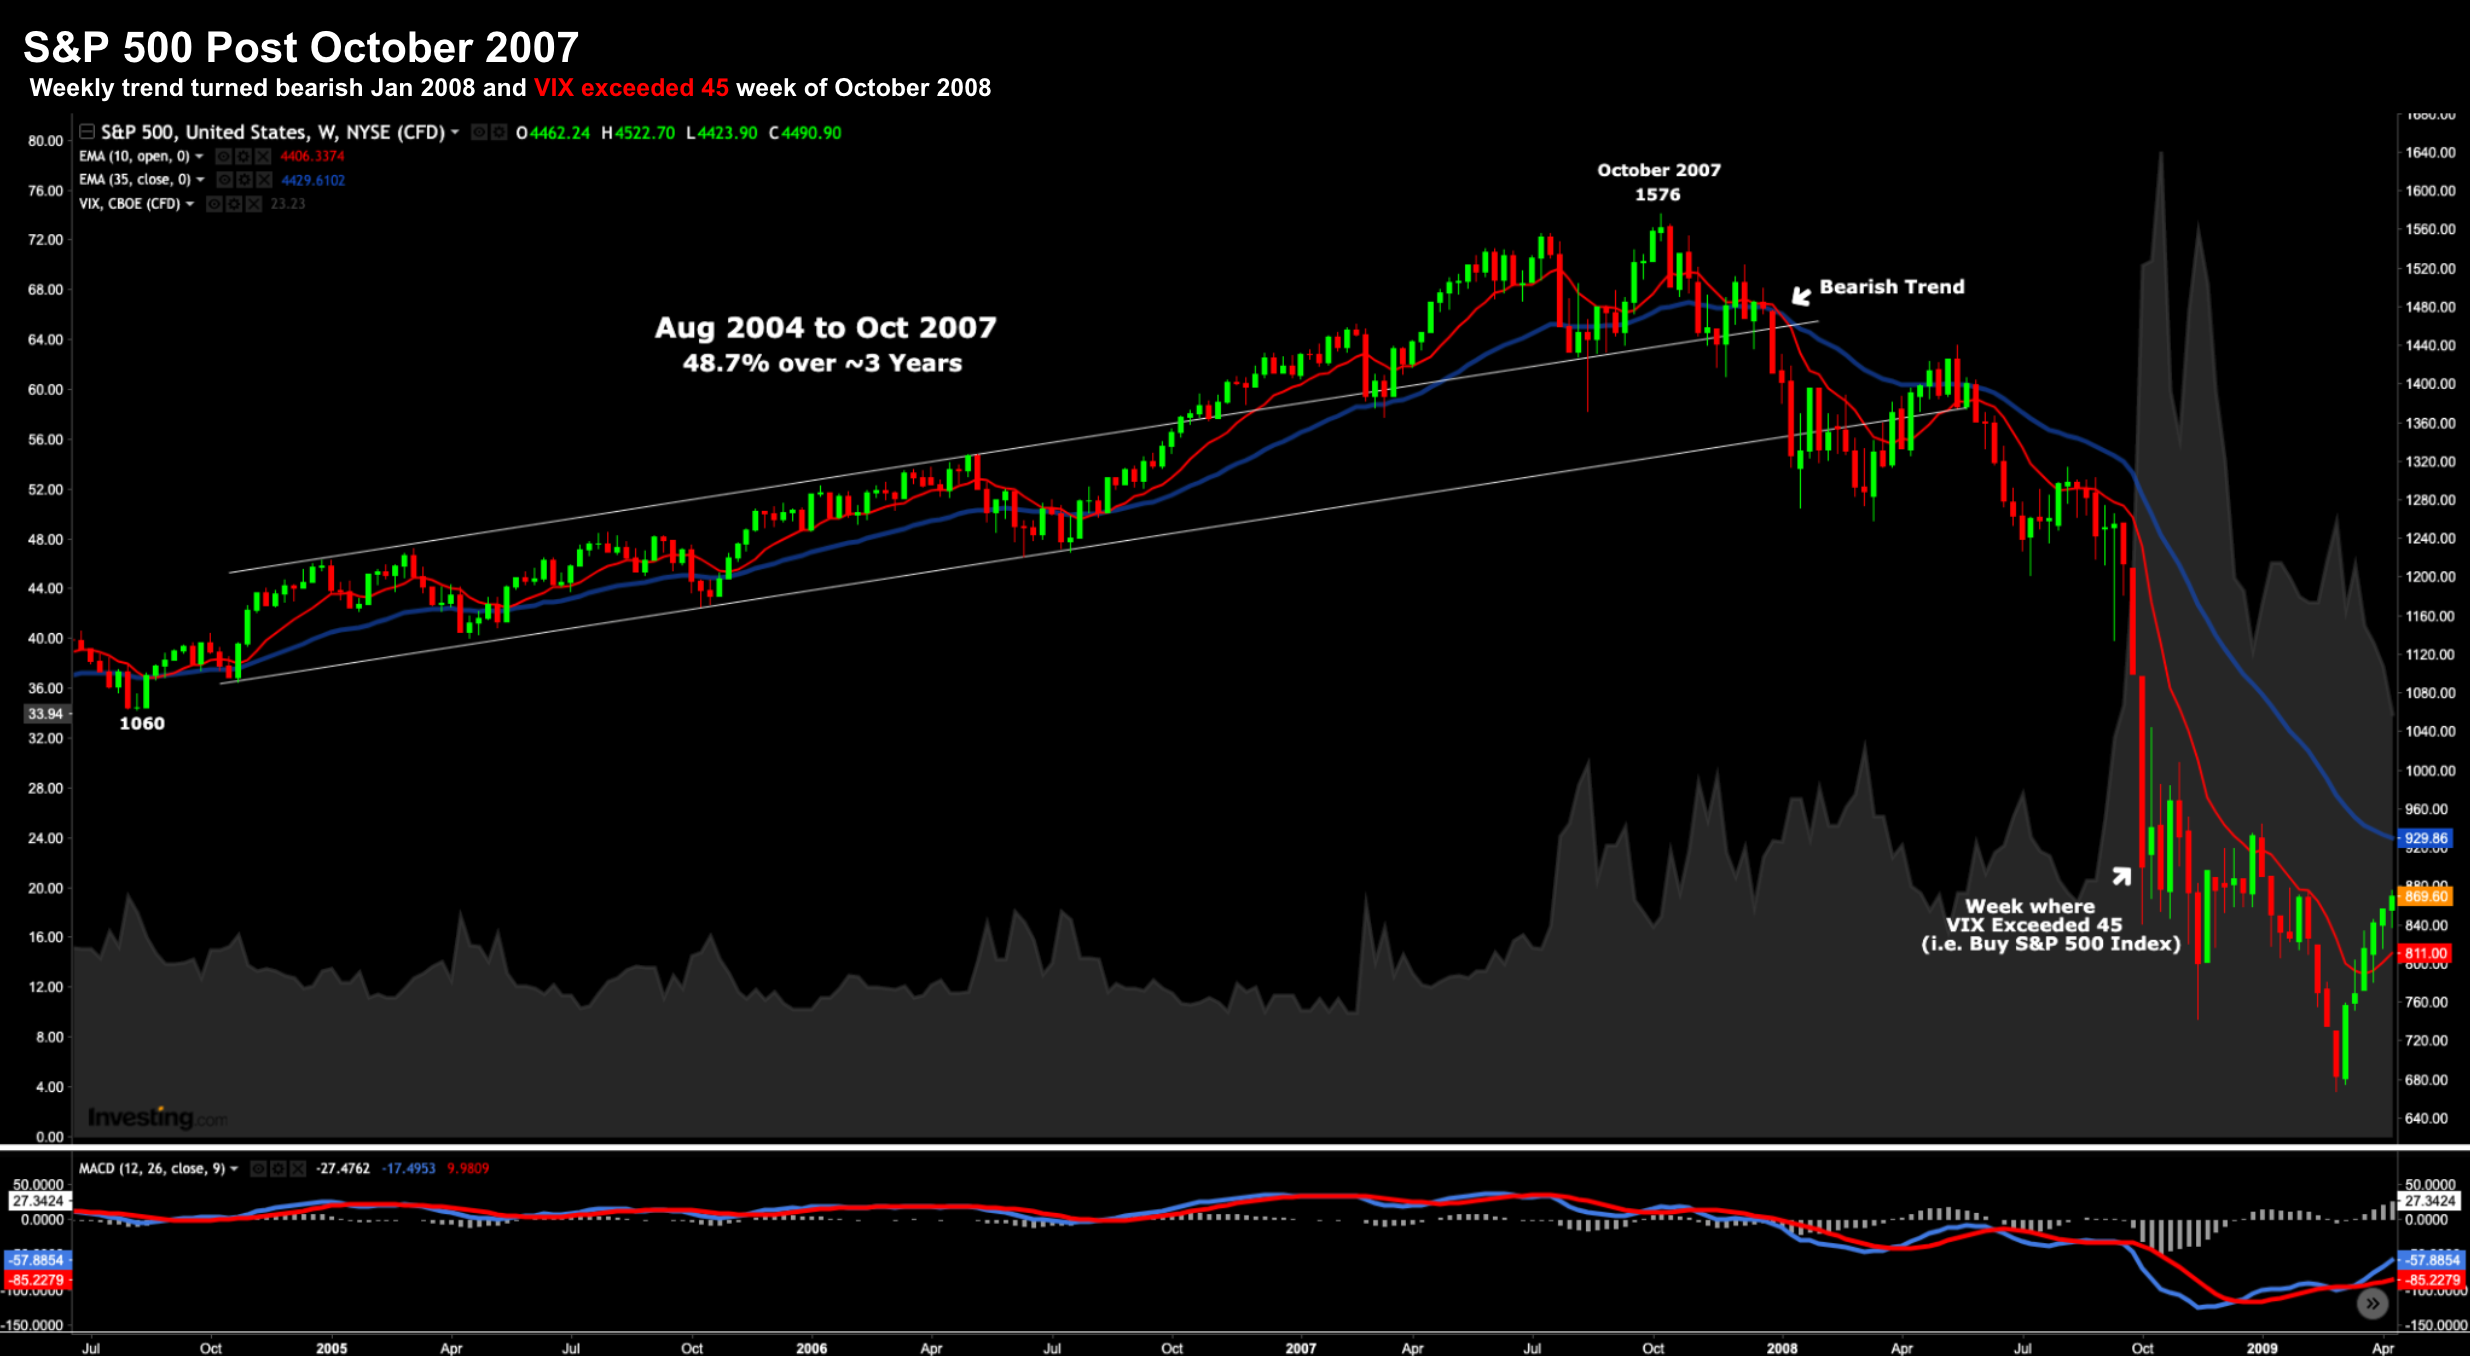
Stocks proceeded to lose 50% of their value.
Two technical observations to highlight:
- The earliest warning sign was the 10-week EMA moving below the 35-week EMA (i.e., bearish trend); and
- A pivot with the monthly-MACD (chart below).
This reliable long-term momentum indicator also turned negative in January (circled in green).
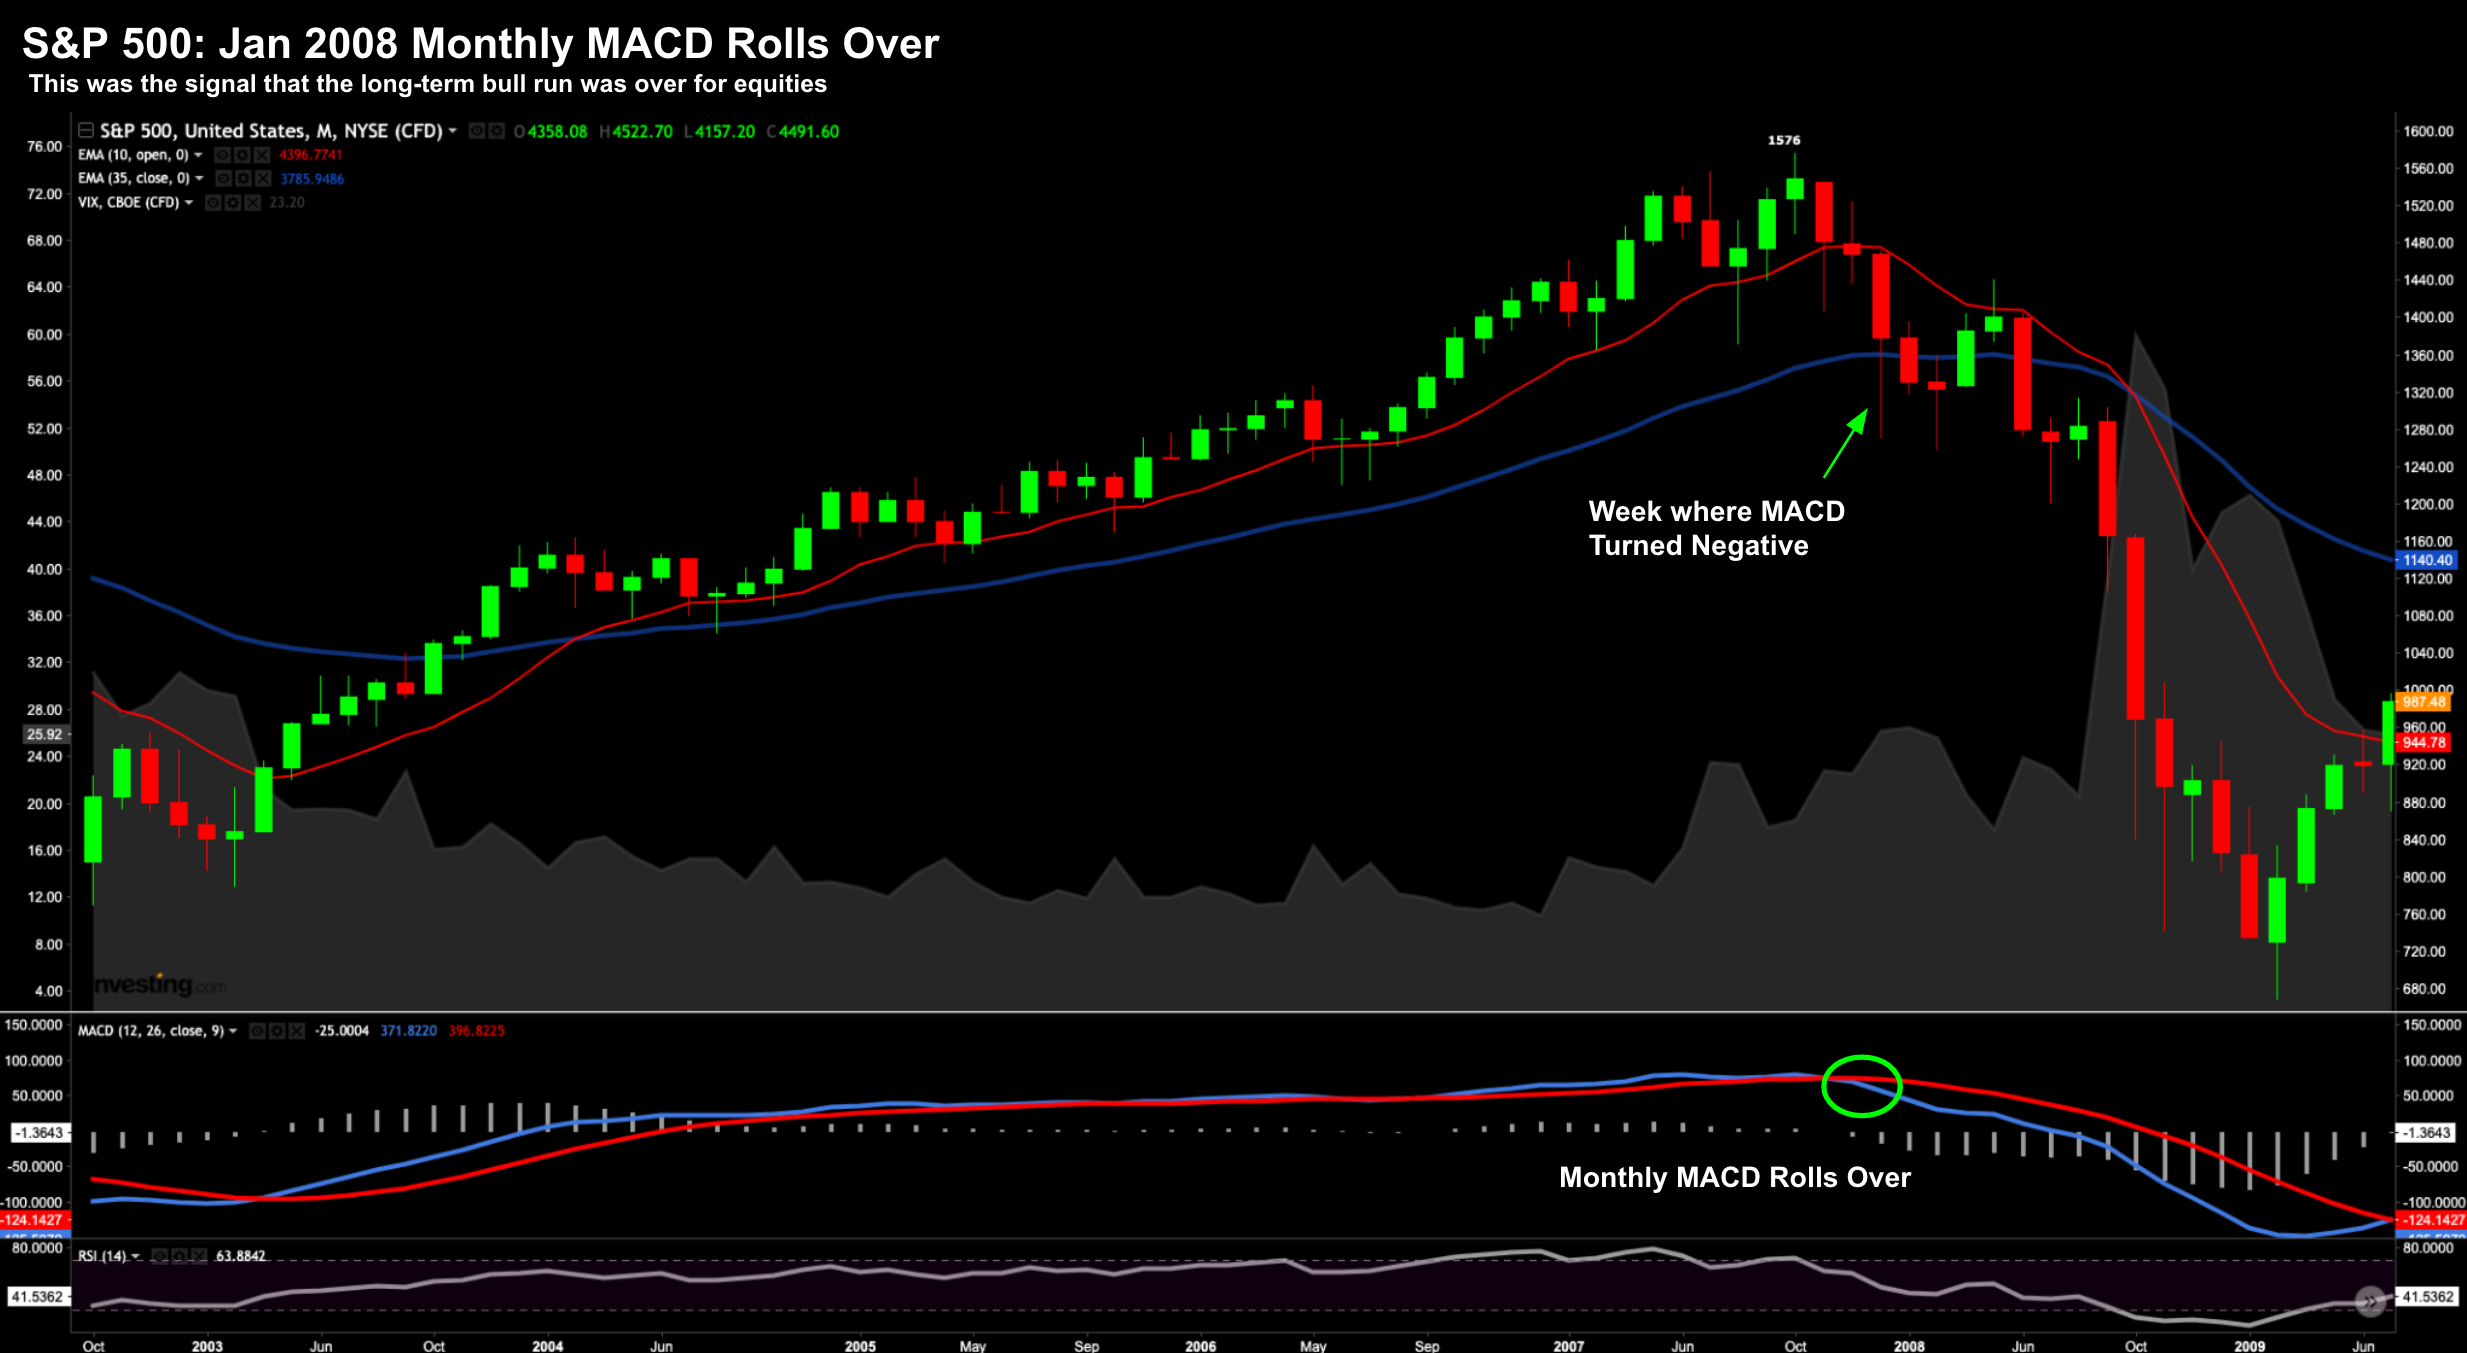
Jan "08 – Monthly-MACD Warned of Selling Pressure
January 2008 was obviously the time to de-risk.
As a complete aside – the VIX exceeded 45 the month of October 2008.
My own research indicates this was the time to buy the Index for the longer-term (as I demonstrated here).
Which Brings Us To Today
So is this historical context helpful?
In terms of equities – the S&P 500 is now in a new weekly bearish trend (from March 7)
Who knows whether that holds?
For example, whilst stocks enjoyed a rally from oversold levels – I think we"re likely to see near-term resistance around the "4500 zone". You can read my latest weekly technical analysis on the S&P 500 here.
But what does the (more reliable) monthly-MACD tell us?
Guess what… it too has turned lower (see lower section of the chart)
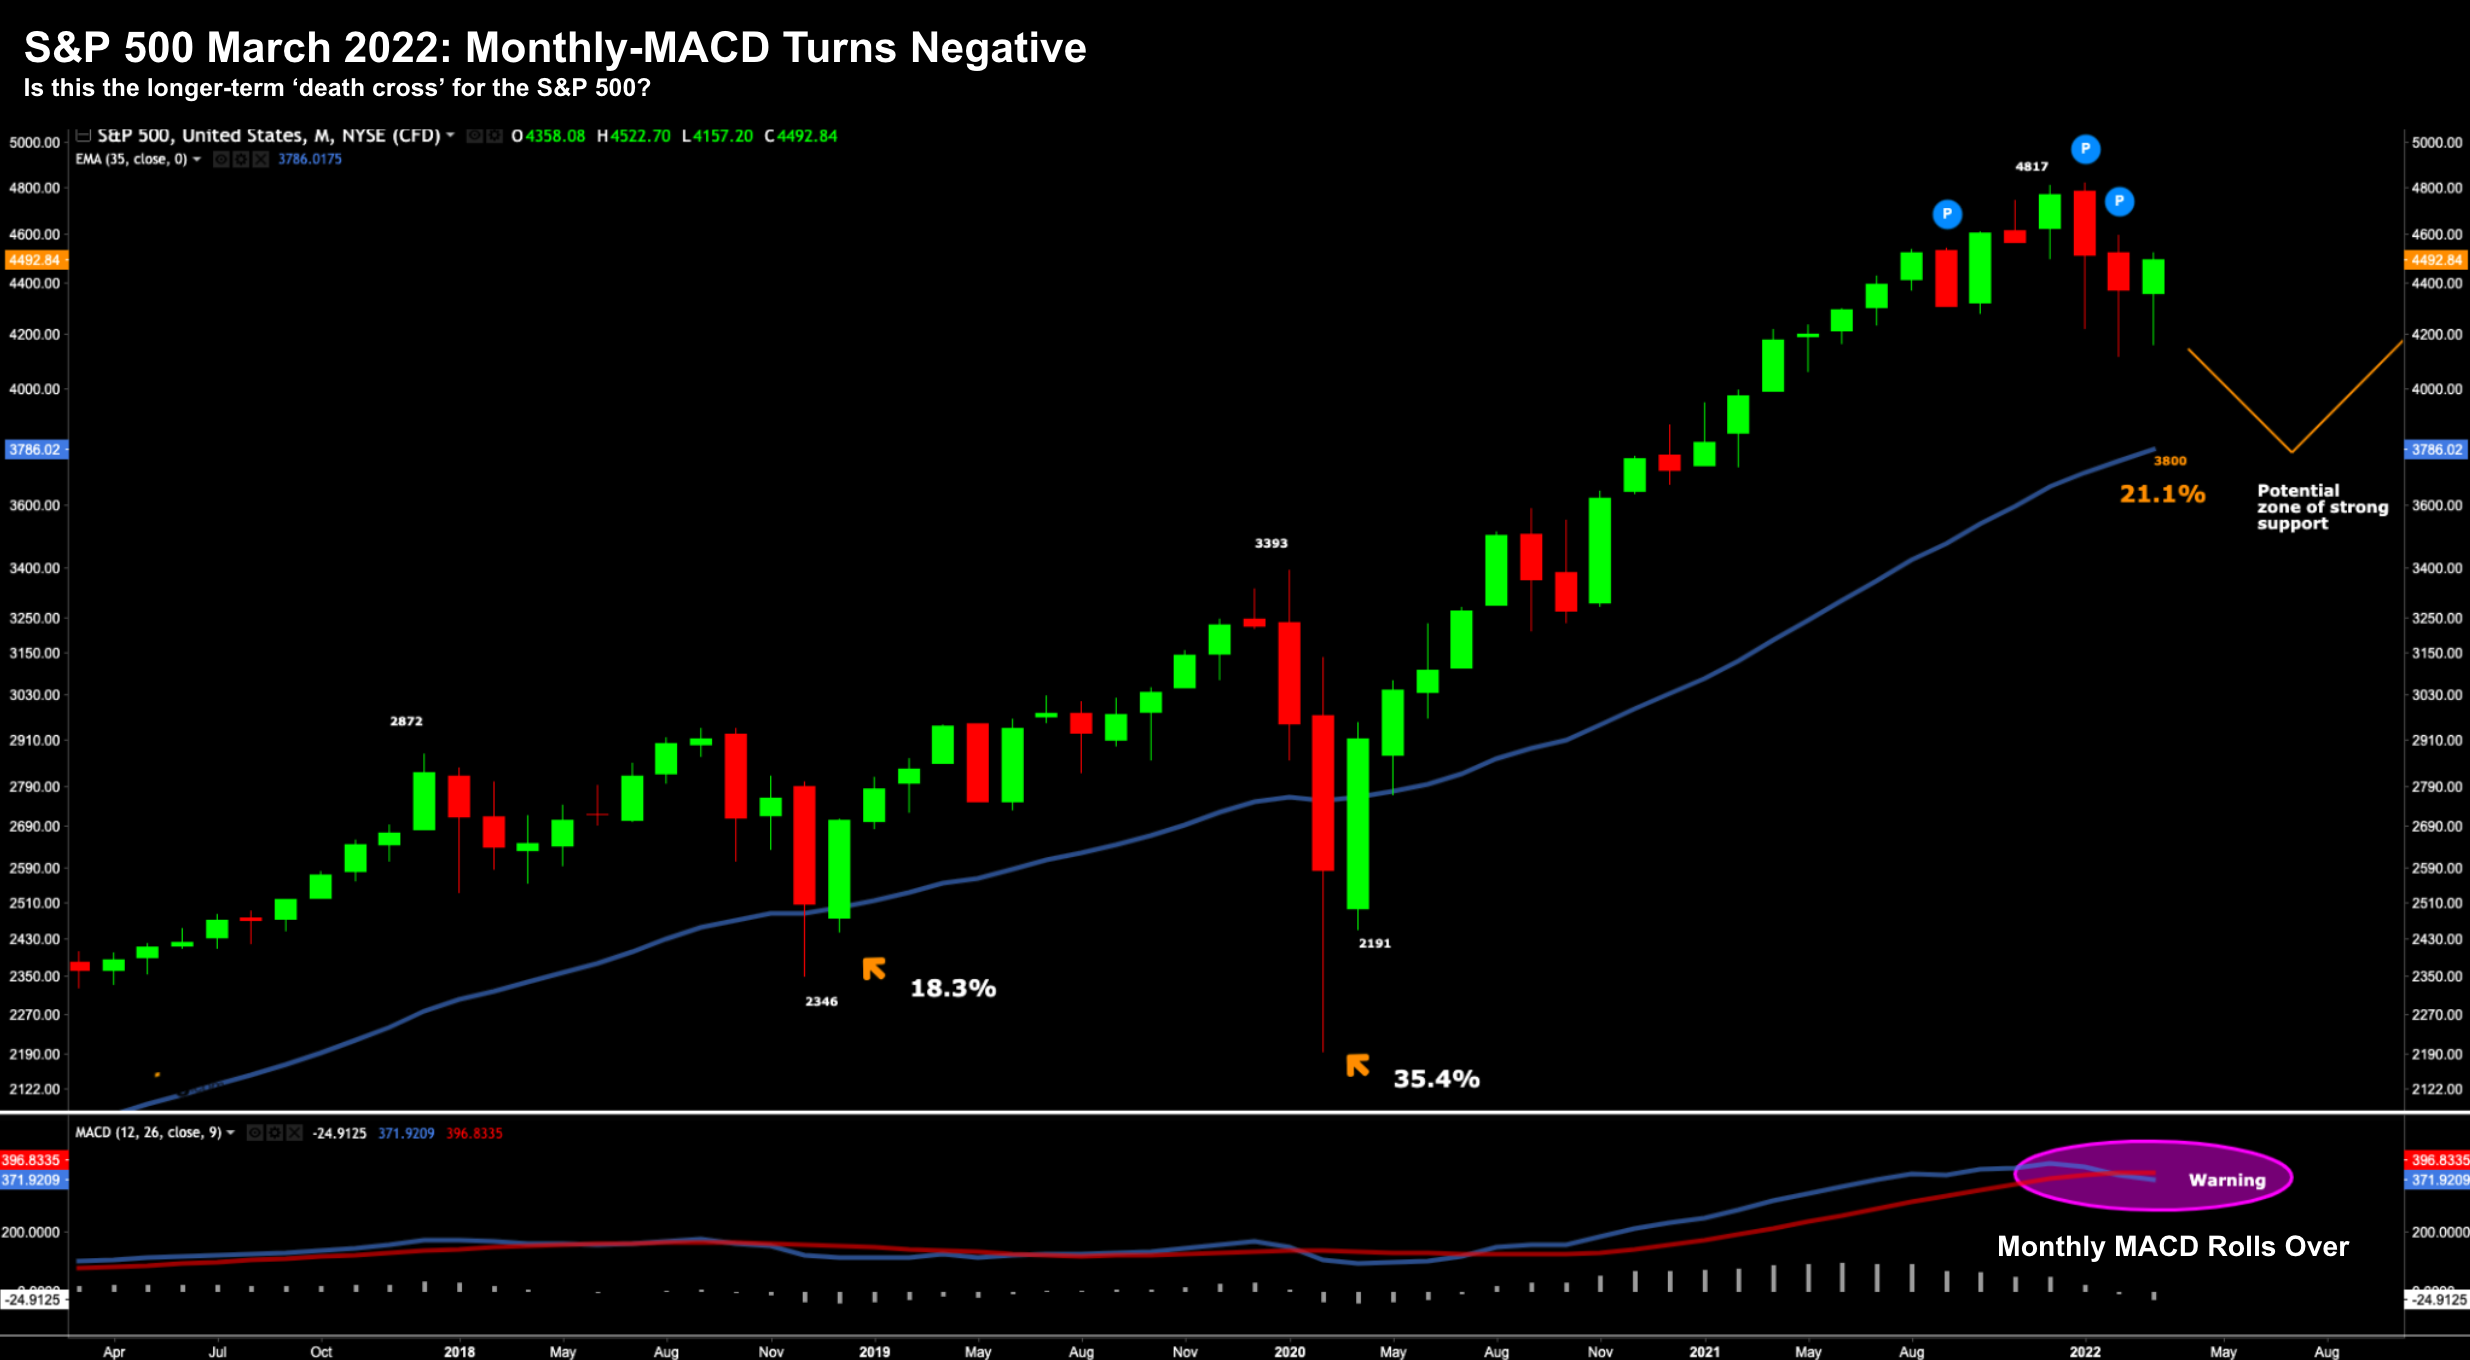
As we saw in 2000 and 2008 — this is a longer-term warning signal.
But let me be clear… this is not an immediate sell signal.
For example, the market could easily re-test the highs of 2021 in the second half of the year.
Earnings could surprise on the upside; inflation could fall; and Fed might temper rate hikes.
This would all be positive news for equities.
Further to my preface (and recent posts) – we were oversold in the near-term (down ~15% in rapid time) – so it"s not unexpected to see some stocks rallying the past week or so.
However, this longer-term indicator tells me there is downside risk ahead (similar to October 2007)
And I think that risk will be opposite:
- slower economic growth with persistent inflation;
- slowing earnings growth; against
- sharply higher rates and quantitative tightening.
We"ve Seen this Movie Before
It"s not uncommon to see sharp short-term rallies as the uncertainties increase.
When the VIX is trading north of 30… markets can overshoot in both directions on a daily and weekly basis.
For example, earlier in 2008 and in 2000 there were sharp upside rallies as the longer-term indicators rolled over.
What"s more, the Fed started (aggressively) raising rates as markets continued to grind higher.
But from a fundamental lens – things today look less positive (or less "accommodative") as they did this time last year.
For example, 12 months ago we had strong economic growth, far lower inflation (apparently transitory), zero rates for the foreseeable future; and record company profits.
What"s more – we had a confident consumer.
Fast forward to today…
We have economic growth materially lower (e.g. from GDP 7.0% last quarter to around 1.0% this quarter) – and a host of reasons why stock prices will likely adjust longer-term (not to mention a prolonged war in Europe)
Mike Wilson from Morgan Stanley said on CNBC earlier this week "we are much closer to where earnings revisions are going to get more negative"
And whilst there will be earnings growth year-on-year – there is no question that we will see lower velocity.
That velocity is likely to drop on the back of (a) higher rates; and (b) greater inflationary pressures.
As Wilson said – you don"t need a recession for evaluations to normalize.
From mine, I think the question to ask is whether earnings growth has peaked?
I think they have.
For example, over the past few years watched earnings rise in the realm of 30%+.
I don"t think we will see that this year…
And as we go into a slower growth environment where input costs for business are 10% to 20% higher – this will result in margin pressure.
And from there, the earnings multiple that the market applies is likely to be less.
Again, the longer-term technical picture suggests (to me) this is the case.
Putting it all Together
All of this augers for a less-than-bullish long-term view.
If you see otherwise, let me know.
But don"t confuse that with possible near-term upside for the market.
For example, it"s most unlikely there will be a recession within 12 months; and rates will continue to remain extremely accommodative in real terms (despite several rate hikes).
What"s more, it"s my guess that corporate profits will be strong when they report for Q1.
They will show earnings growth (albeit a slower rate)… and consumers still have money to spend (as we saw with NIKE"s latest report)
But…
Let me ask you two questions:
- How strong will the US consumer be after 7+ rate hikes; $100 oil and sustained overall inflation (5%+) the next 1-2 years? and
- How robust will corporate earnings be in the face of sharply higher input prices (e.g., wages, rents, materials etc)?
These are longer-term (12 month) questions I"m trying to calibrate (not so much the next few weeks or months).
In summary, I don"t think the Fed can "land the plane softly".
For example, the Fed are likely to hike 7+ times this year (that"s what futures have priced in) – as growth continues to slow.
But as we approach mid-to-late 2023… it"s my guess that Fed perform a v-shaped pivot to being doves.
Again, let"s revisit history…
After hiking aggressively through the first half of 2007… the Fed pivoted in Aug 2007… which saw rates at trade at zero by Dec 2008
We saw a similar v-shaped pivot in the lead up to the recession of 2000…
The long green and red arrows showing the respective pivots in rates.
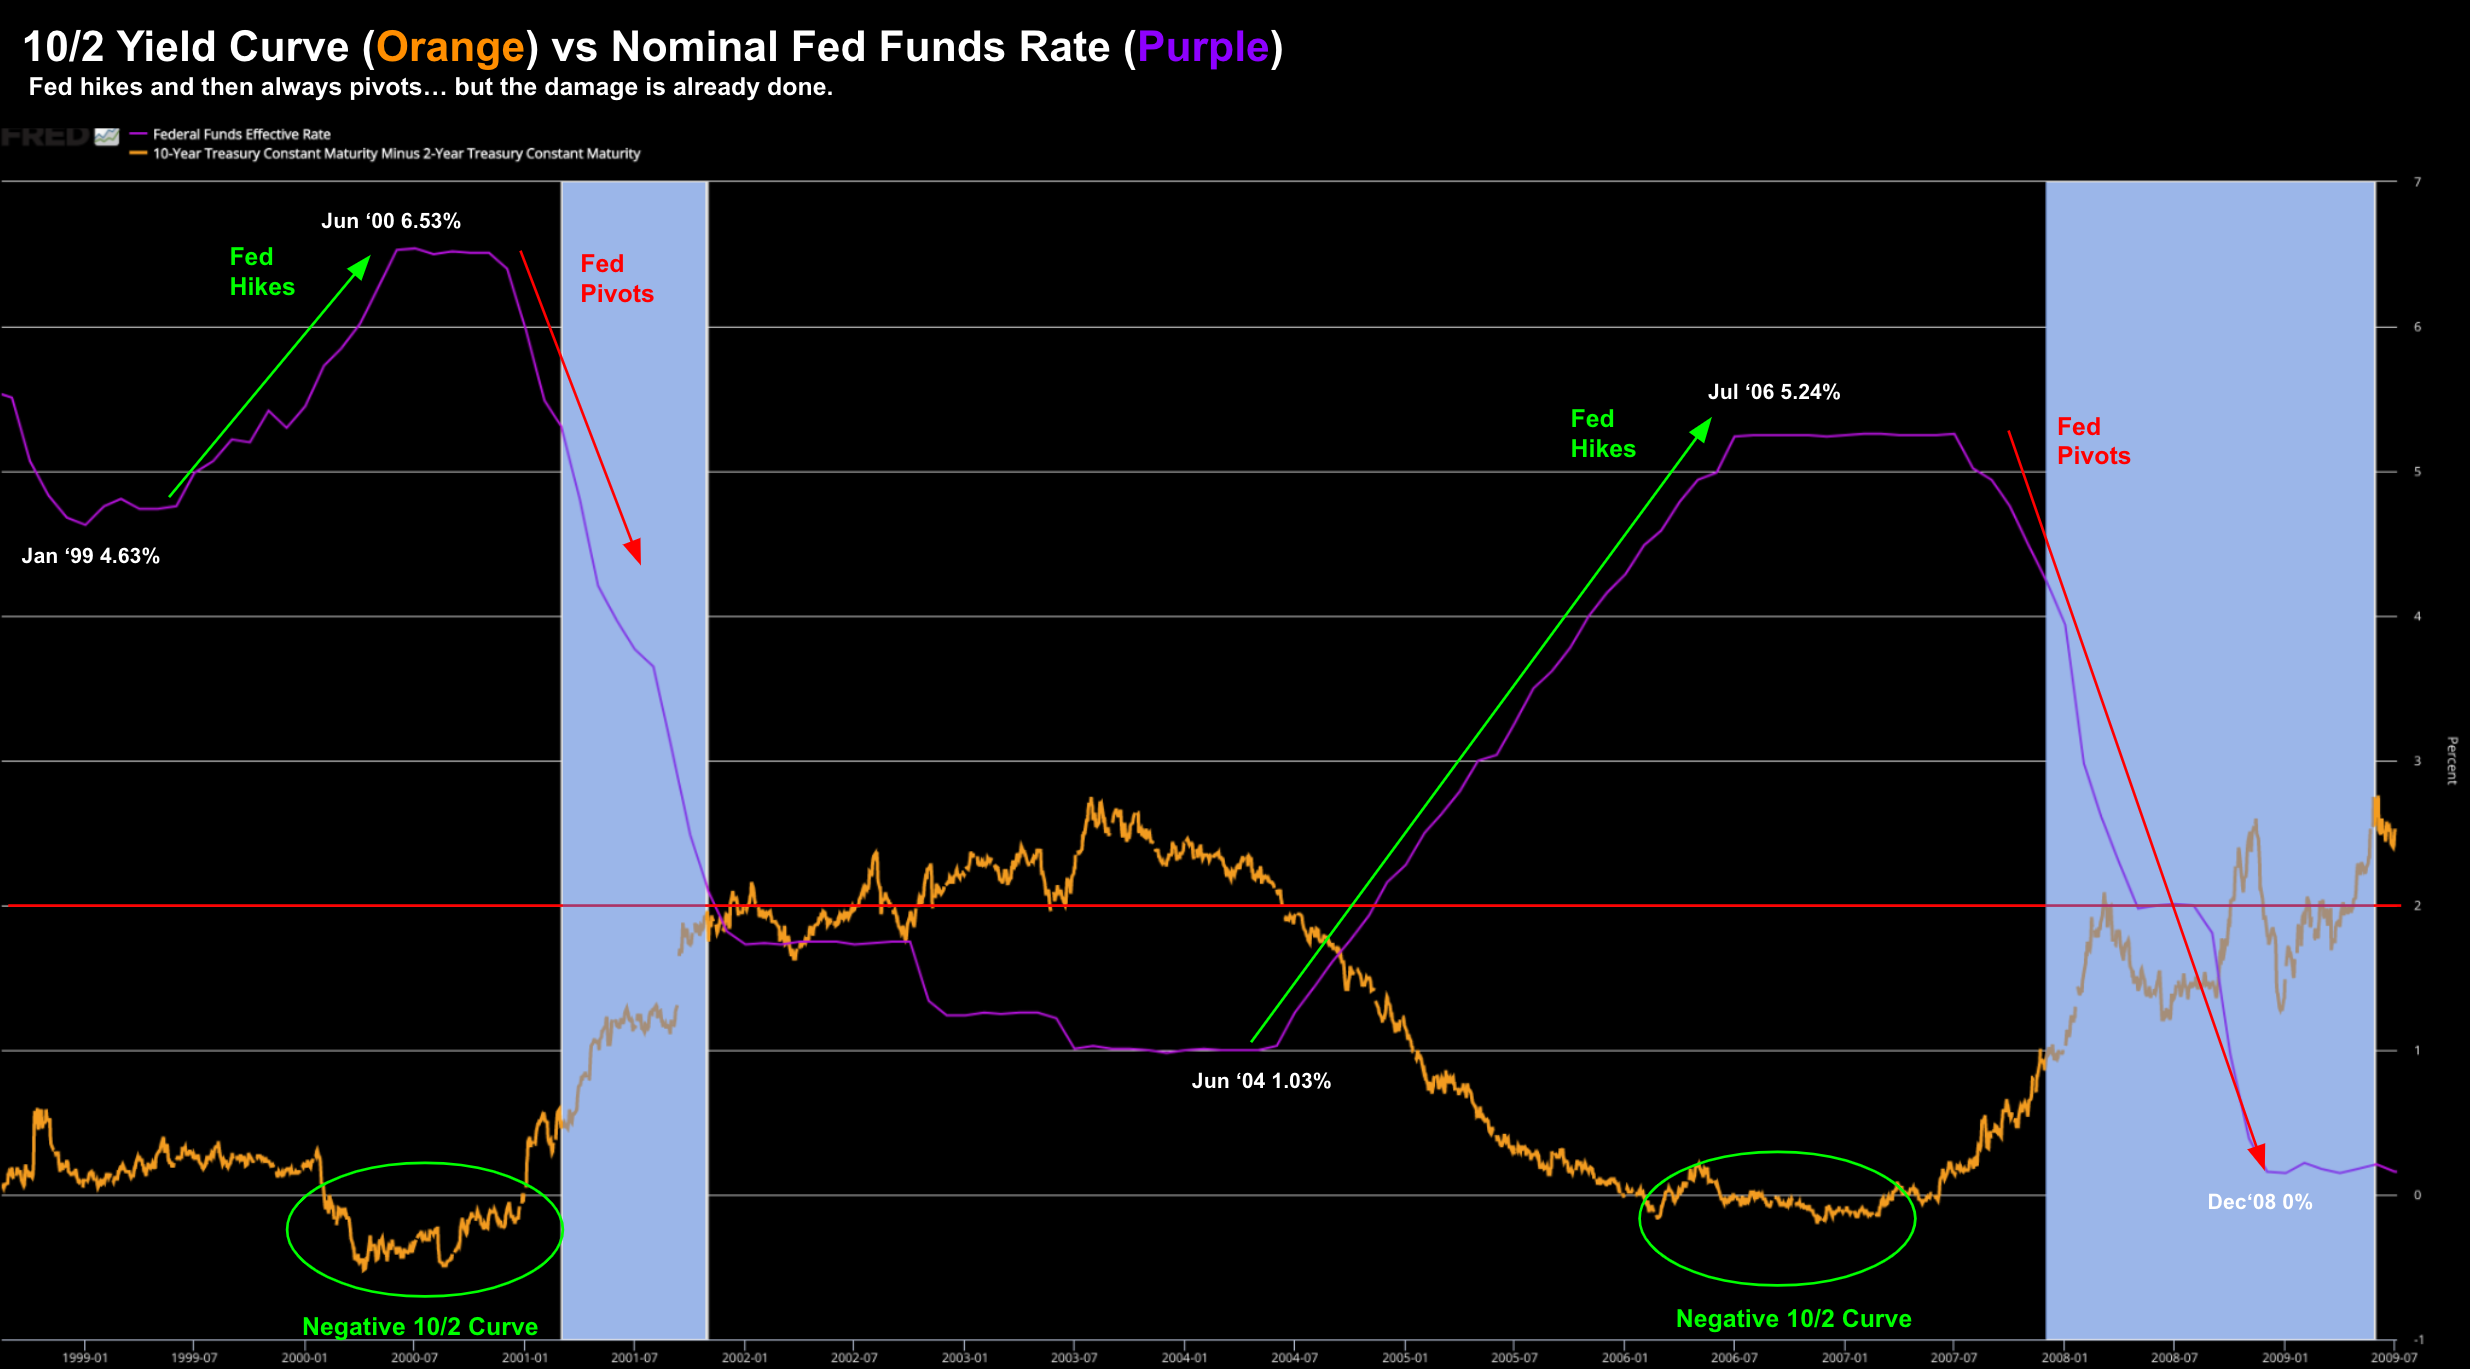
We are about to see the next green arrow higher… perhaps 12 months too late.
But despite the desperate pivots to save the economy from recession – the fix was already in.
It"s my bet this will be "rinse and repeat" for the Fed in 2023.
Keen an eye on the 10/2 yield curve… once this turns negative… start your clocks.