Recession Indicators: Analyzing M2 Money Supply and Swap Spreads
- The best play on higher inflation in 2022: IWM ETF
- Why I don"t see a recession next year; and
- Where does an incremental $4T in money go (if not inflation)?
Markets continue to climb the so-called "wall of worry".
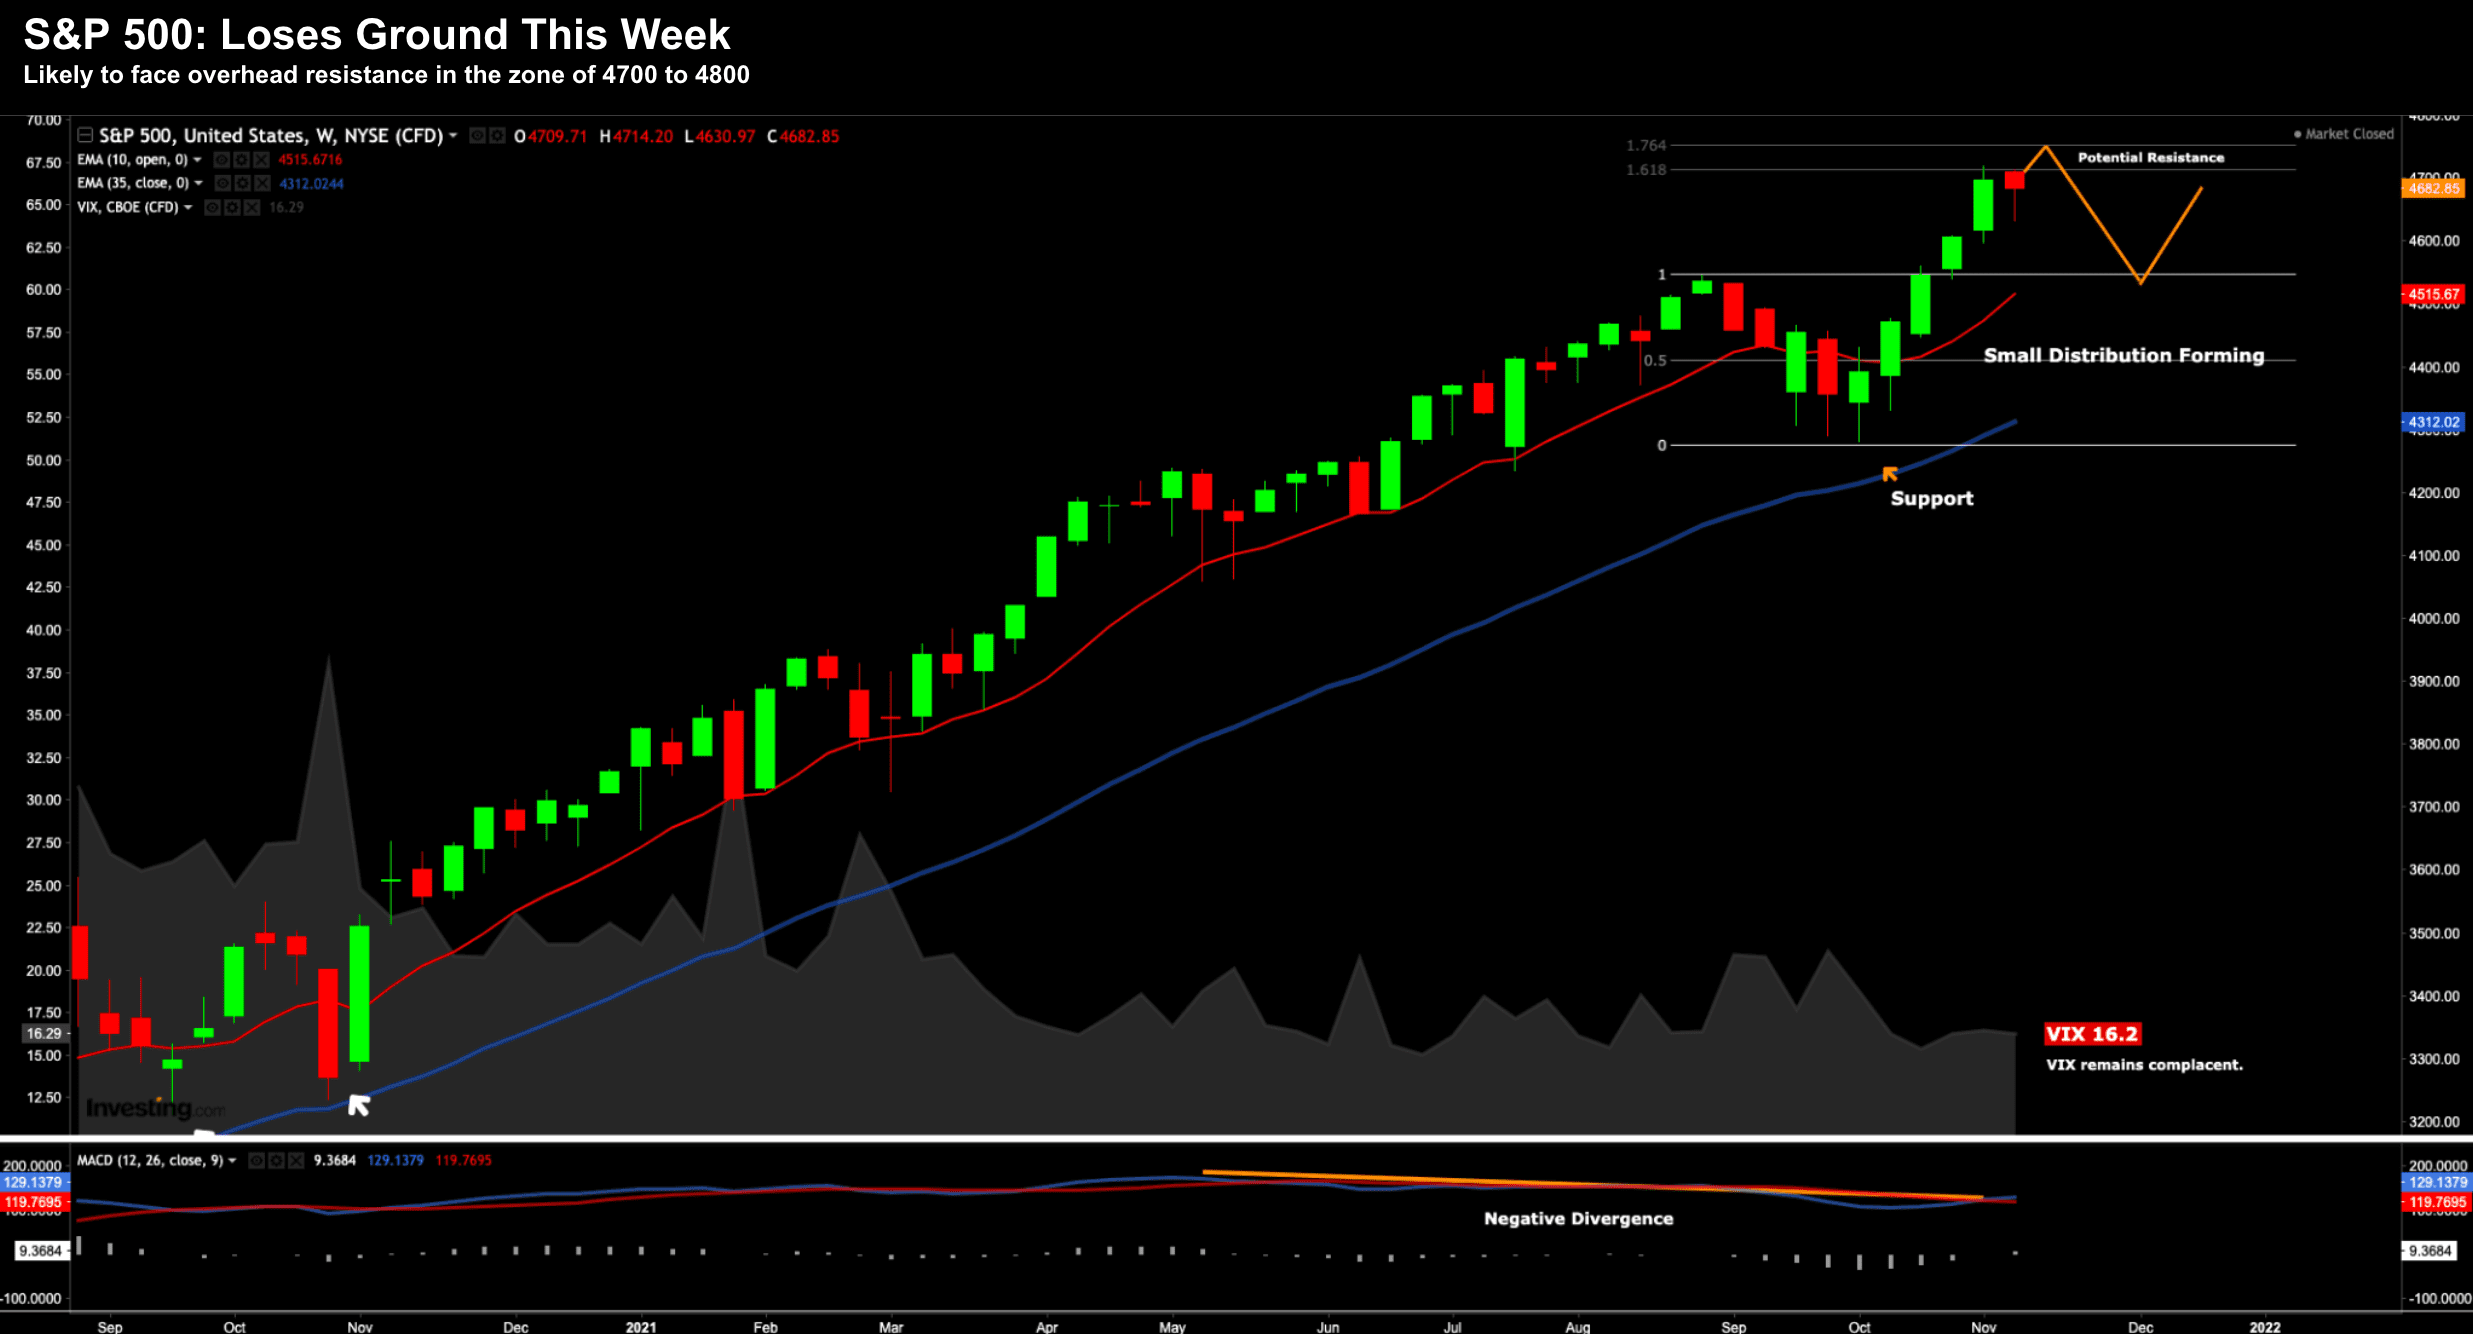
The S&P 500 put in its first negative week since the week ending Sept 17th.
From mine, I think the market finds technical resistance around this zone (e.g. 4700 to 4800).
However, I don"t think the market is in any danger of some imminent (meaningful) correction (i.e. greater than 10%).
To that end, dips will be bought (for reasons I will explain in this post)
Here"s the weekly chart after today"s close:
Nov 12 2021
Perhaps look for a retest of the 10-week EMA (red line) – where I think there will be strong support.
Three things to cover tonight:
(1) what are the risks surrounding any near-term recession?
(2) why inflationary risks are higher than the market expects; and
(3) how to play a highly inflationary environment. s.
Let"s take a look…
No Imminent Recession Risk
Whilst growth is expected to slow (globally) – from mine – there"s no indication markets face any near-term recessionary risk.
Over the years, I favour 4 specific real-time financial indicators which warn me of impending economic (and market) risks. They are:
- 2-Year Swap Spreads;
- Real Interest Rates on 5-Year TIPS;
- Credit Spreads on Corporate Debt; and
- 2-10 Year Treasury Yield Curve
The TL;DR is each of these are "green" in terms of the market"s financial health.
As a preface, I lean into these indicators more than any "economist forecast" (n.b., it"s said economists were put on the earth to make weather forecasters look good) – as they are based on the real-time actions of millions of market participants.
Put another way, they are not subject to multiple revisions or estimates (unlike say employment, manufacturing, GDP, consumer confidence and so on).
Let"s look at why I think we will not see a recession in 2022…
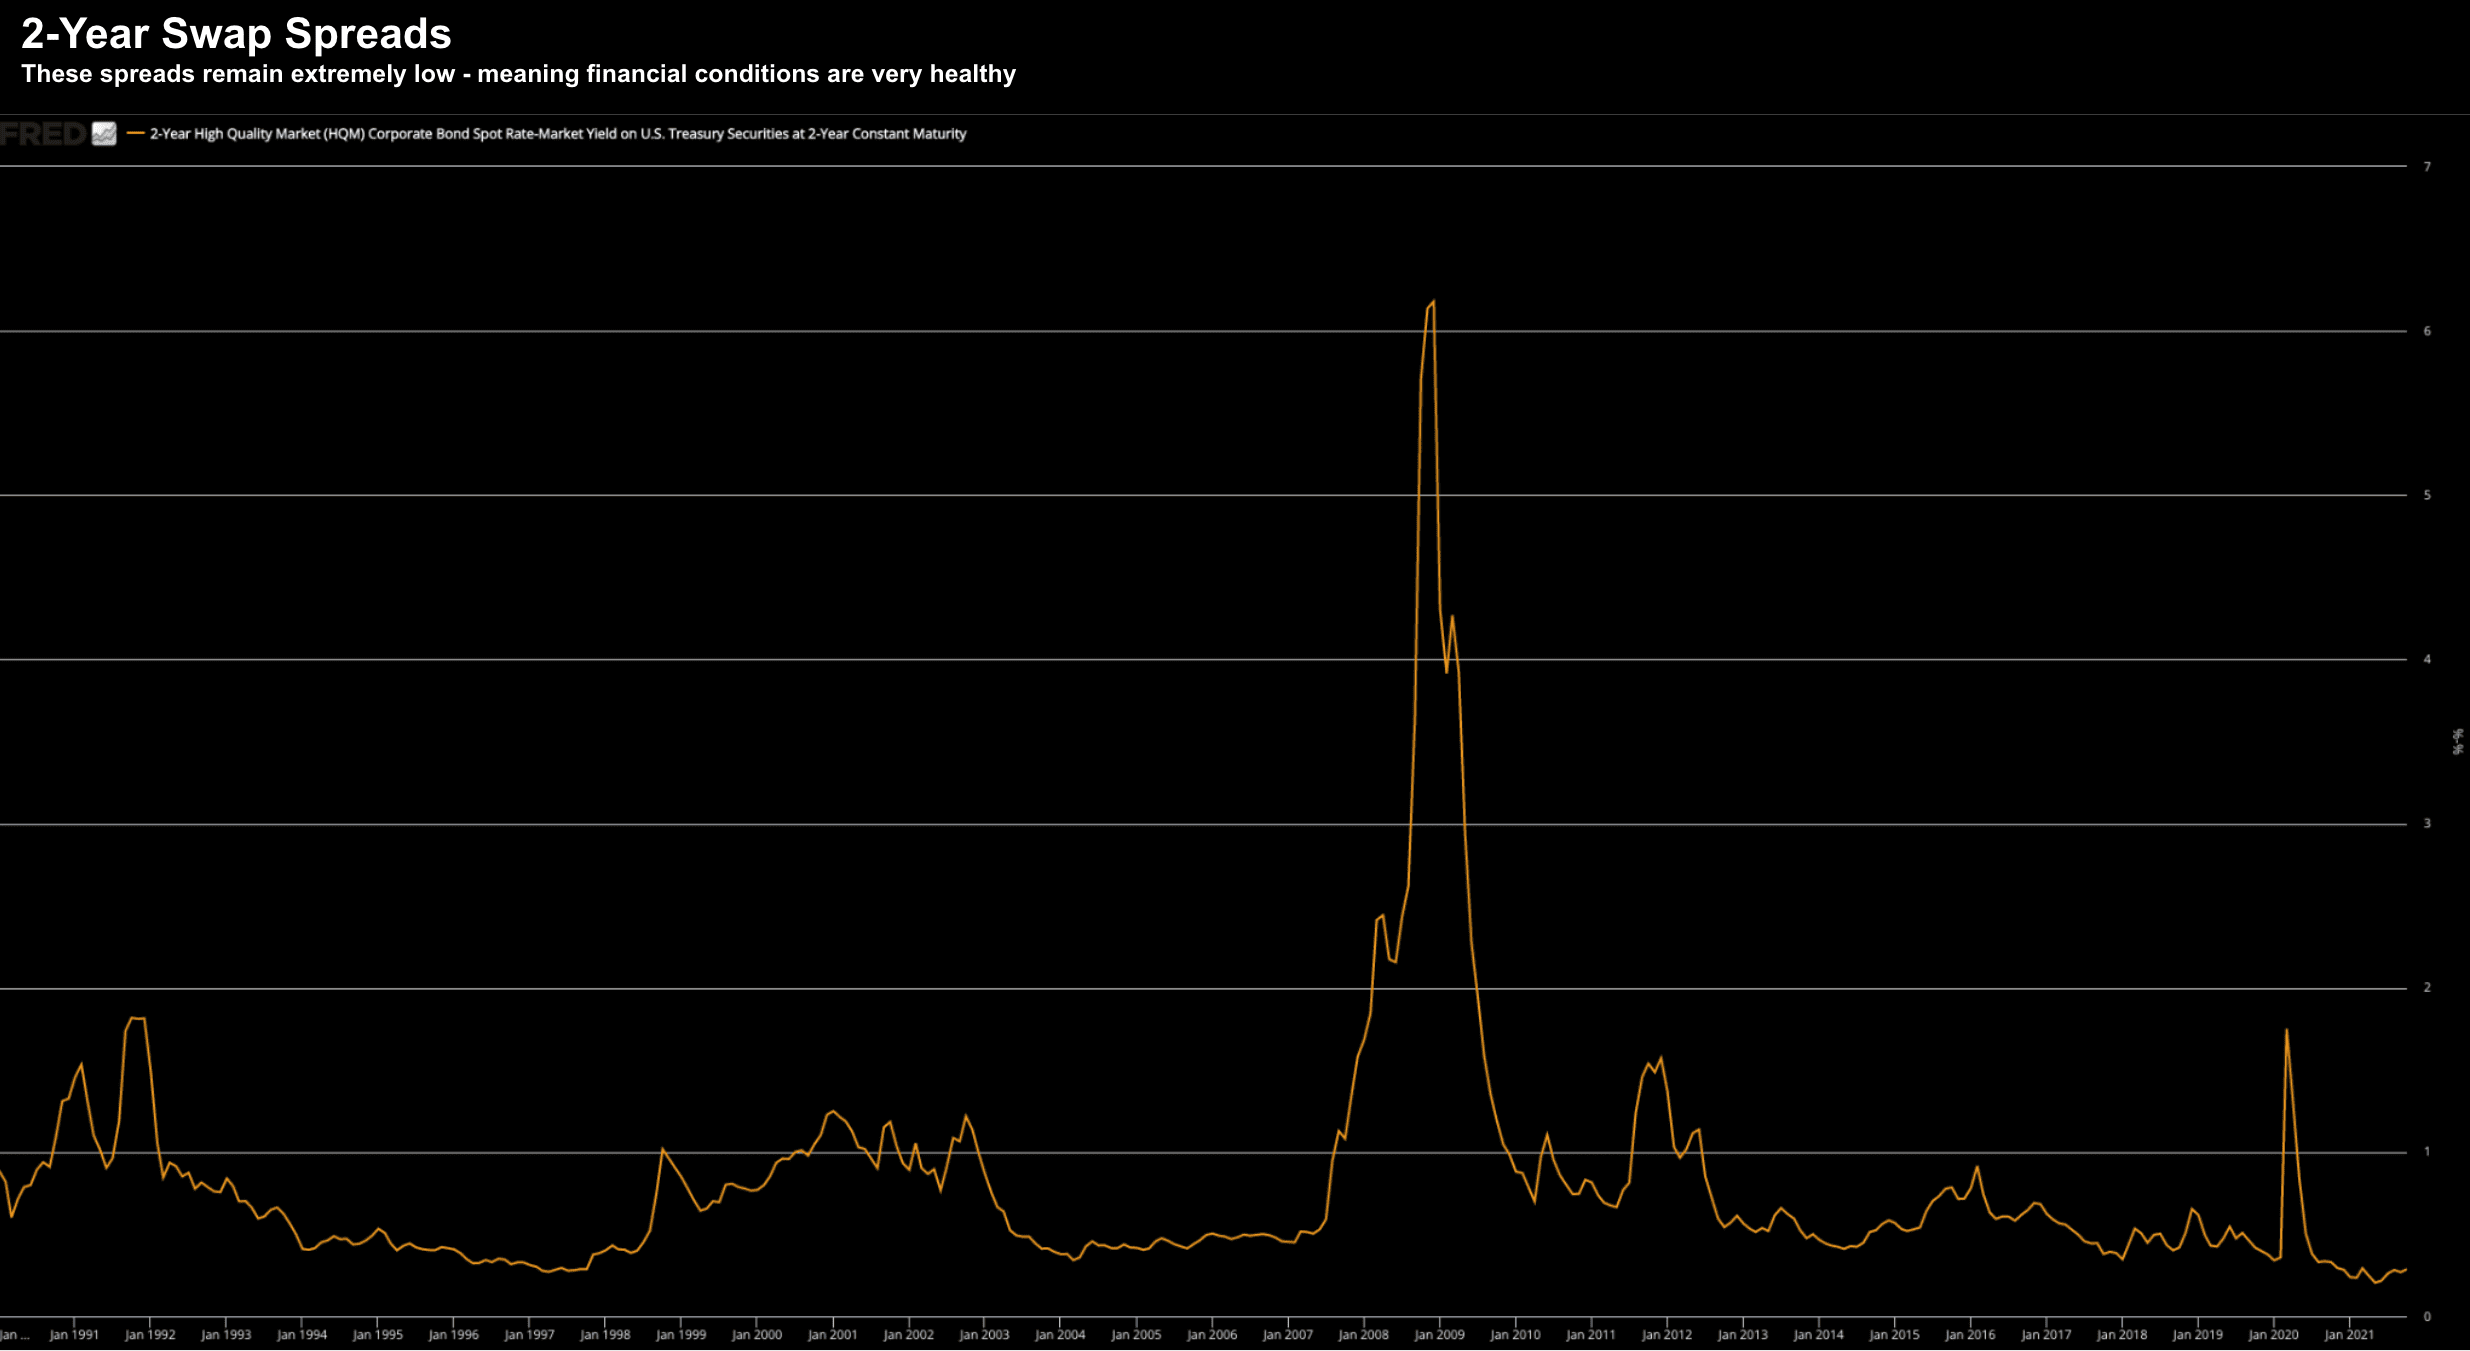
#1. 2-Year Swap Spreads
If you forced me just to pick one indicator to assess financial stress / health in the market – this would be it.
Nov 12 2021
For those less familiar, swap spreads are a great leading and coincident indicator of systemic risk, financial market liquidity and economic health.
The lower the spread is – the better things are.
And as we can see – these spreads remain very tight (as any time in recent history).
There is no "stress" here.
From mine, only if I see these spreads widening beyond say 35 basis points will I raise a yellow (not red) flag.
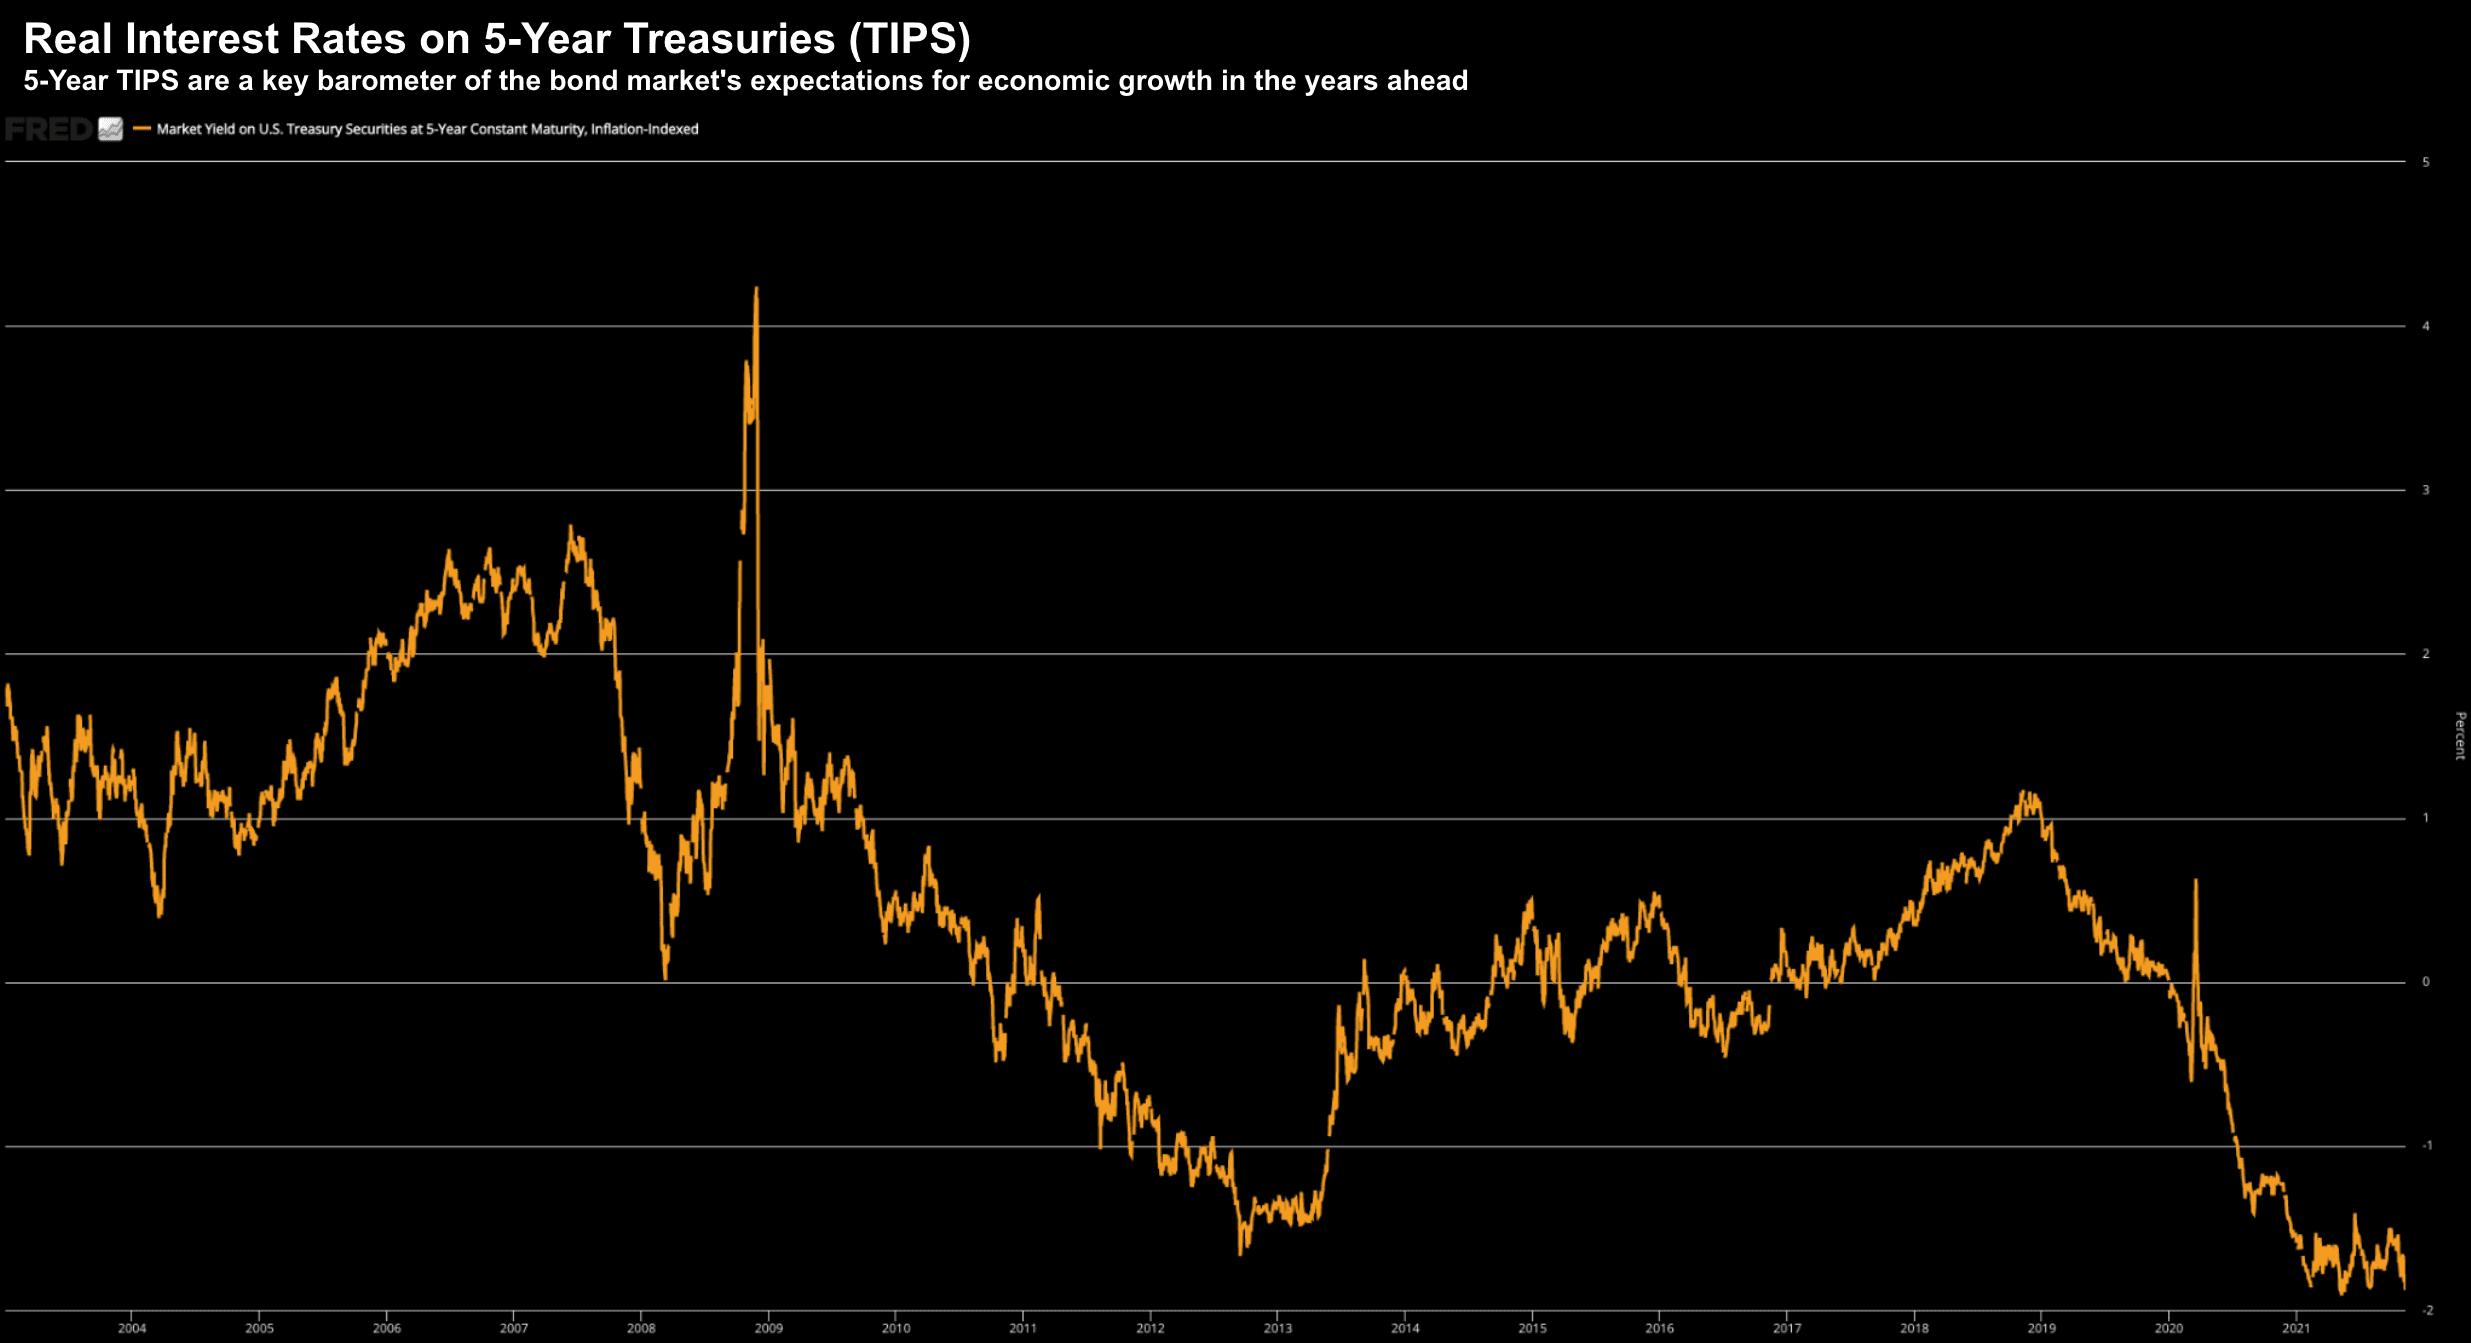
#2. Real Interest Rates – 5-Year TIPS
I have spent a good deal of time talking to the importance / relevance of real interest rates (i.e. those adjusted for inflation).
Real interest rates on 5-Year TIPS are a key barometer of the bond market"s expectations for economic growth in the year"s ahead.
In short, we want to see these rising (not falling).
Problem is… that"s not what we find:
Nov 12 2021
Real yields are as long as any time in history.
This is a concern.
However, as long as Treasuries continue to offer yields below the expected inflation rate, TIPS will remain in negative territory.
For example, if you subtract the expected (current) 5-year inflation rate of 3.03% from the 5-year nominal yield of 1.2% – the result is for the 5-year TIPS is -1.83% (where we are today)
The question is why would investors do this (i.e. accept an investment that charges them money instead of giving it to them)?
Answer: it"s nothing more than a flight to safety
In times of heightened economic uncertainty, investors" fear of losing their investments often overcomes their desire for acceptable returns. Investors continue to purchase TIPS with negative yields because they are concerned about losing the principal on their investments.
Recessionary economic times are typically tough on stocks – therefore paying interest is less costly than losing everything.
My read on this is the market is not confident of strong (e.g. +3.0%) economic growth looking ahead.
In fact, bonds think growth will be dismal. But dismal growth doesn"t mean recessionary.
For the record, I am not a buyer of bonds.
That"s the worst place you could have your money today (outside cash).
#3. Credit Spreads on Corporate Debt
Credit spreads on corporate debt are solid indicators of the market"s confidence in the outlook for corporate profits.
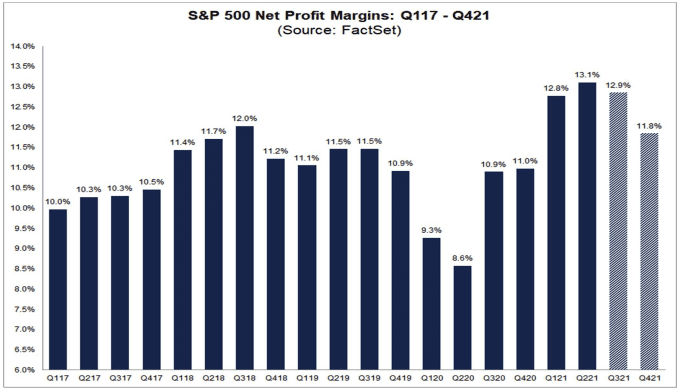
As we have seen recently with Q3 2021 earnings – corporate America continues to make record profits. Here"s Factset:
- Earnings Scorecard: With 92% of S&P 500 companies reporting actual results), 81% of S&P 500 companies have reported a positive EPS surprise and 75% of S&P 500 companies have reported a positive revenue surprise.
- Earnings Growth: The blended earnings growth rate for the S&P 500 is 39.1%. If 39.1% is the actual growth rate for the quarter, it will mark the third-highest (year-over-year) earnings growth rate reported by the index since 2010.
With corporate profits very strong – let"s look at credit spreads on corporate debt.
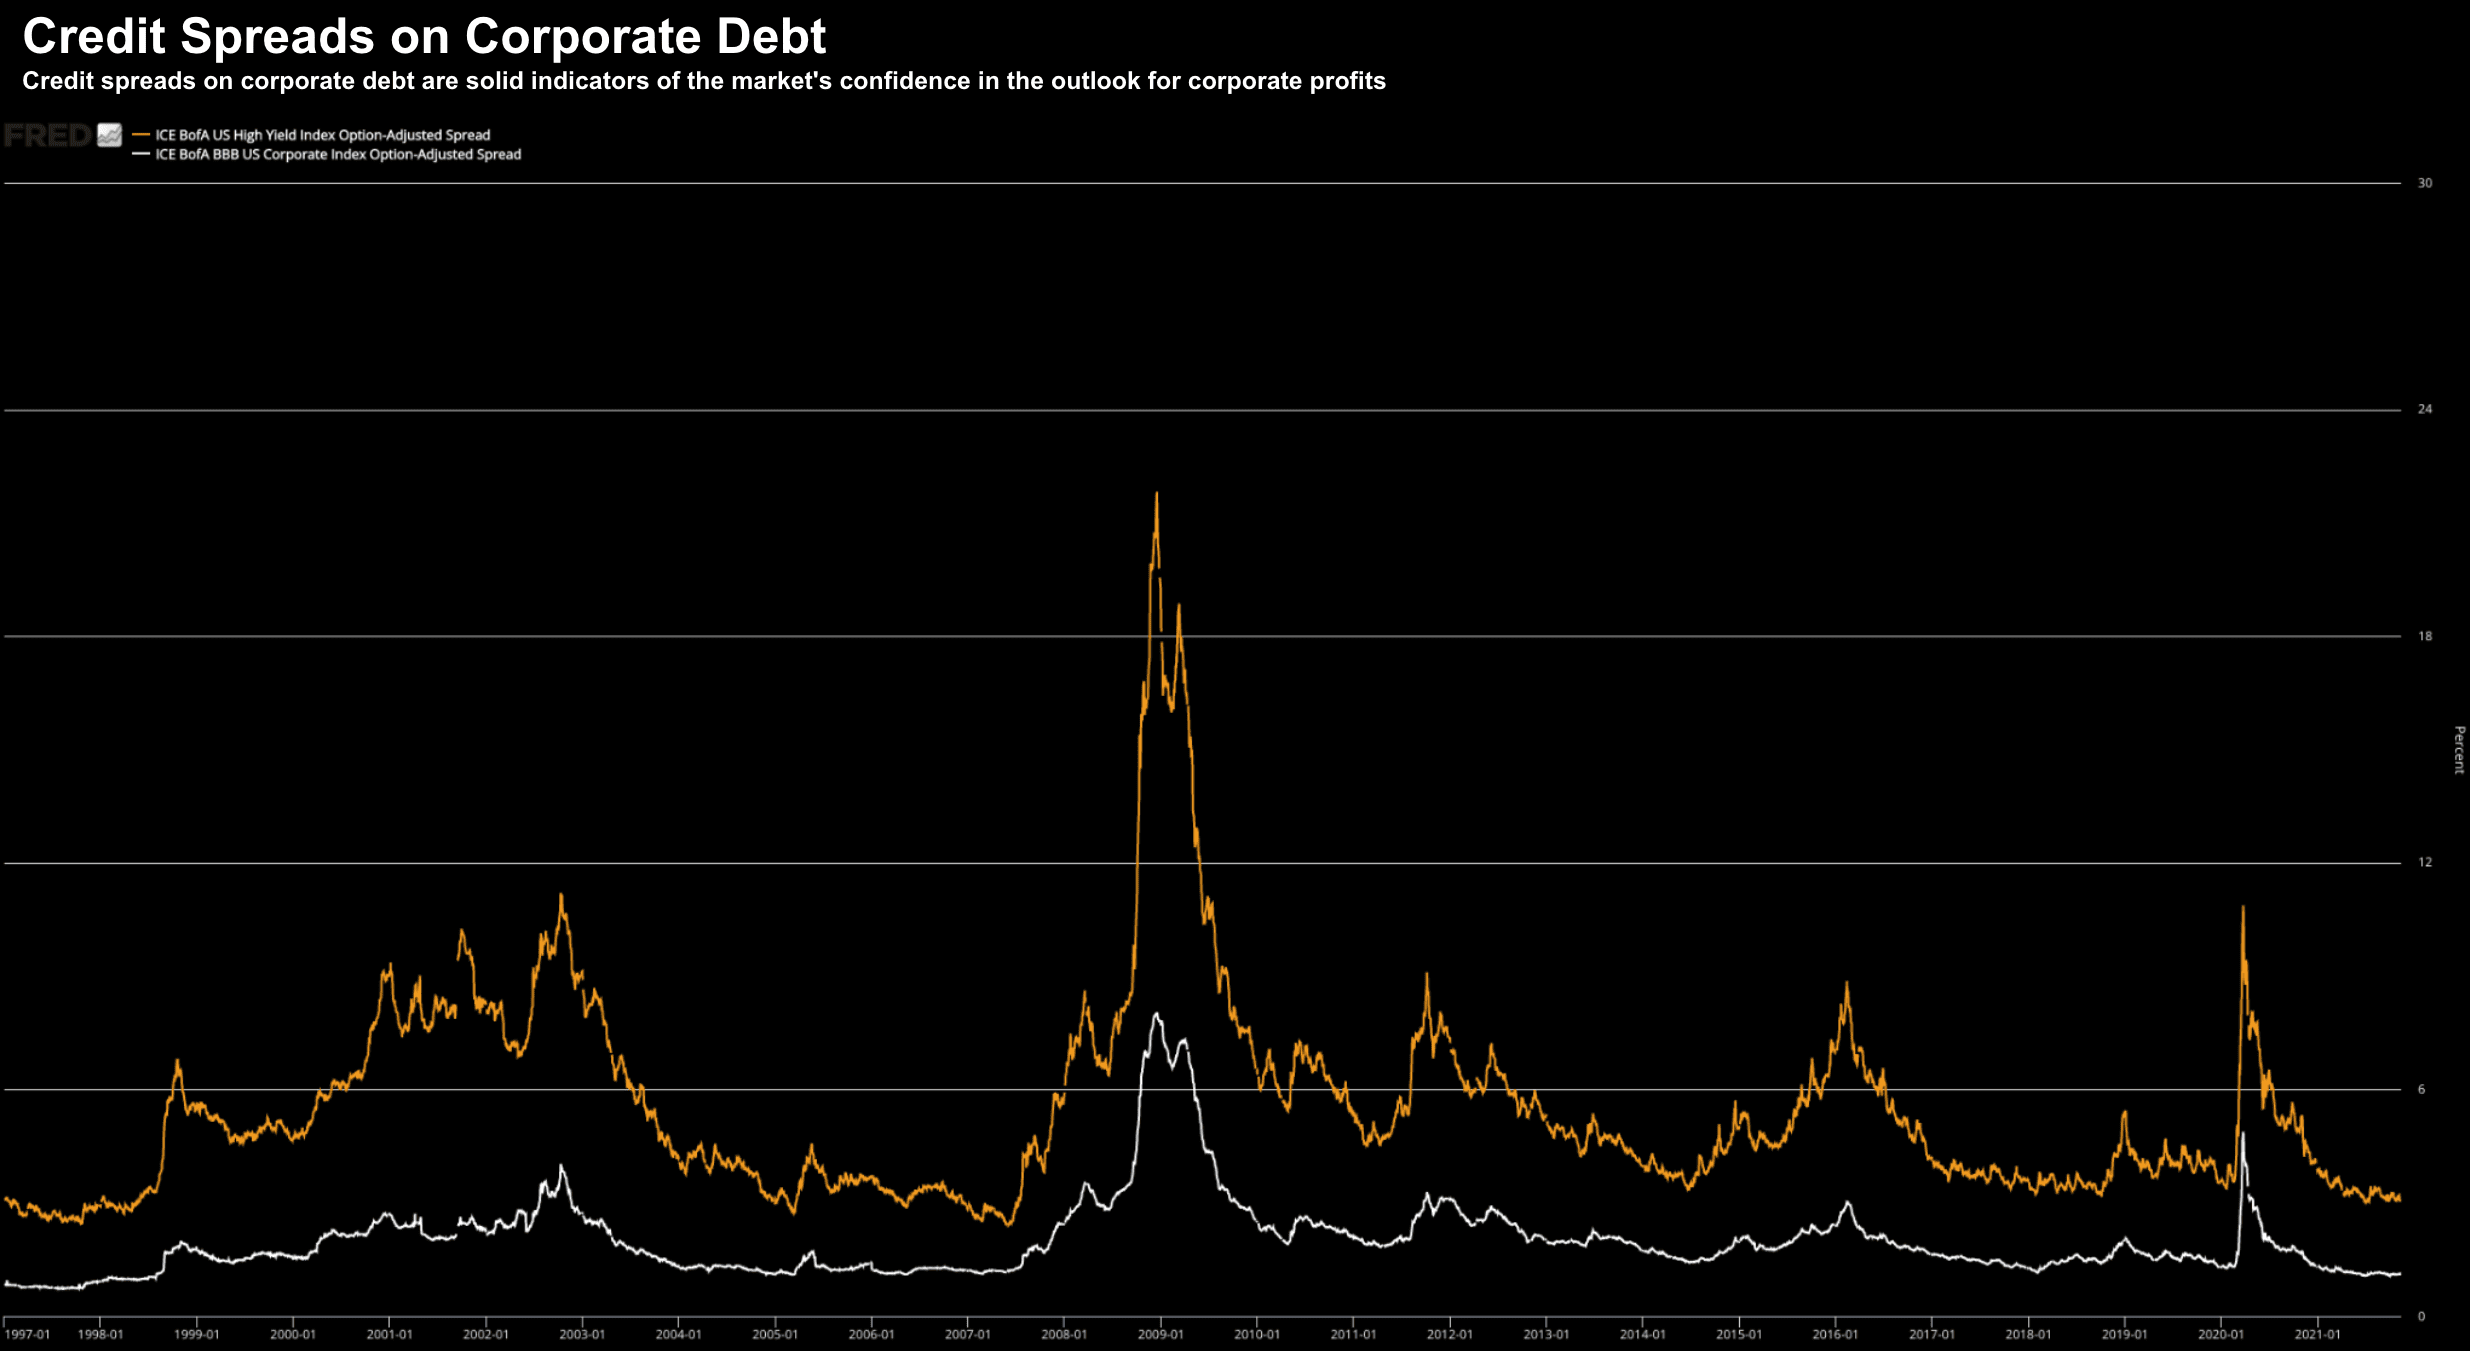
Nov 12 2021
Not surprisingly given the Q3 2021 numbers (and outlook for profit) — the spread between high and low quality debt remains low.
This tells us the market is confident that the outlook for profits remains healthy.
Note: if you want to track an ETF on lower-quality (higher risk) debt – HYG is a good proxy.
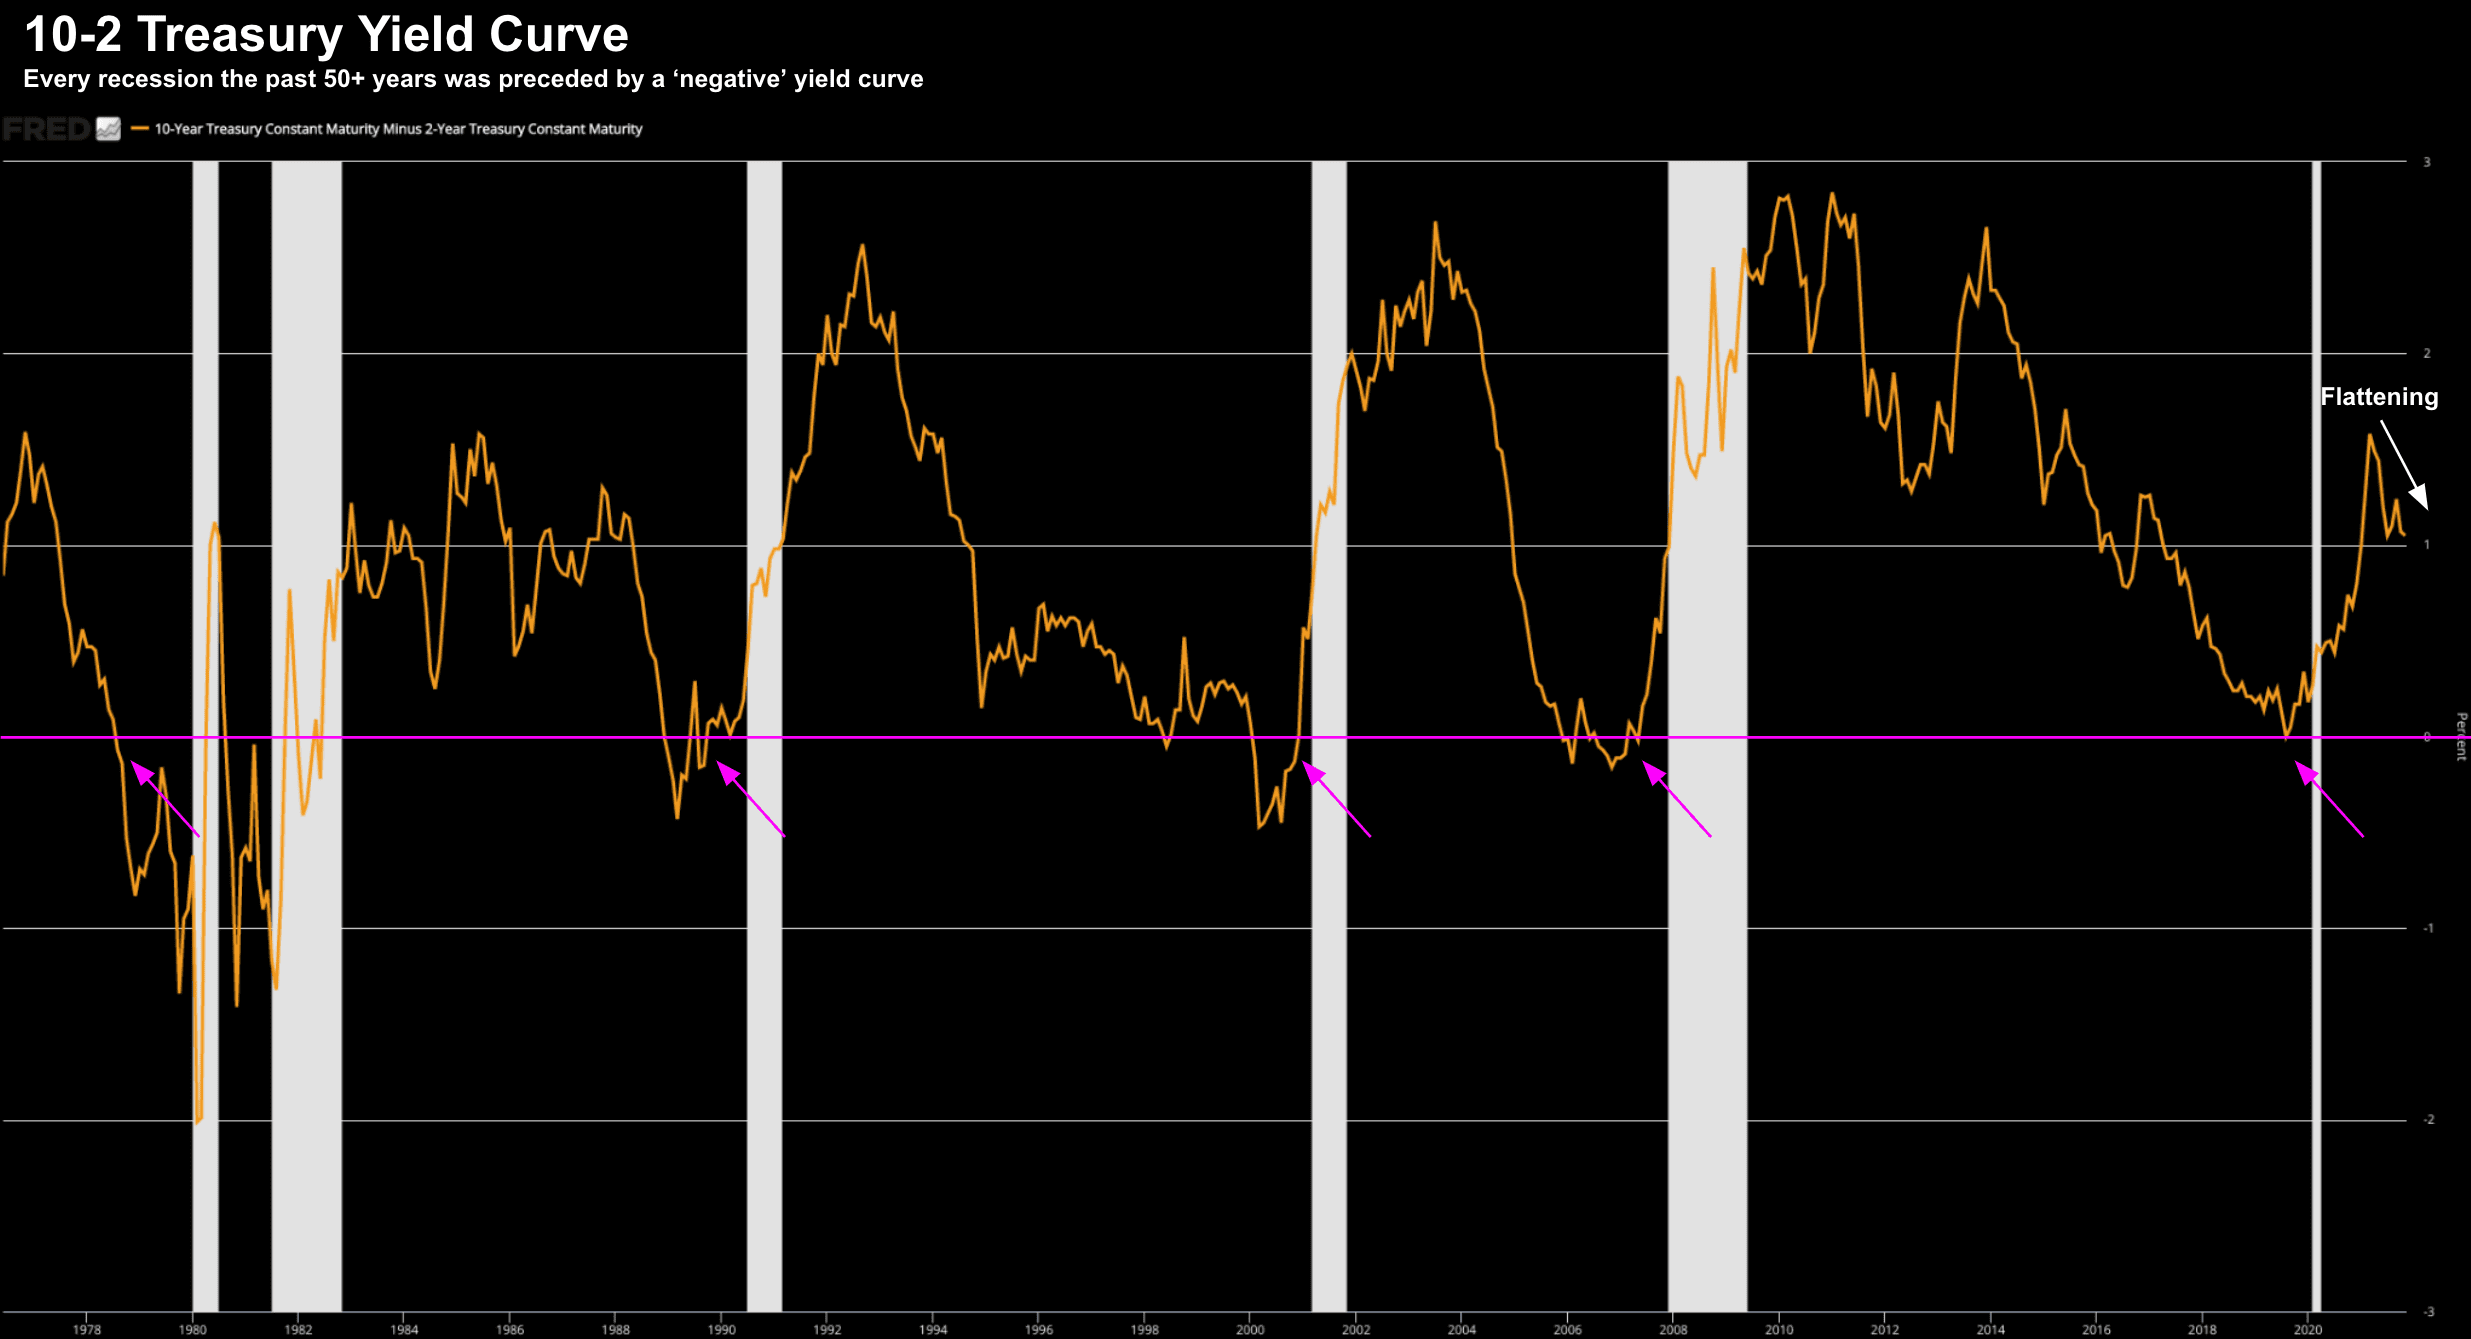
#4. 10/2-Year Yield Curve
The 10/2-Year Yield Curve is probably one of the more widely cited financial indicators of any recession risk.
And for good reason!
Every recession over the past 50 years was preceded by a negative sloped curve.
That is, the yield on the 10-year treasury falls below that of the 2-year.
Nov 12 2021
Highlighted are the past 8 recessions from 1980. In pink is the 0% level.
As you can see, approximately 12-18 months after the 10-2 Year yield curve went below zero – a recession followed.
(Note: the yield curve barely went negative in August 2019 – which saw me write a post "Start Your Recession Clocks for 2020")
Today the spread between these two durations is around 1.0% (well above the zero line).
However, we have seen this flatten sharply lately as expectations of a rate rise increase.
For now, there"s no risk of a near-term recession.
Bond markets are suggesting that growth will be dismal (based on the 5-Year TIPS) – and they are forecasting rate rises – but not a recession.
Let"s now turn to inflation…
Inflation Risks are Warranted…
Whilst I remain confident the economy will keep expanding (albeit modestly) – my confidence in inflation being "tamed" within 6-12 months is less so.
As I said the other day, we can blame the Fed for inflation.
Many will be quick to point the finger at severe supply-chain issues – but that"s not entirely incorrect.
It"s a component of the problem (i.e. less goods available opposite high demand) – but not the primary source.
Inflation (by definition) is a phenomenon best described as having excess money chasing too few available goods.
The Fed has flooded the economy (banks specifically) with cash.
For example, the rate of growth in the money supply (M2) the past 12 months has been more than 12% By way of comparison – the average growth rate the past 25+ years has been 6% per annum. Even during the financial crisis of 2008 – this trend barely altered course.
But look at what we have seen post COVID… money supply has exploded.
Net result: an incremental $4 Trillion added to M2 money supply.
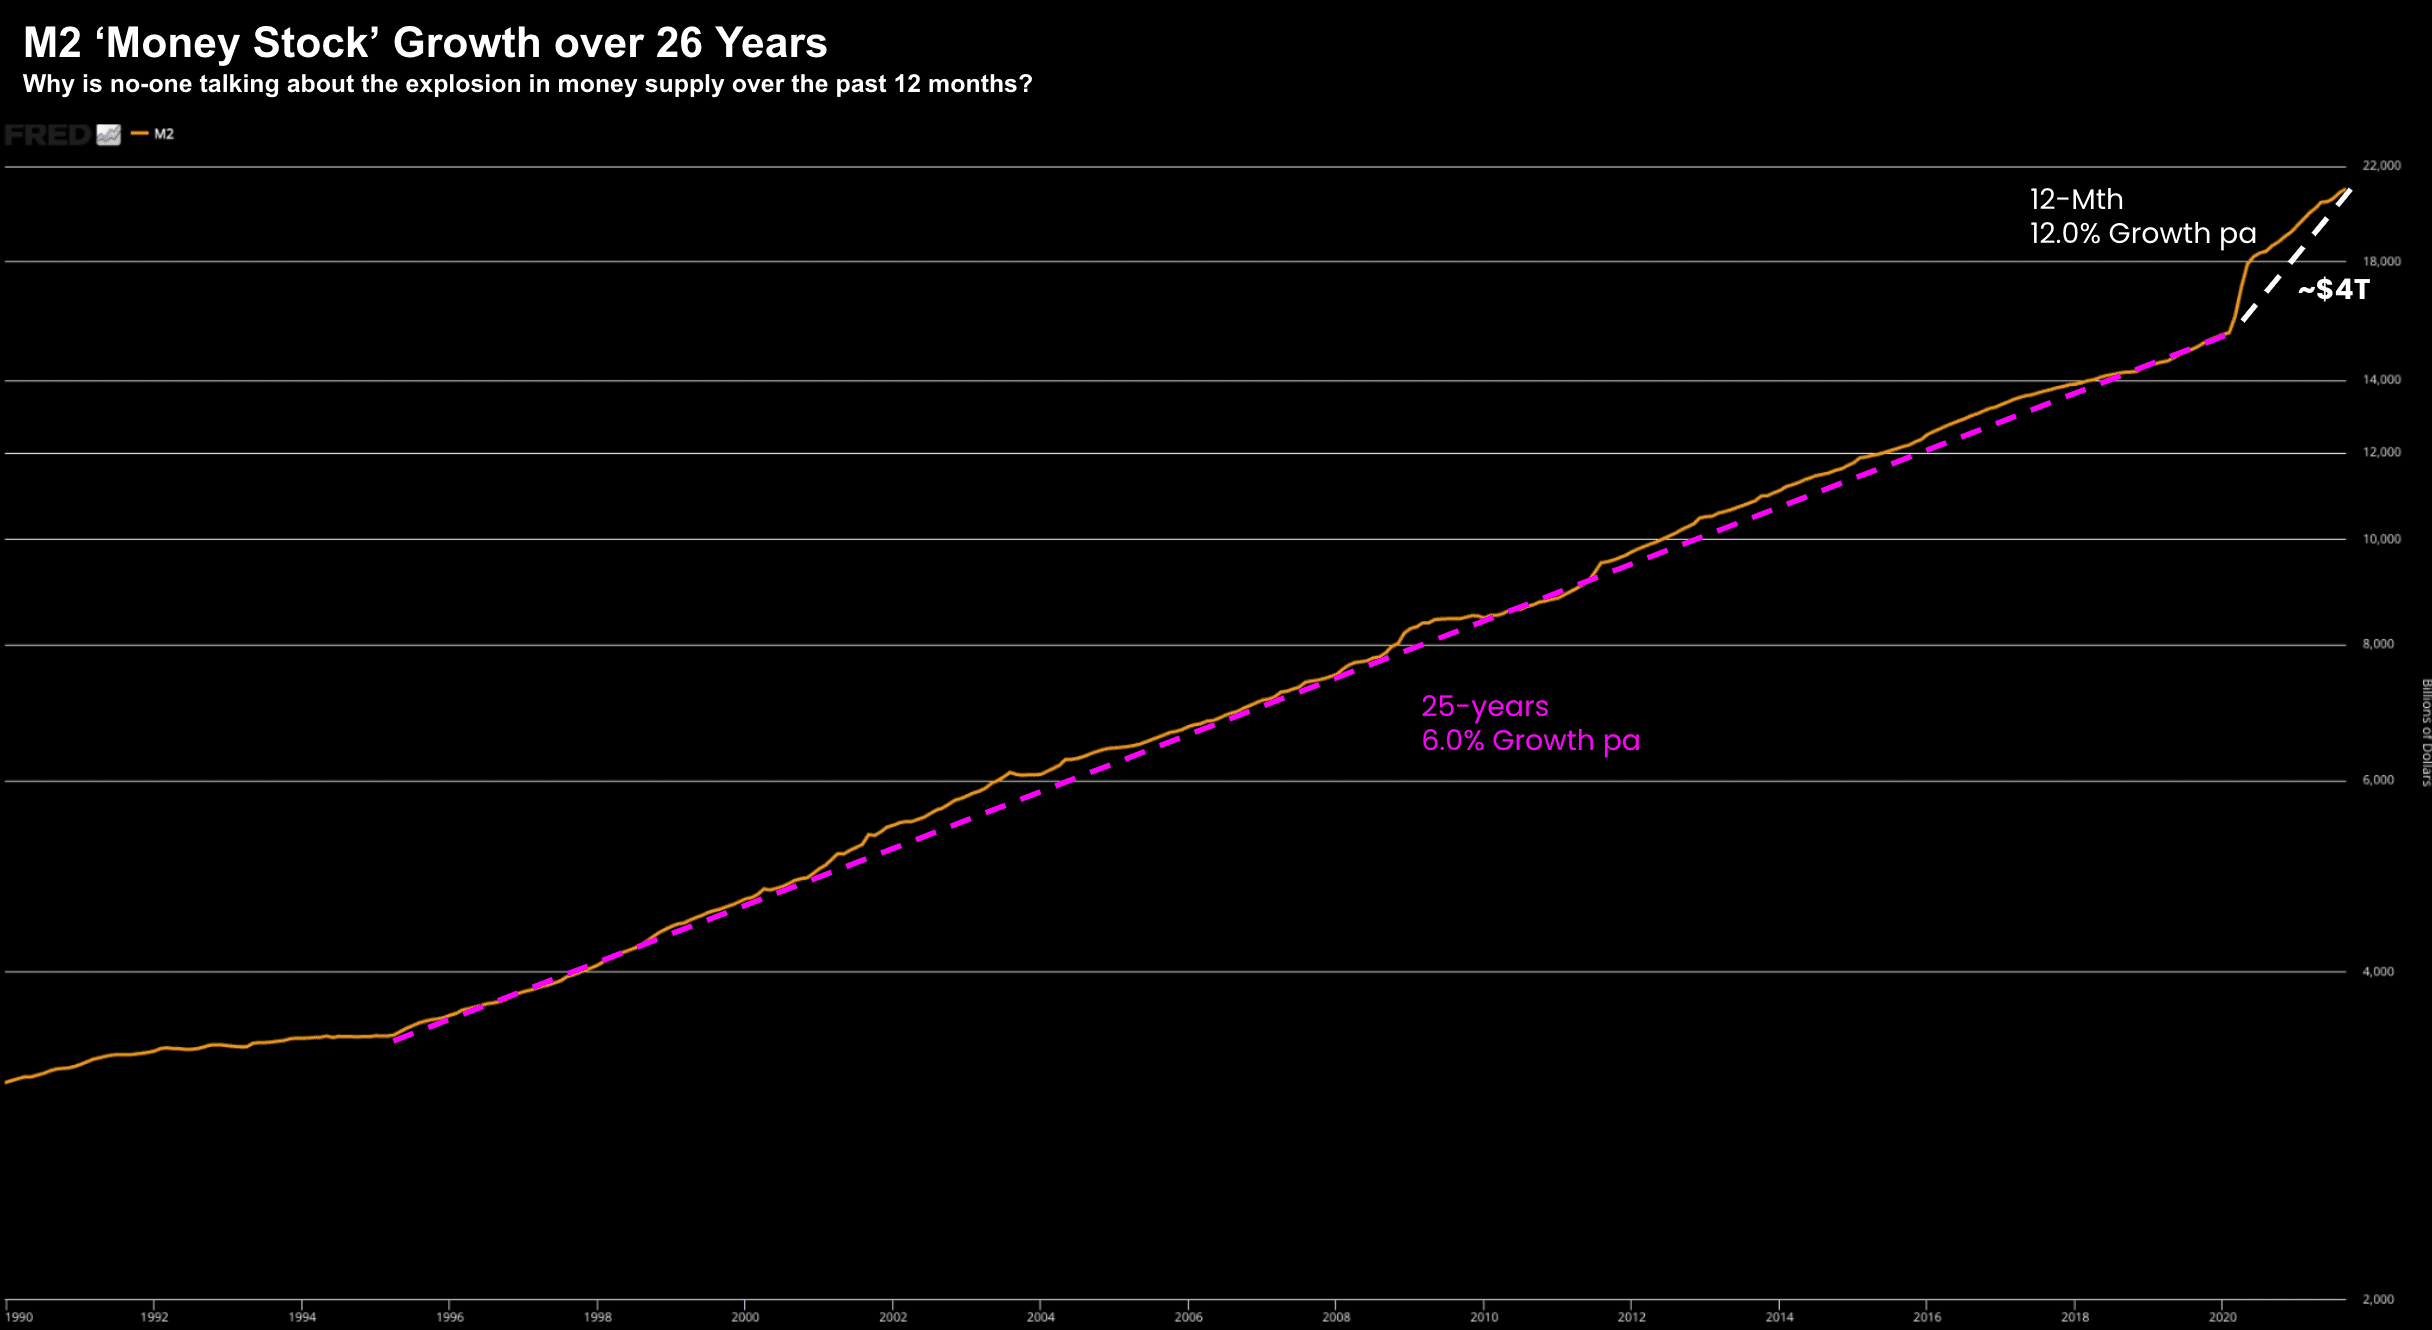
Nov 12 2021
Here"s the thing:
Very few are talking about this. Why?
And how often (if ever) do you see this chart offered by the Fed as part of their statements?
You won"t… as it"s the white elephant in the room.
Question: where does the (new) $4 Trillion go?
Does it simply evaporate and not get spent?
Because today that money finds a home across consumer retail, checking and savings accounts.
To be clear, it was right of the Fed to act when COVID first struck – as the government forced businesses to shutter.
There would have been a wave of bankruptcies (and a credit crisis) without their decisive action.
And if you look at my four key financial indicators above – they were starting to spike. There was an imminent crisis of liquidity.
Demand for money was high.
Job well done (at the time).
But here we are – the economy is moving in the right direction (in part) – but the Fed continues with the same "emergency-level" policy response"?
This will prove to be a mistake.
My view is unless the Fed starts to reduce money supply asap – higher inflation will be the result.
But as we know – the Fed sees no need to reduce money supply.
Note: "tapering" is still adding to the money supply – they are just adding money at a slower rate.
Sadly for consumers – the Fed"s lack of timely action will result in inflation for longer – meaning consumers will wear the entire cost (not the Fed).
That cost will be on the supermarket shelves, at the gas pump, rent prices… you name it.
However, there is a way to capitalize…
A Play on Higher Inflation
If you agree with my premise than inflation is likely to here for "longer" than what most economist"s expect – this is the play:
Russell 2000 ETF IWM.
As a preface, assets like real-estate, commodities and stocks will do well if inflation is not contained.
Stocks have a proven long-term relationship to inflation.
However, what has a very high correlation to inflation is the Russell 2000 index — a benchmark for the small-and-midcap sectors.
Let"s take a look at the chart:
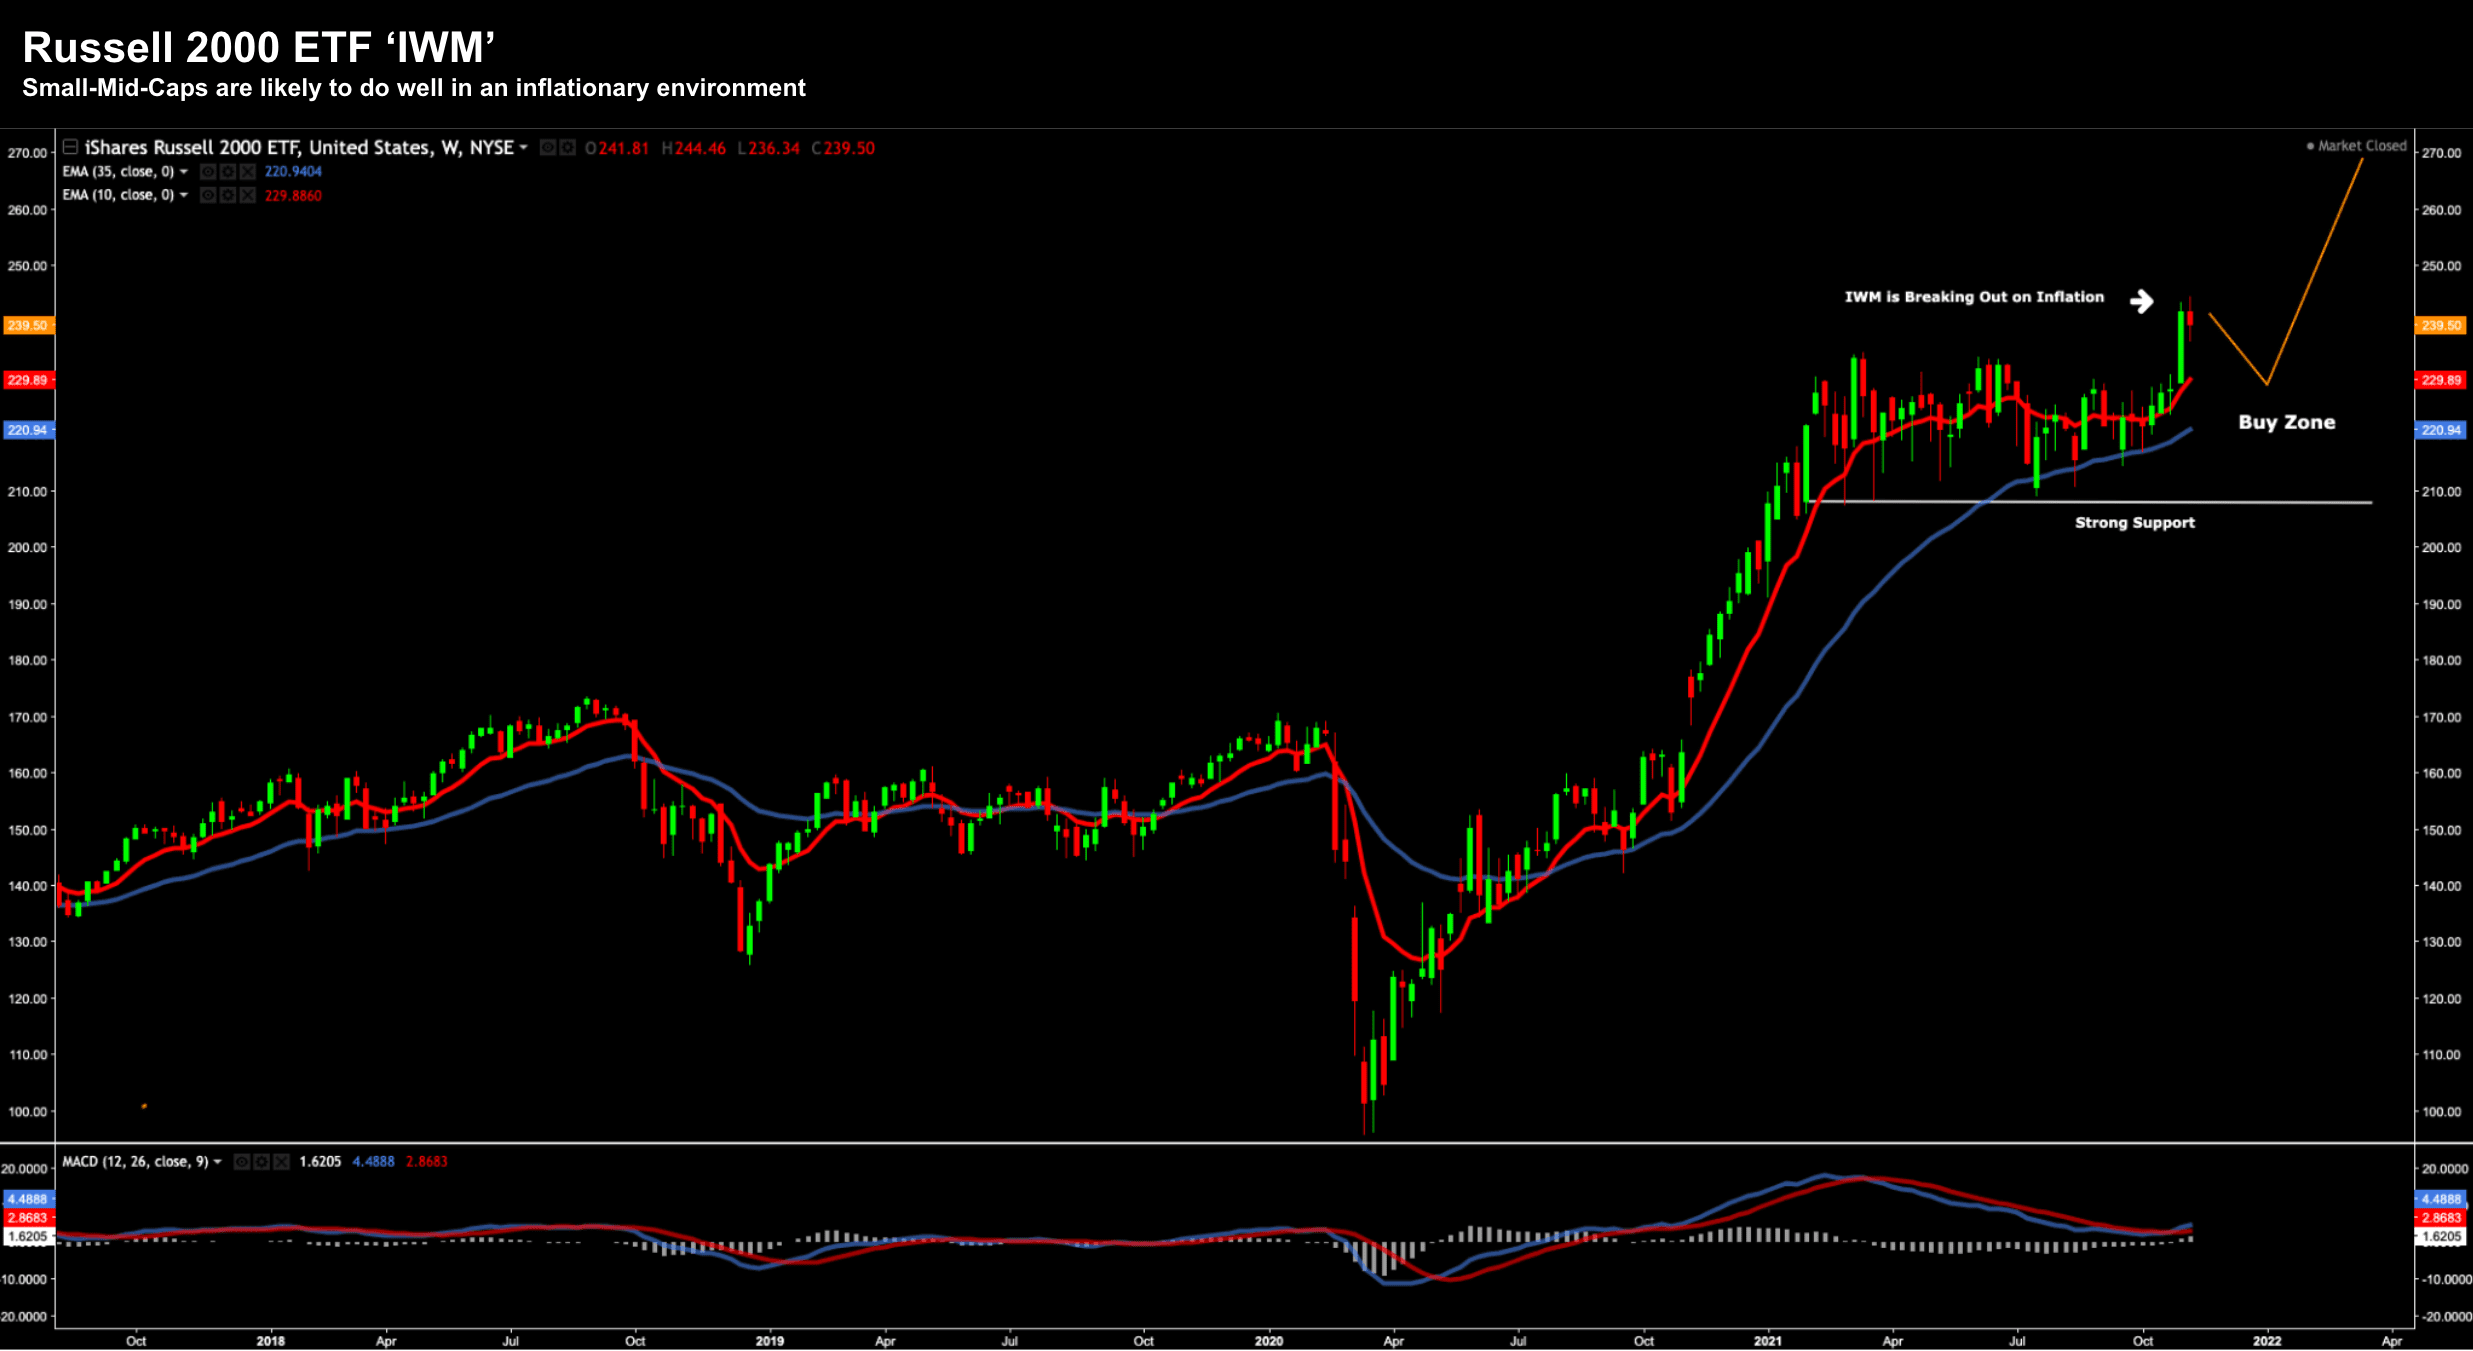
Nov 12 2021
This index surged on news of higher inflation… and for the most part has held those gains.
Technically, the IWM has broken out of a tight trading range from January 2021.
For example, as the broader market surged 25% this year (mostly led by tech), the IWM lagged.
But what we are now seeing is the switch to value.
In other words, lower multiple names (i.e. small-to-mid caps) are being sought as they represent greater upside (or risk/reward) than what has out-performed the past 12 months.
I have made IWM a portion of my own portfolio (5%) as I expect this ETF to outperform.
If you can add this ETF anywhere around $220 – I think it is set up well for this environment.
Putting it All Together
From mine, stocks are not worried about the negative consequences of any future Fed tightening.
As I wrote two weeks ago – stocks were given a "green light" from Jay Powell.
What"s more, we also know that every recession is preceded by two things:
(1) higher real interest rates (ie. closer to ~3%); and
(2) a negatively sloped yield curve.
Neither are risks in the foreseeable future.
Overlay that with the strength we see with corporate profits… things bode well for equities despite valuations.
In closing, expect unwanted inflation as the Fed acts like a "drunk driver speeding through a school zone"
At some point there will be an accident… but not yet.
Credit spreads are very tight – as the system is awash with liquidity.
Bottom line: risk assets are headed higher until the Fed recognizes the elephant in the room.