Rate Hike History Lesson: Bottoming is a Process
- What happened to the market during the last aggressive tightening / high inflation path?
- Why I"m not convinced the lows are in for 2022
- Recession risks are real and rising with a "stagflationary cocktail"
With the Fed set to raise rates as much as seven times this year – how safe is it to meaningfully increase your exposure to stocks?
Is there more downside to come? And is the bottom for 2022 now in?
These questions (among others) are top of mind for most readers.
However both are difficult to answer.
For example, what is your own risk tolerance and timeframe?
The shorter your lens – the lower the chance of investing success.
And are you comfortable with stocks swinging as much as 20% to 30% in short timeframes?
Some aren"t.
It"s impossible to know what the market could do on any given day, week or month. However, over time markets move higher… giving you a far greater probability of success.
History shows us that.
Now in uncertain times (like today) – you need the "hands of a surgeon" to skillfully attempt timing precise lows and highs if trading over days and weeks.
I can"t do it.
And as participants try to continually handicap such things as:
- a war in Ukraine;
- inflation levels not seen since the 1980s;
- oil price well above $90;
- slowing economic growth;
- supply chain snarls;
- slowing earnings growth and margin pressure;
- at least seven rate hikes this year; and
- a large reduction in the Fed"s balance sheet (quantitative tightening)
… stocks will swing wildly in both directions.
Obviously this calibration process doesn"t happen over the course of a few days or weeks.
This is precisely why stocks will continue to be volatile for the balance of this year and most likely next.
The easy money of 2020 and 2021 has been made.
Ultra-easy monetary conditions are now finished therefore the game has changed.
The goal posts have moved.
And for this we try to learn from history…
For example, during the late 1970s and early 1980s we had both double-digit inflation opposite an aggressive rate hike cycle.
Fed Chair Paul Volcker pushed nominal rates as high as 19% to regain price stability (i.e., inflation around 2-3%).
However, only once nominal rates were above that of inflation (meaning real rates were positive) – inflation levels started to ease.
Today we find consumer price inflation tracking around 8% (likely to go higher) – with nominal rate at just 0.25%
That"s inflationary.
And if we assume another 6 rate hikes by year"s end – nominal rates will be about 1.75%.
I"m willing to bet inflation will be a lot higher than that – meaning real rates will still be negative.
What"s more, adding an incremental $4 Trillion plus (QE) to the Fed balance sheet is also inflationary.
Put simply, making more money available (whilst chasing fewer goods) has pushed the price of everything up.
Stocks. Houses. Rent. Wages. Fuel.
You name it.
In other words, this Fed-induced problem isn"t going away in 2022… and probably not 2023.
Tonight"s missive seeks to address the question of what happens to stocks when the Fed tries to use their blunt tool of rate hikes to ease inflation.
And whilst the Fed would love a "scalpel" to address the list of problems outlined above – what they have is more like a "snow shovel". That is, the Fed control the price and quantity of money.
Put another way, they cannot control how it"s used.
Let"s revisit the late 1970s and 1980s… and see what we can learn.
Revisiting Volcker"s Rate Hikes
The 1970"s was a horrible time for both the economy and the market.
Over the course of a decade – market returns were very low.
For example, January 1 1970 the S&P 500 traded at 90.31
10-years later the market advanced to just 110.90 – which implies a CAGR of only 2.08% for a decade (exc. dividends).
The 50-year CAGR for stocks (inclusive of dividends) is closer to 10.5%
Towards the end of the 1970s – the economy struggled with high inflation combined with slowing (and recessionary) economic growth.
For example, below is the annual US GDP levels over that period:
- 1979 – $6.82 Trillion
- 1980 – $6.82 Trillion (0% growth)
- 1981 – $6.91 Trillion (1.3% growth)
- 1982 – $6.81 Trillion (-1.4% growth)
- 1983 – $7.34 Trillion (7.8% growth)
Faced with damaging levels of double-digit inflation – Volcker had no choice but to radically raise interest rates.
Powell faces a similar problem today.
As a complete aside, I remember my parent"s taking out a mortgage of levels near 19%.
Could you imagine that today if you borrowed something like $500,000+? (more on this in my conclusion)
This calculator tells me that"s a monthly payment of ~$7,944 over 30 years.
Again, ultra-easy money for too long goosed up all asset prices (e.g., where people are forced to pay historically high prices) – but are now looking at paying a much higher rates of interest)
Now the chart below shows both nominal (orange) vs real interest rates (purple – adjusted for inflation) from May 1979 through October 1983
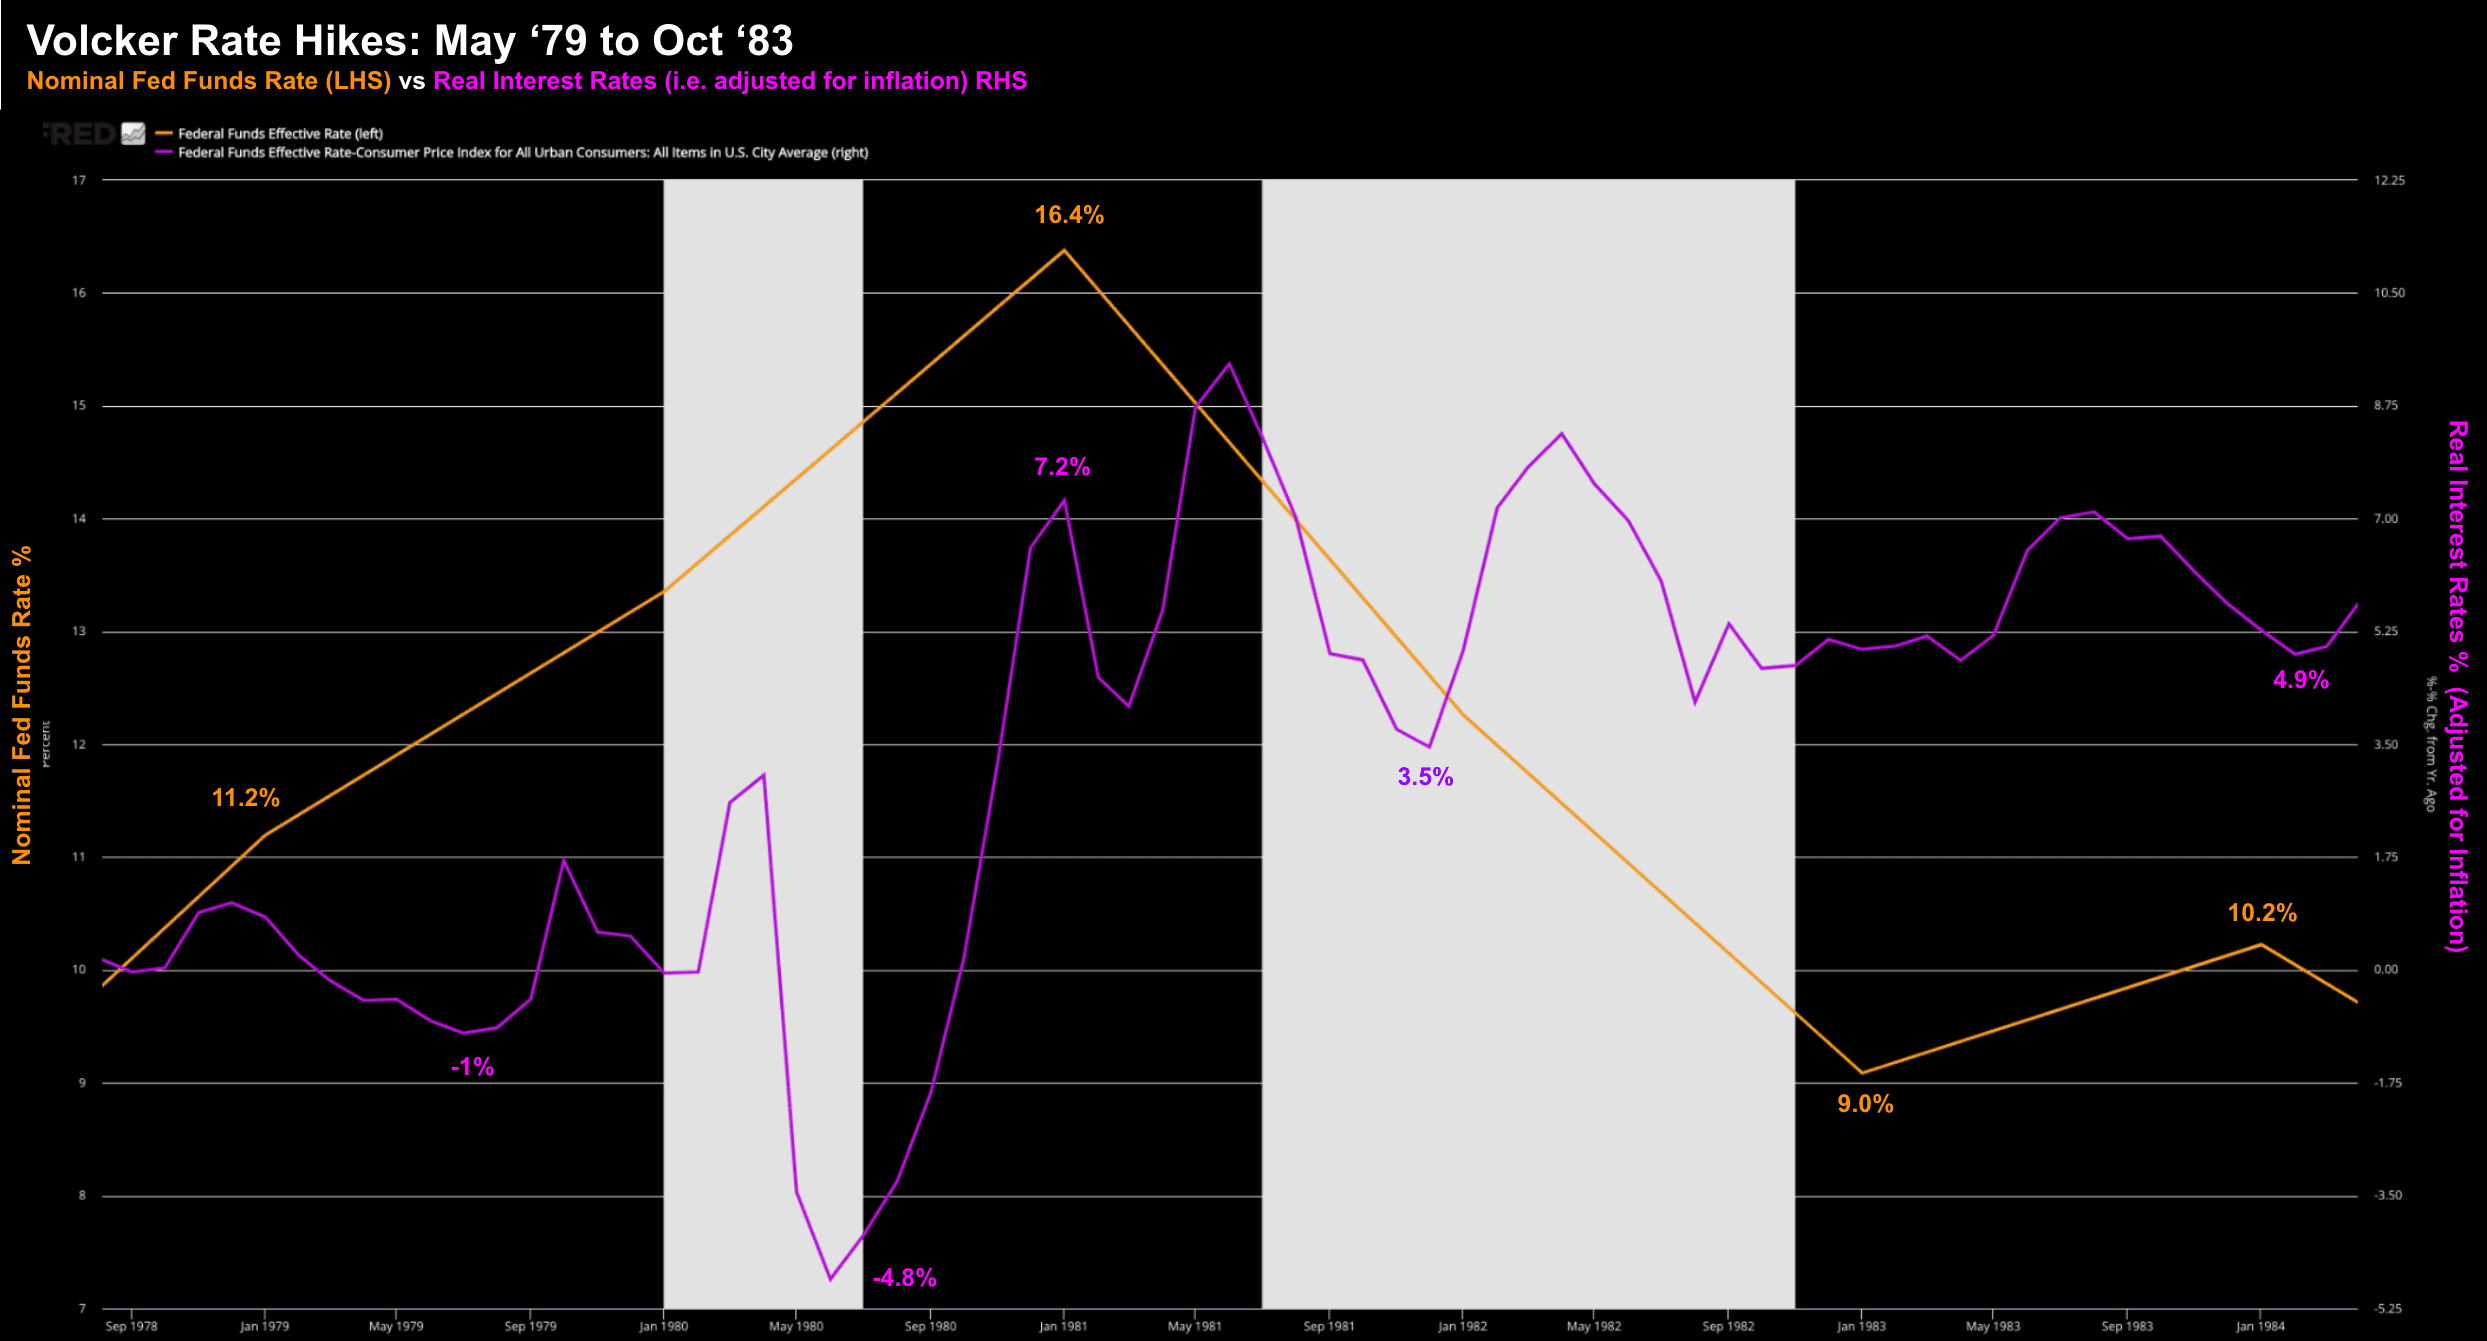
The nominal effective Fed funds (orange) rate went from ~10% early 1979 to 16.4% in January 1981.
The pink line shows what real interest rates (i.e., adjusted for consumer price inflation)
For example, in June 1980, real interest rates were negative 4.80%
Negative real rates are highly inflationary.
Your cash is effectively trash (see this post from September). Investors are forced up the risk curve to seek returns elsewhere (e.g., stocks and property)
Now with rates so deeply negative – the Fed were doing little to slow the rate of inflation (the case today)
However, as inflation levels started to moderate, real rates climbed.
And as real rates become more attractive – the demand for money also increased.
And this is what I have said the Fed needs to do today; i.e. make money more attractive whilst reducing its supply.
It"s the only way inflation comes down.
So how did Volcker"s aggressive tightening monetary policy impact stock prices during that 4.5 year period?
S&P 500 Performance 1979 to 1983
Before I get to the chart below – let me offer this:
Market bottoms are a process.
They don"t happen over days and weeks… they can take months and years.
And I expect something similar today.
Below we see the exaggerated ebbs and flows of the S&P 500 over this period:
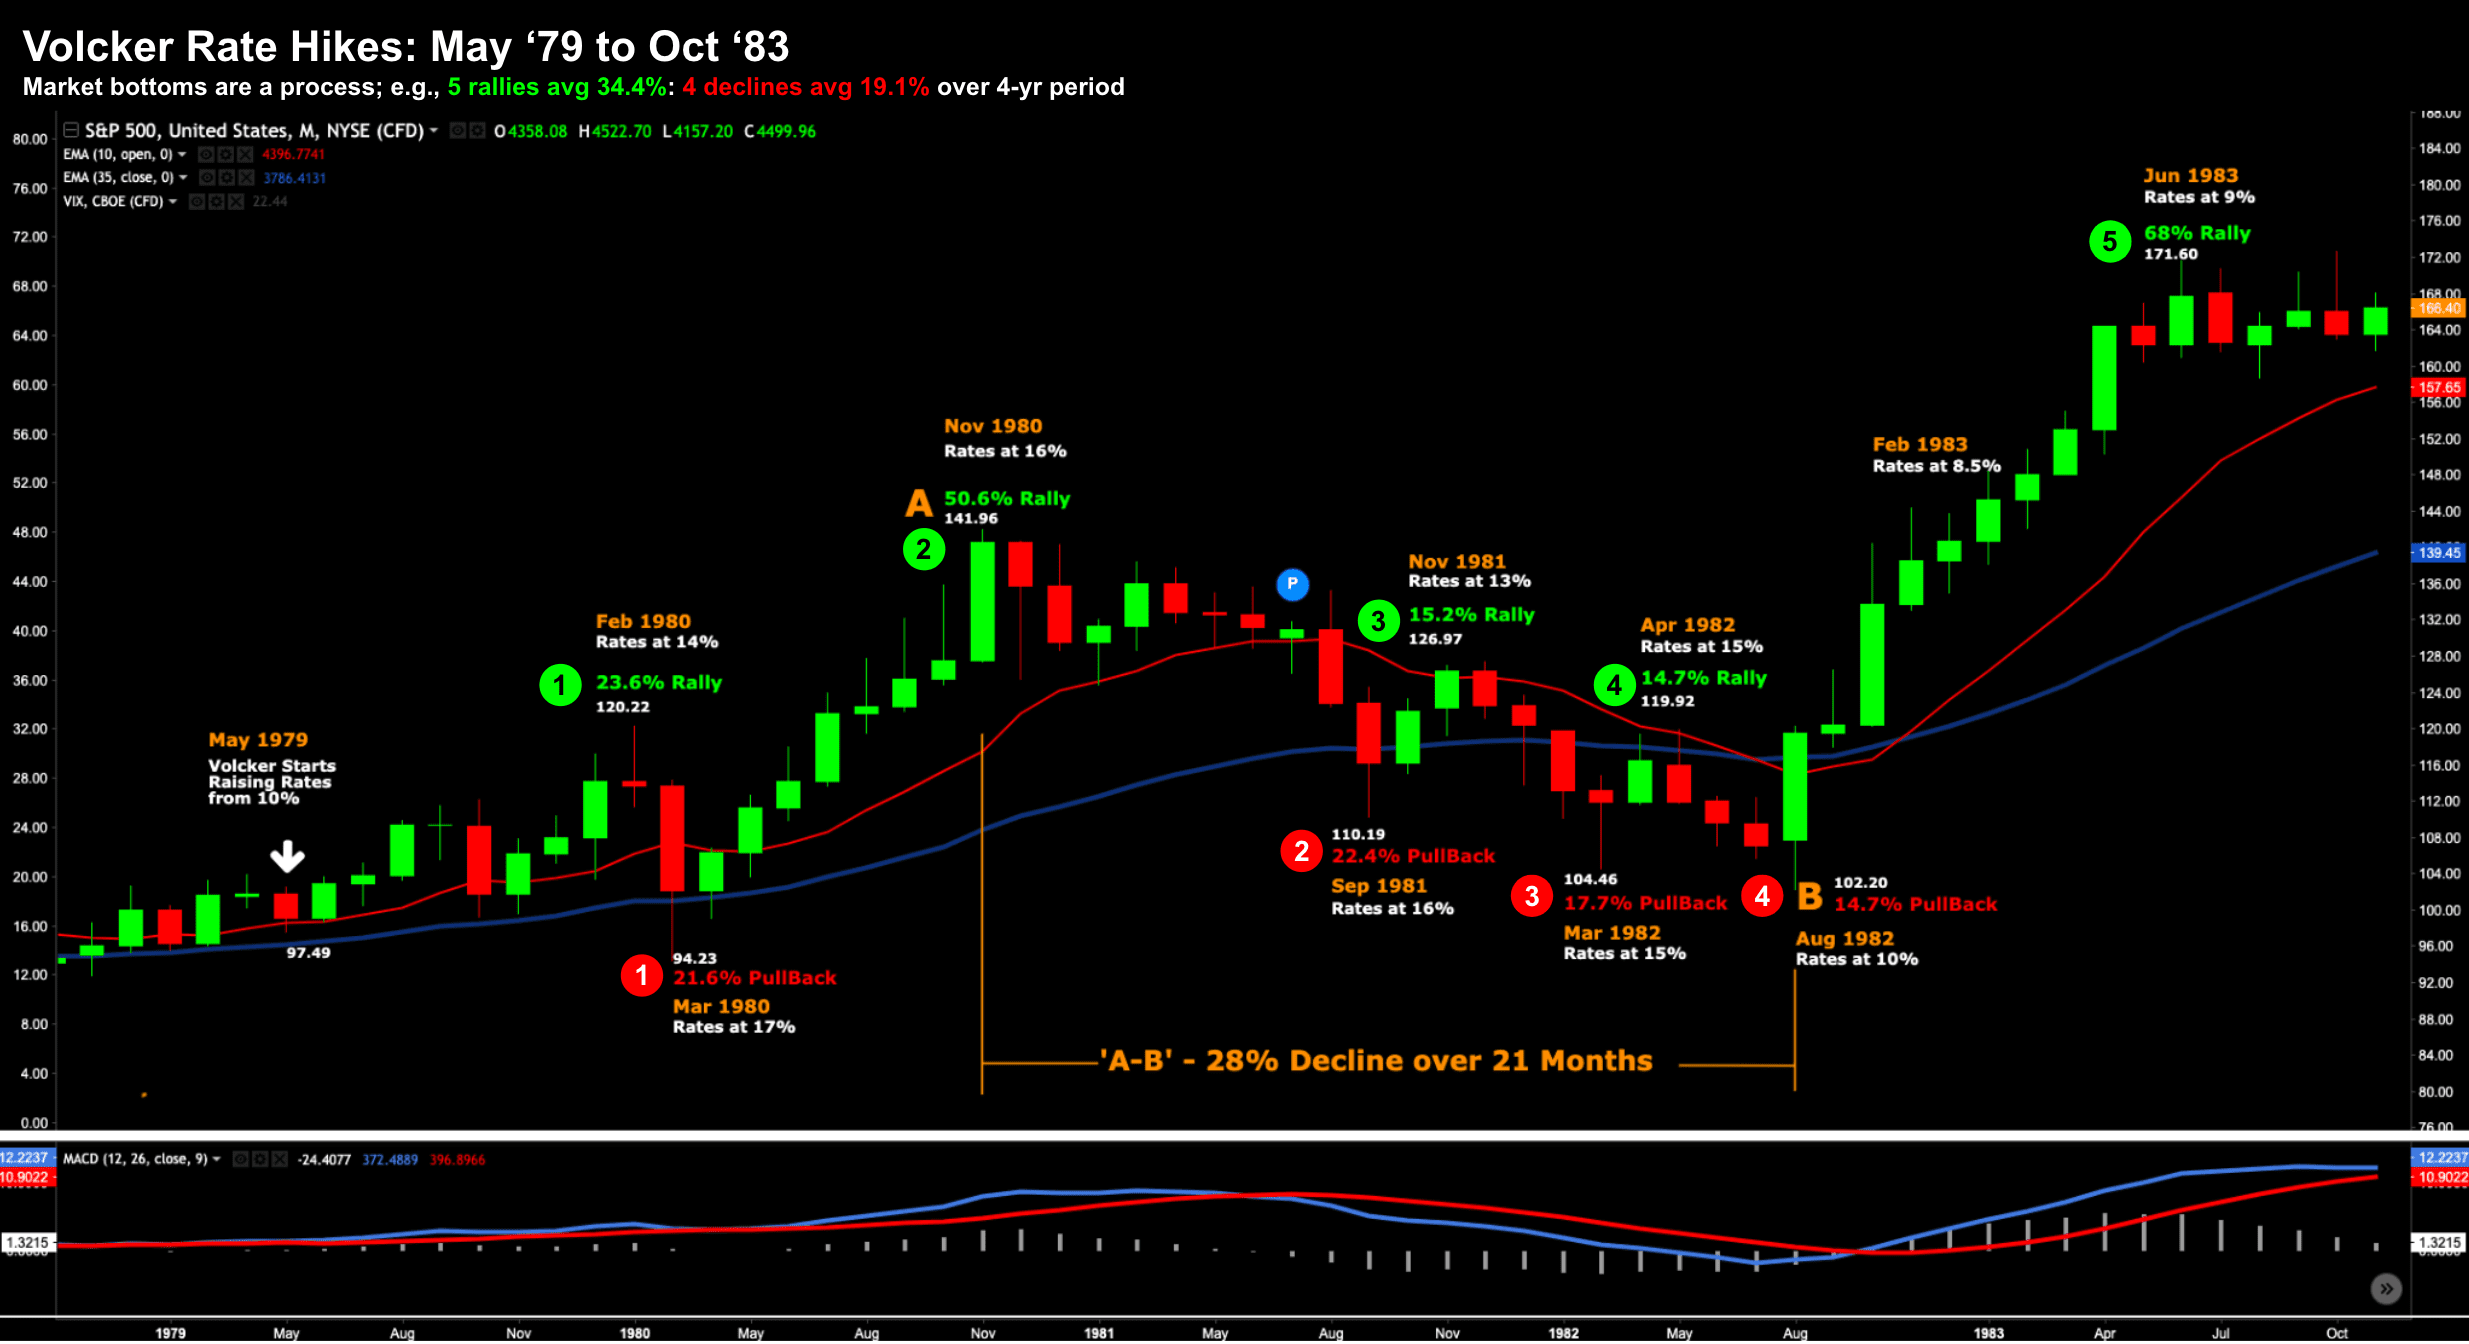
Here we can see the sharp series of rallies and declines over this period.
Many of these coincided with both rate hikes and rate cuts.
Let"s start with the 5 market rallies (labelled in green):
- #1: May 1979 to Feb 1980 (9 weeks) +23.6%
- #2: Mar 1980 to Nov 1980 (8 weeks) +50.6%
- #3: Sep 1981 to Nov 1981 (3 weeks) +15.2%
- #4: Mar 1982 to April 1982 (3 weeks) +14.7%
- #5: April 1982 to Jun 1983 (11 weeks) +68%
The average length of these rallies was 6.8 weeks; where the average gain was 34.4%
Let"s now look at the 4 large corrections (labelled in red)
- #1: Feb 1980 to Mar 1980 (2 weeks) -21.6%
- #2: Nov 1980 to Sep 1981 (10 weeks) -22.4%
- #3: Nov 1981 to Mar 1982 (4 weeks) -17.7%
- #4: Apr 1982 to Aug 1982 (4 weeks) -14.7%
The average length of these corrections was 5 weeks; where the average loss was 19.1%
My first observation is how volatile stocks were during this time over very short periods.
Put simply, they were trying hard to recalibrate a new denominator for stocks.
For example, stocks earnings are always the numerator. However the denominator is what those earnings cost (i.e., interest rates).
And when the denominator is going up… the net result is lower.
For example, if we look at the first sharp decline from Feb 1980 to Mar 1980 (where the market dropped 21.6% – rates went higher by 300 basis points (ie from 14% to 17%)
Volcker then eased rates from 17% to 16% from Mar 1980 to Nov 1980 – and the market rallied some 50.6% (rally #2)
That said, as Volcker held rates firm from Nov 1980 to Sep 1981 (around 16% nominal) – stocks proceeded to lose ground as growth stalled and earnings dropped. The S&P 500 pulled back about 22.4% over that time (note: the economy grew a paltry 1.3% that year)
Now when Volcker felt inflation was coming back to an acceptable level (1982) – cutting the nominal rate to 10% with a real rate of closer to 4.9% (i.e. inflation was around 5.1%) – stocks started to rally.
For example, from Aug 1982 through to Jun 1983 – stocks rallied some 68%.
What"s the takeaway here?
Bottoming is a process.
It doesn"t happen in a straight line.
During this ~4.5 year period, the market saw some extremely sharp rallies and declines.
But over the entire duration, the S&P 500 rallied from 97.49 to 171.60.
In absolute terms, that"s a gain of 76%
However, there was a 21 month period (i.e., Nov 1980 to Aug 1982) where the market lost 28%
If expressed as a CAGR (Compound Annual Growth Rate) over 4.5 years – that"s ~5.6%
Putting it all Together
I can"t tell you if the bottom is in for 2022.
If I were to guess – I would say no.
But it"s a guess…
I am not convinced the market has fully priced in:
- how aggressive the Fed will need to be with rates;
- the impact of unwinding some $4 Trillion from their balance sheet (e.g., $100-200B+ per month); and
- the long-lasting the impact of sustained inflation on consumers / earnings
Yes, the market has priced in at least 6 further rate hikes this year (i.e. 25 basis points each meeting).
And it"s aware we have a "near-term" inflation problem.
But is it also assuming inflation will come under control reasonably fast?
And I hope it does. It has to.
For example, today"s consumer sentiment index is the lowest level we have seen since 2009.
In addition, pending home sales dropped 4.1% in Feb MoM; and down 5.4% from a year ago. It"s the fourth straight month of declines.
What"s going on?
It"s simple – rates are more than 100 basis points higher than one year ago. The median US monthly mortgage payment is now ~20% more than a year ago.
And it"s only going higher if we are to bring inflation down.
If you then add in fuel prices up ~40%; food prices up 10-20%; rent prices up ~20%…. it"s not hard to understand why consumer sentiment is the lowest since the great recession.
So I ask you – what impact will that have on growth given the consumer spend is 70% of US GDP?
And do you think the Fed can engineer a "soft landing" for stocks (and the economy) as they look to raise rates above that of inflation?
I don"t think so.