“Bits vs Bytes” for Big Tech Earnings
- Google and Microsoft Rip Higher
- Amazon and Apple Hit by Supply-Chain Issues
- Yield curve flattening which tells me rate hikes are coming
The collective market caps of Google, Microsoft, Amazon, Facebook and Apple are north of ~$9 Trillion.
To put that into perspective, the entire sum of the S&P 500 is ~$38 Trillion
These 5 behemoths consist of almost 24% of the entire market.
Why does this matter?
My thesis is it"s been the surge in big-tech which has led the market higher the past 12 months…
If that"s true… and could also lead it lower (should it stumble)
And whilst Microsoft and Google blitzed earnings this week – it was not the same for Apple and Amazon
Apple and Amazon Miss
I provided a summary of Google and Microsoft"s in my most recent post – which exceeded even the most optimistic forecasts.
For example, net margins, cash-flow, revenue growth were all exceptional.
Both stocks ripped higher the following day…
Google by ~5% to challenge $3,000 per share… and Microsoft by ~4%
These prices are deserved.
Expensive? Absolutely.
But like almost everything in life… you pay for quality.
Today was the market"s next big litmus test… Apple and Amazon.
I felt if they could replicate what we saw from Google and Microsoft – the market would be "off to the races"
Unfortunately both companies disappointed.
From mine, this was a story of "bits" vs "bytes"
Let me explain…
For example, "bits" in the sense of supply chain and various related sensitivities (e.g. higher wage costs and labor shortages for Amazon – costing them $2B; and chip-shortages for Apple – costing them $6B on the bottom line).
And both said these impacts will be greater in Q4.
But when you consider the "bytes" companies (i.e. Google and Microsoft) – "supply chain" and "labor" cost pressures were absent.
And whilst Google may have had some issues on sourcing components for hardware – their scale is minuscule compared to Apple.
For example, with the release of the Google Pixel 6 last week – they"re only planning to sell 7M units over 12 months.
Apple on the other hand look to move at least 80M+ iPhones each year (not to mention its Macs, Macbooks, iPads and other wearables)
When you frame it this way – you can see the contrast in the earnings stories (and pressures).
That said, I thought both Apple and Amazon delivered stellar quarters.
However, expectations were already sky-high (evidenced by their extended multiples)
Let"s start with Apple (my second largest holding in my portfolio)
Apple: $6B Supply Chain Hit
The other week I added more Apple to my portfolio at a price of around $138.
I think a price anywhere below $138 is value for the long-term.
The stock had dipped to test its 35-week EMA and I was happy adding some more (I will share the chart shortly).
But let"s start with the numbers…
Expectations were high coming into today"s print…
For example, with the stock trading down ~3% after-hours, it"s worth bearing in mind the company"s overall revenue was still up 29%
What makes this incredible is the sheer size of the revenue…. over $83B in one quarter.
To help dimension this – Starbucks (who we also heard from today) will do revenue of less than $30B for the entire year (and they have been at this game for 50-years)
Apple will almost exceed that in just services revenue in two quarters – which was a business doing $0 revenue only 5 years ago.
That"s the "bit-flip" Apple can drive when you have over 1B affluent and sticky customers.
Okay… let"s take a minute to look at the numbers:
- $83.36 billion vs. $84.85
billion estimated, up 29% year-over-year - EPS: $1.24 vs. $1.24 estimated
- iPhone revenue: $38.87 billion vs. $41.51 billion estimated, up 47% year-over-year
- Services revenue: $18.28 billion vs. $17.64 billion estimated, up 25.6% year-over-year
- Other Products revenue: $8.79 billion vs. $9.33 billion estimated, up 11.5% year-over-year
- Mac revenue: $9.18 billion vs. $9.23 billion estimated, up 1.6% year-over-year
- iPad revenue: $8.25 billion vs. $7.23 billion estimated, up 21.4% year-over-year
- Gross margin: 42.2% vs. 42.0% estimated
Now if we add $6B – the market would be doing "cartwheels".
But for me, the two highlights are:
- Services Revenue: $18.28 billion vs. $17.64 billion estimated, up 25.6% year-over-year
- Gross Margin: 42.2% vs. 42.0% estimated
Whilst hardware sales are very important (they really drive the end-to-end ecosystem) – Apple is transforming itself into a high-margin services business.
Yes, it helps to produce exceptionally high-quality hardware and operating system… but marry that with services and it"s a compelling story (one which many are trying hard to emulate)
However, this is incredibly hard to do.
It takes many years (and that"s if you can do it) For example, Samsung has been trying to emulate this model for a decade.
They can"t do it.
But look at the overall margin of the business… it"s 42.2%
Not only that… revenue across the group is growing at 29% year on year in a supply-chain constrained environment.
Tell me how many other companies you know that are achieving that (at that scale)?
This is why Apple commands a 27x forward PE…
And much like Google and Microsoft… it"s deserved.
Let"s take a look at the weekly chart (my preferred timeframe)
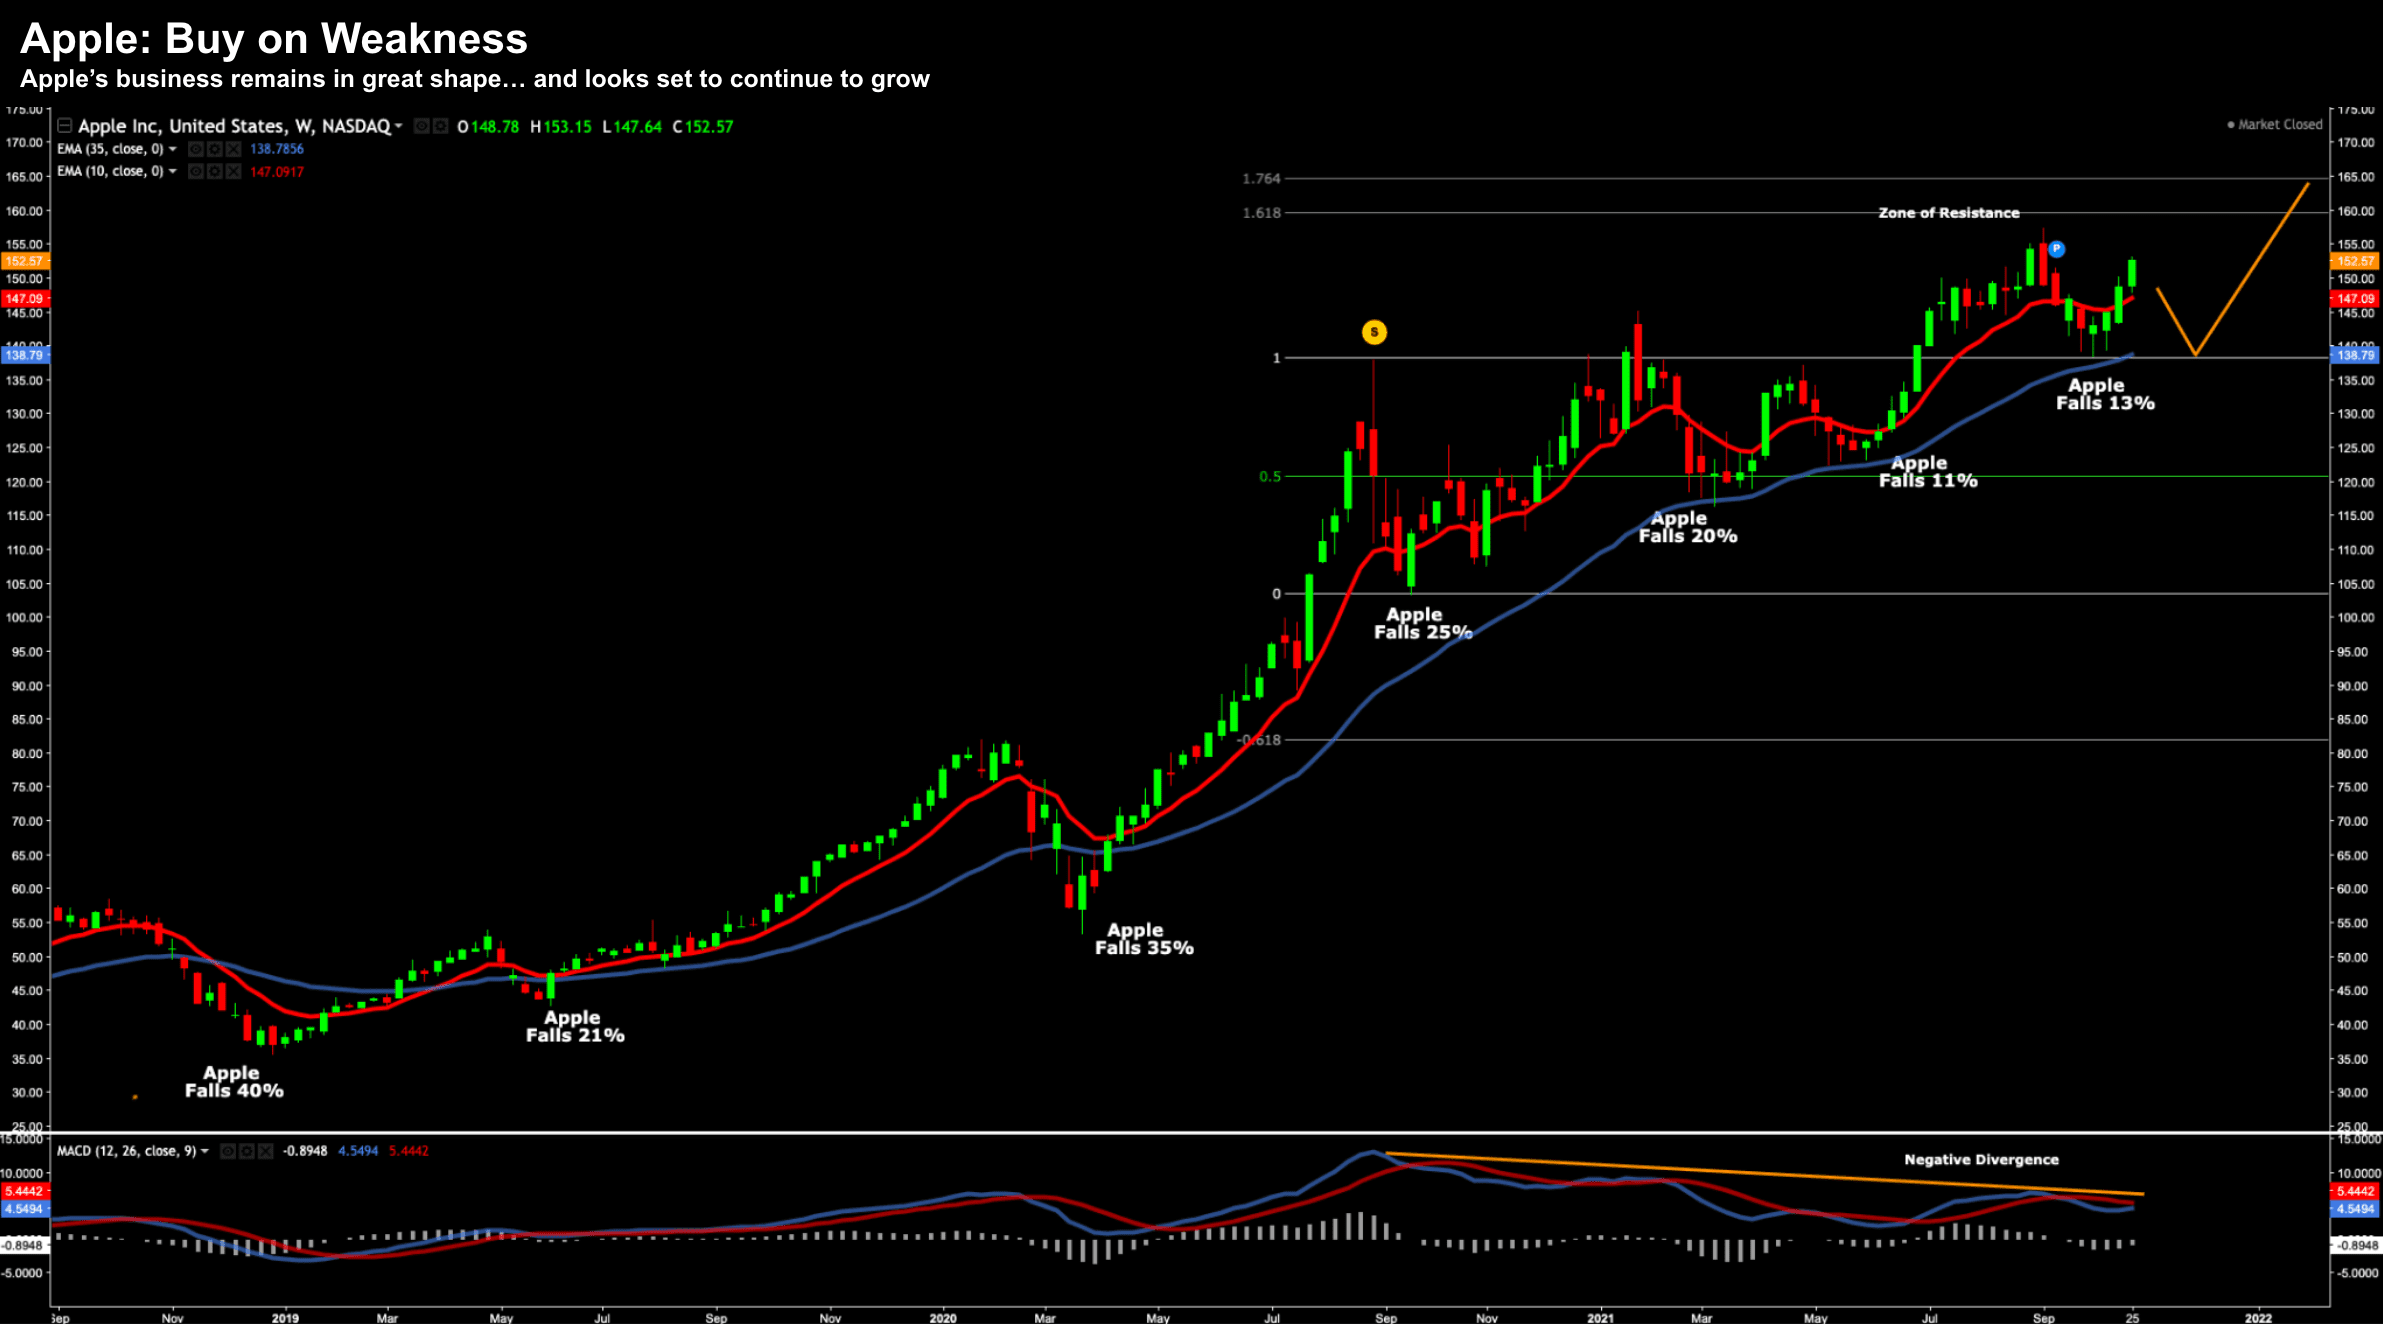
AAPL – Oct 28 2021
I shared this chart four weeks ago when I added to the name around $138
It"s likely Apple will pullback tomorrow – to trade somewhere between $146 and $147.
However, if you see the stock trade anything below $140, look to add to the name.
For example, take a look at the blue-line, the 35-week EMA
How many times have we seen it drift down to that level (typically opposite a "bad" quarter) – only to catch a bid.
Sometimes (not often) Apple will surprise to the downside.
And often weaker hands will panic.
But for me, the Apple story remains intact.
In fact, I think there"s something else brewing at Apple that we don"t know about.
I"ve been keeping a close eye on a few initiatives (e.g., via lodged patents and other things) – and I"m thinking we are going to hear something transformative next year.
If I have learnt one thing being in the tech-business for ~25 years… when Apple moves… they move with deliberate intent.
Amazon: Supply Chain and Cost Woes
Whilst Apple is my second largest holding (behind Google) – Amazon comes in at #4.
Microsoft sits at #3.
Amazon disappointed the market with its Q3 results – talking to cost pressures and supply-chain issues.
Higher wages cost them $2B extra last quarter; and will cost them an extra $4B in Q4.
That said, if higher costs means keeping their customer happy – Amazon will do it.
But this is also a cap-ex heavy phase for Amazon (and well telegraphed)… which often troubles the market.
However history shows once they move past this phase – it"s off to the races.
Let"s revisit their numbers:
- Earnings: $6.12 vs $8.92 per share expected
- Revenue: $110.81 billion vs $111.6 billion expected
- Amazon Web Services: Revenue Up 39% to $16.11 billion vs $15.48 expected; $4.88 billion in operating income (ie 30% margin).
- Q4 Revenue Guide: $130 billion and $140 billion, representing growth b/w 4-12%
- Q4 Earnings Guide: $0 and $3 billion (down from its operating profit of $6.9 billion in the year-ago period)
What"s interesting is if you remove the $4.88B in operating income from AWS – Amazon records a loss for the quarter.
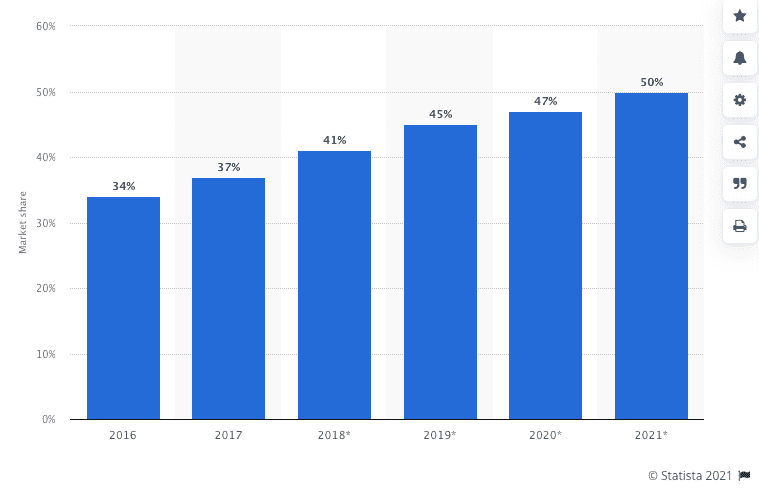
Almost 15% of Amazon"s total revenue came from AWS.
AWS leads the growing cloud infrastructure market with about 41% share in 2020, according to industry researcher Gartner.
Let"s look at the weekly chart:
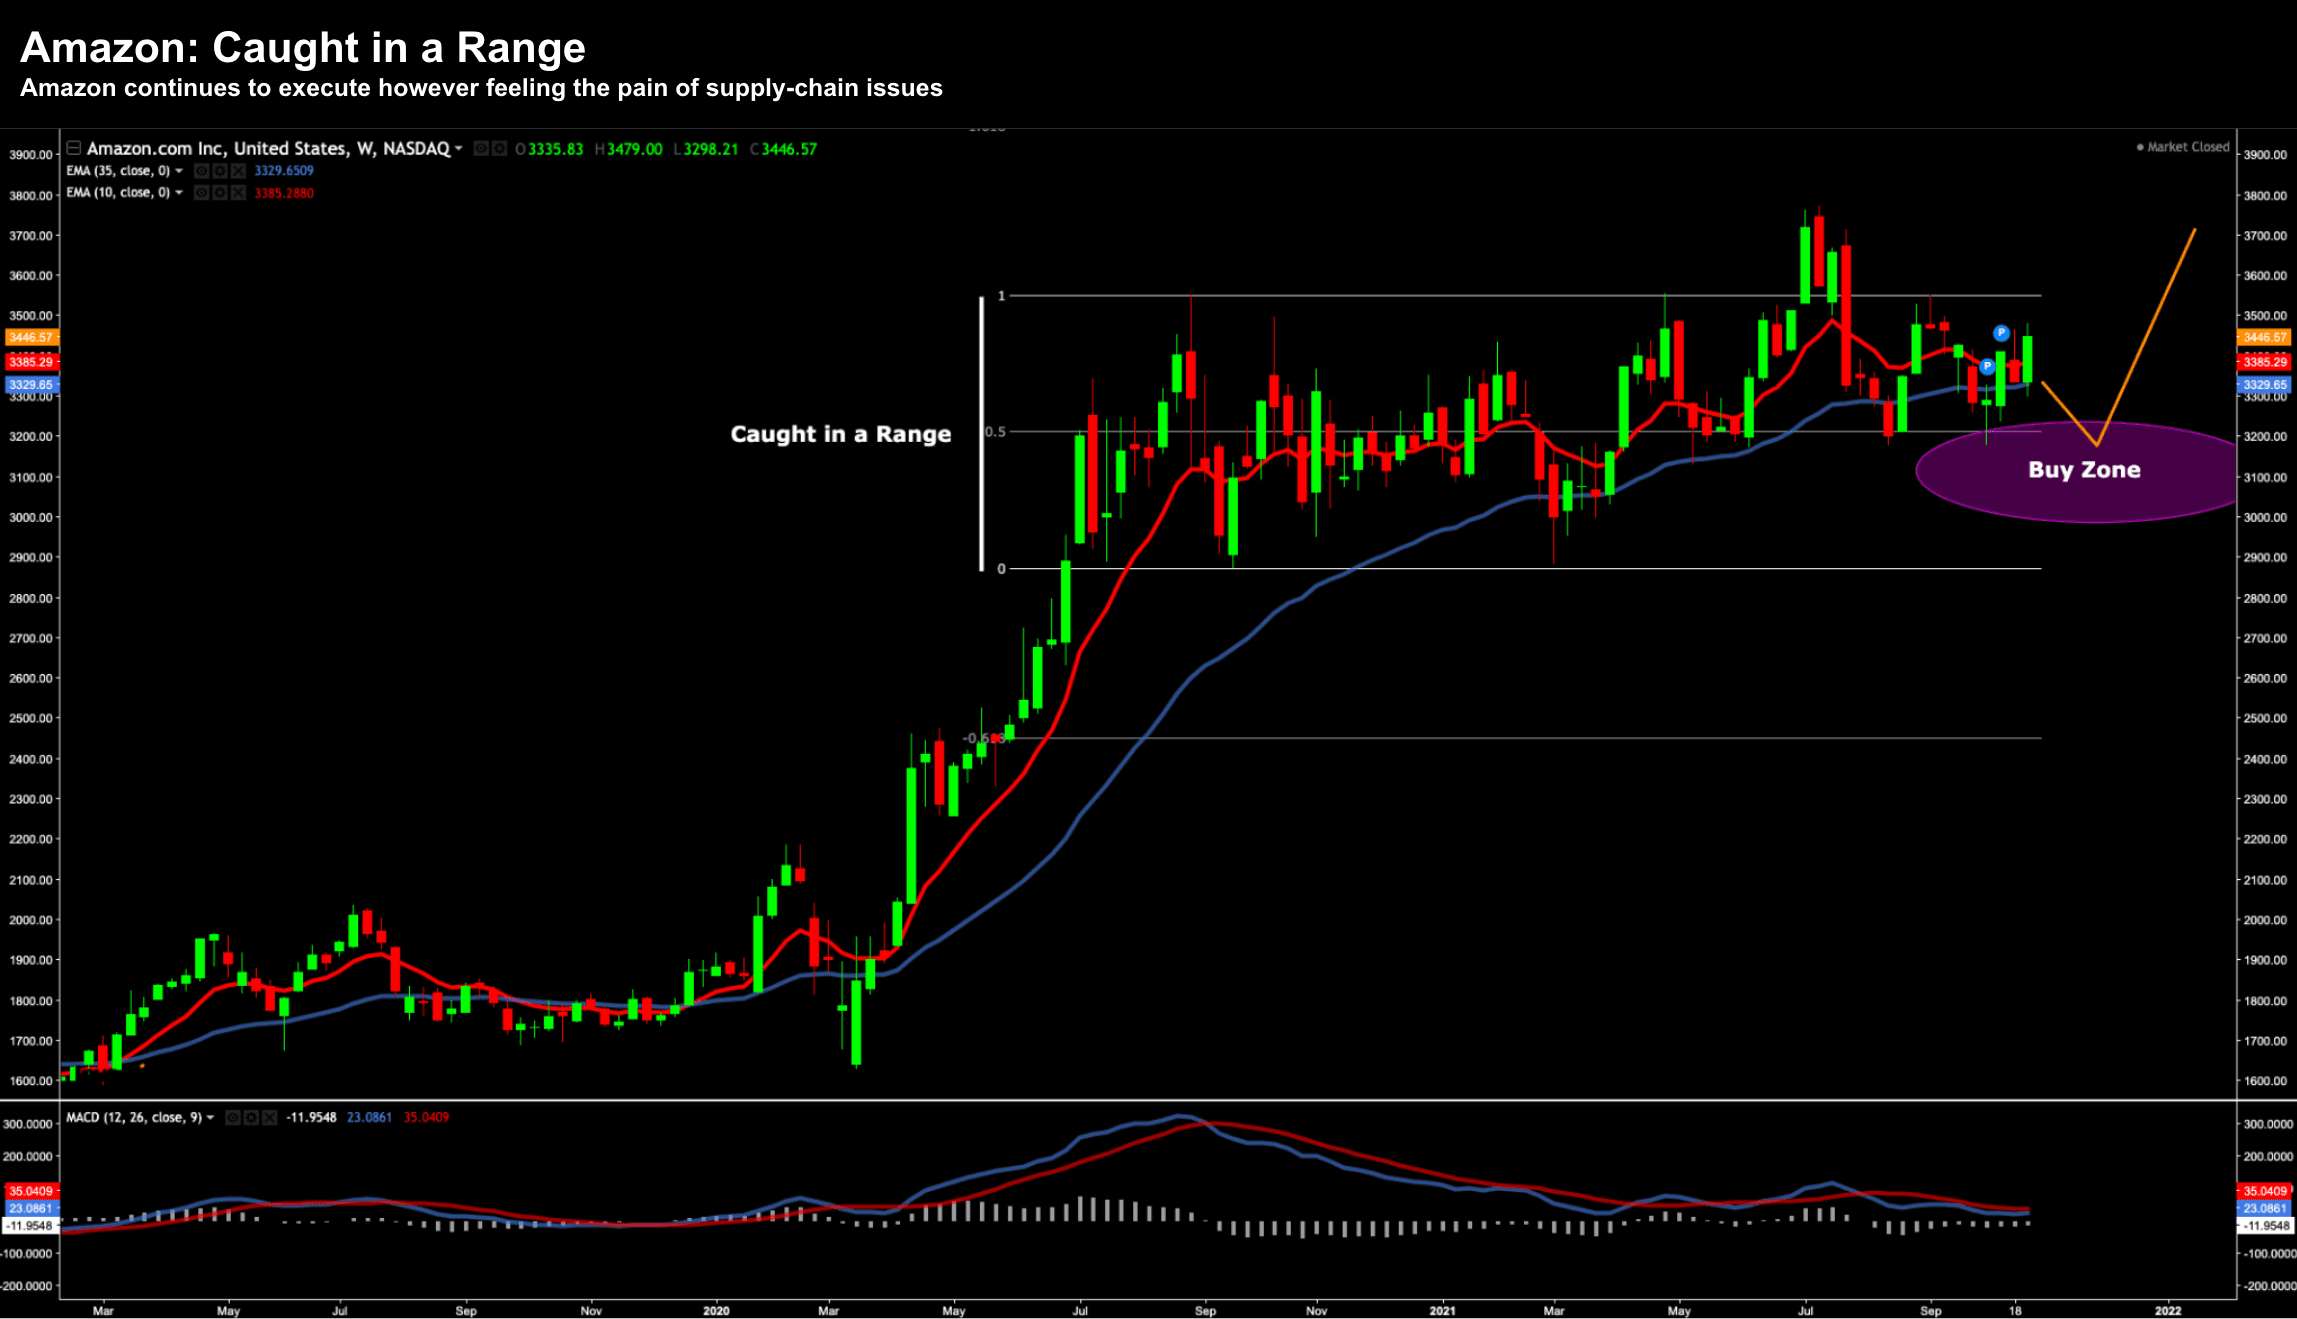
AMZN – Oct 28 2021
I think Amazon trades flat to lower here… until we see the end of the supply-chain issues
That said, if the consumer does spend this holiday season (and we know they are cashed up) – it will be with Amazon.
For example, the retail (and cloud) giant enjoys a staggering 50% of all retail spend:
From there, this lends itself to other growing businesses…
For example, consider advertising.
If 50% of all retail spend is happening on their platform – what does this say for product search?
If users are looking for products – think what advertising revenue this drives?
Here"s a stat:
The advertising business from Amazon generates more than 2.4 times the combined ad revenue from Snap, Twitter, Roku and Pinterest!
Now remember I said it was a "bit flip" for Apple to create a ~$80B run-rate services business from $0 five years ago… this is similar to the opportunity for Amazon in advertising.
Advertising grew by 50% year on year but was barely mentioned…. lost on the media"s attention to costs.
Below is a summary of their product lines:
- Online Stores (direct e-commerce) +3% Y/Y to $49.94B
- Physical Stores (dominated by Whole Foods) +13% to $4.27B,
- Seller Services +19% to $24.25B,
- Subscription Services +24% to $8.15B
- Other revenue (dominated by ads) +50% to $8.09B
Whilst I"m long Amazon… I don"t mind owning it from around the $3,000 level (and below).
I think the long-story remains intact here…. I am not a seller of this retail and cloud juggernaut.
Yield Curve Flattening…
Switching gears for a moment….
I could not help but notice the swift move higher at the short-end of the curve in bond yields this week.
Below are two lines on the chart:
- Orange – 10-year yield less the 2-year (yield curve); and
- White – 2-year constant maturity rate
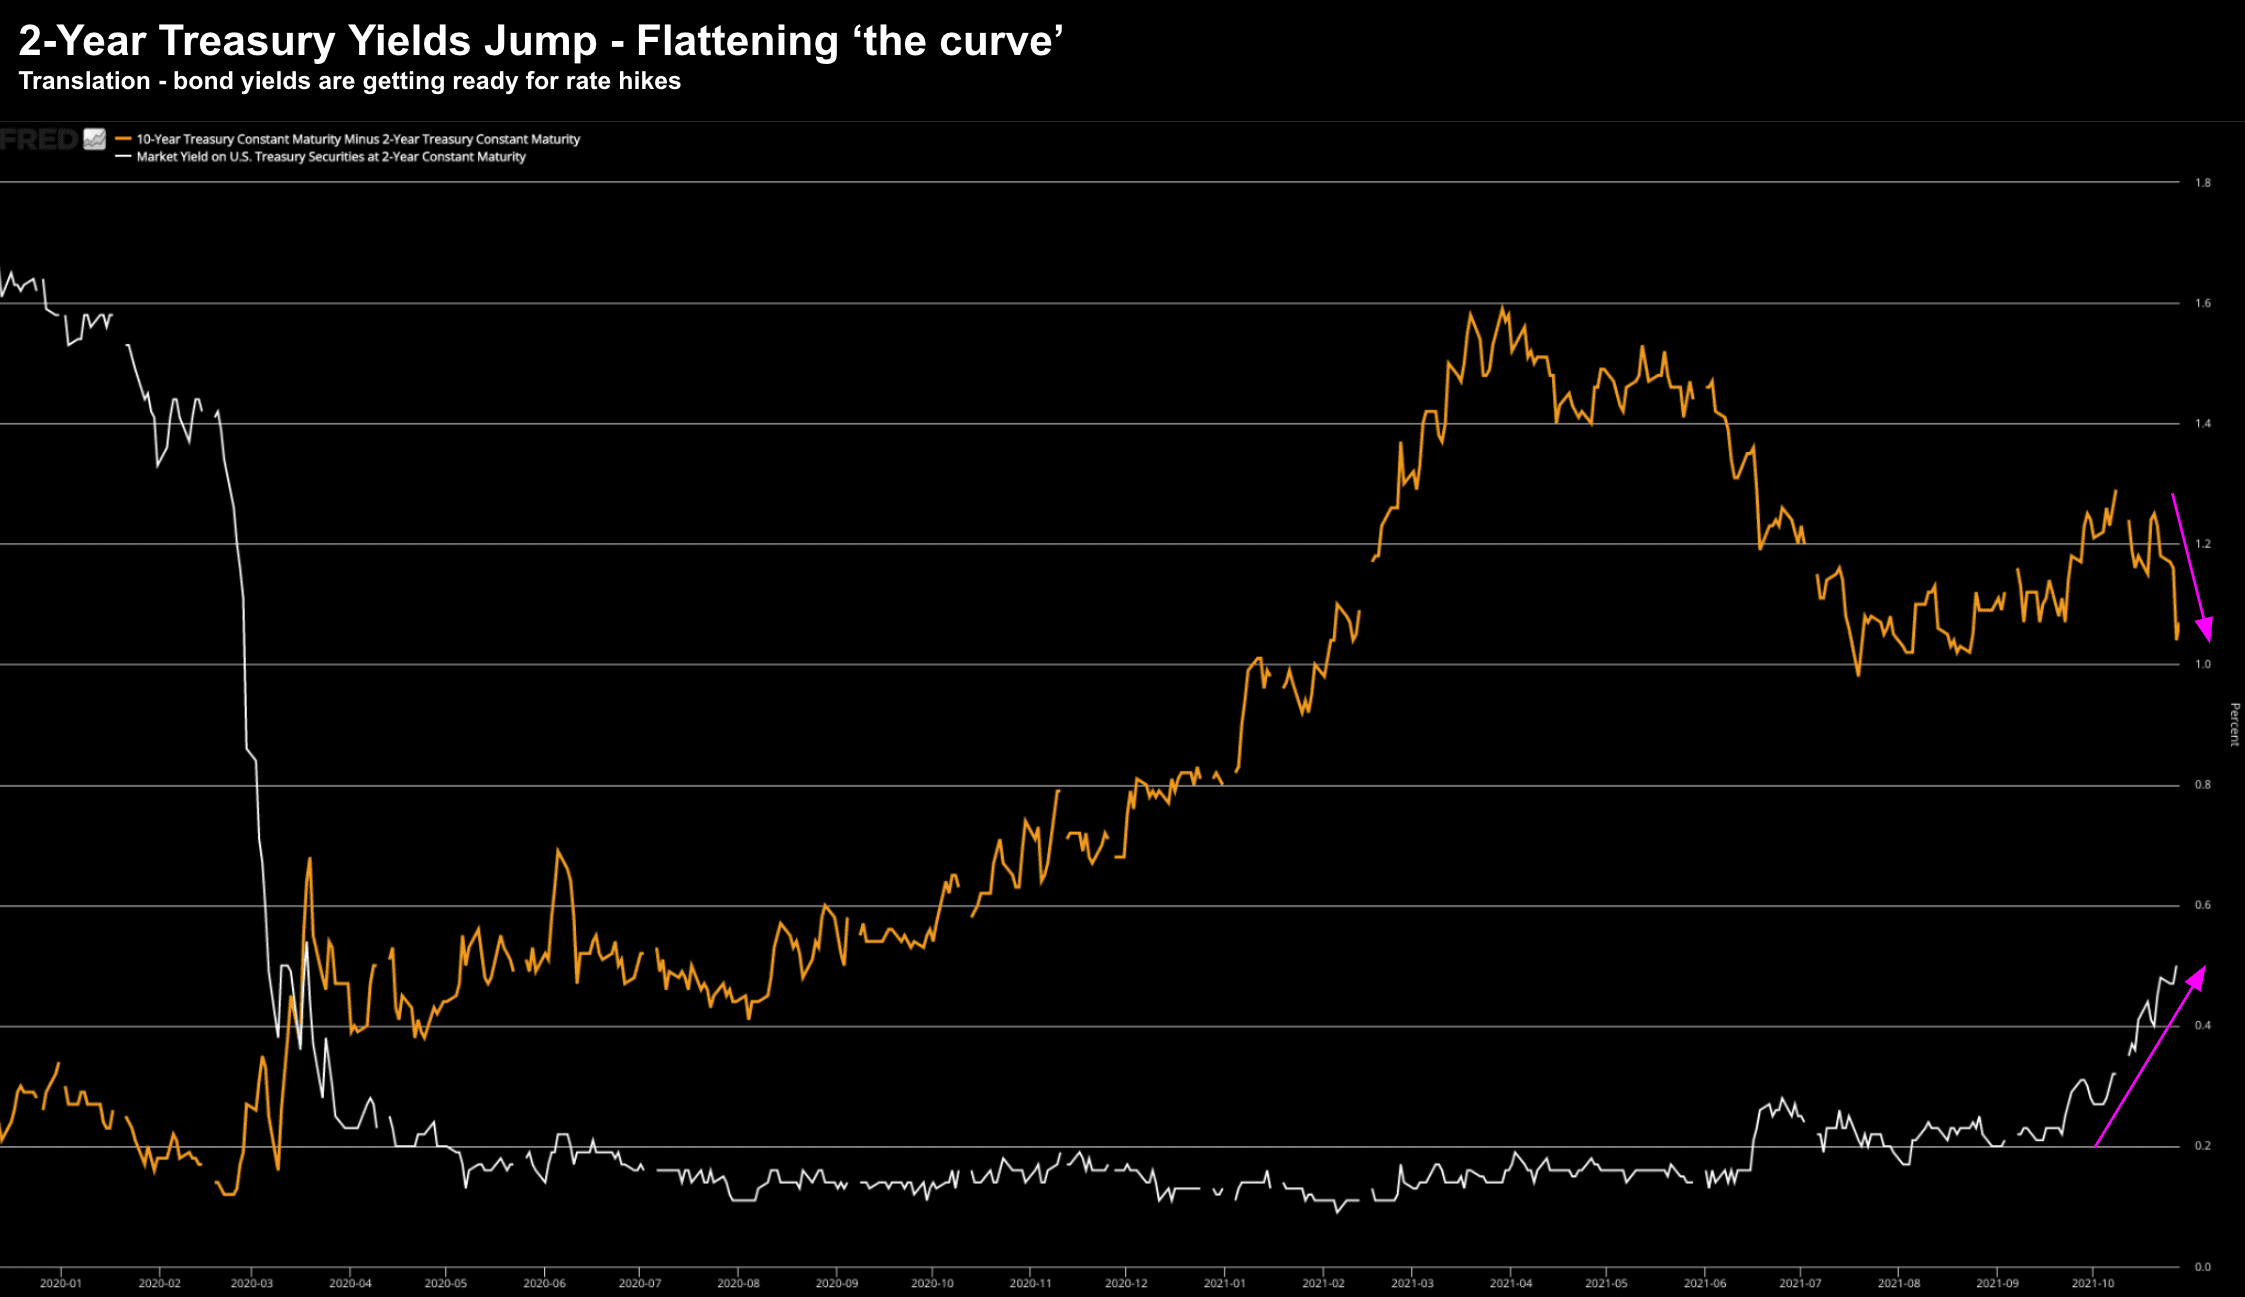
10/2-Year Yield Curve Flattens as 2-Year Yield Jumps – Oct 28 2021
This is a notable development and worth calling out…
What this tells me is where interest rates are going (or what the bond market sees)
I called this out last week…
Now the Fed can seemingly control the short-end… however they don"t control the long-end (which is market driven)
Another way to read this – the bond market is telling you where the Fed "dot plots" are going.
My forecast a few months ago was we will see rate hikes sooner than later… and potentially more than one.
This is what this chart now tells me… and I suspect that will be into a slowing economy.
Translation: Fed policy mistake ahead.
Now this is global… we are seeing the same signals from the Bank of Canada, New Zealand, Australia, England… everywhere.
Personally, I don"t think this is a good outcome for equities.
But this isn"t about to play out "tomorrow"…
Putting it All Together…
Bits vs Bytes was how I saw the "tale of the tape" from big-tech.
Those which trade purely one "bytes" – blew away expectations
However, those exposed to "bits" were hit by issues such as supply-chain shortages, labor and other issues.
That said, all four had impressive quarters from mine.
I actually thought Apple had a great quarter… but was marred by the $6B hit on chip shortages.
But as I keep saying… these will be sales delayed… not sales denied (other retailers can"t say the same thing; e.g. NIKE)
Put another way, Apple users will upgrade hardware when it"s available… it just won"t be this quarter.
Just on that… there are something like 400M+ iPhones in the market which are aged 3 years or older.
That"s a massive upgrade cycle coming Apple"s way in 2022…