How Much ‘Fed’ Has the Market Priced In?
- More Fed equals more volatility
- Will this be a repeat of late 2018? Or worse?
- Utilities, staples and health-care stocks do well with higher rates
Over the past couple of weeks I"ve been warning of stocks finding near-term resistance in the current zone.
Today stocks continued their weekly descent.
The S&P dropped around 1%…. the Nasdaq losing 2.2%
The reason?
Look no further than the Fed.
From mine, your 2022 investing / trading "equation" looks like this: more Fed equals more volatility.
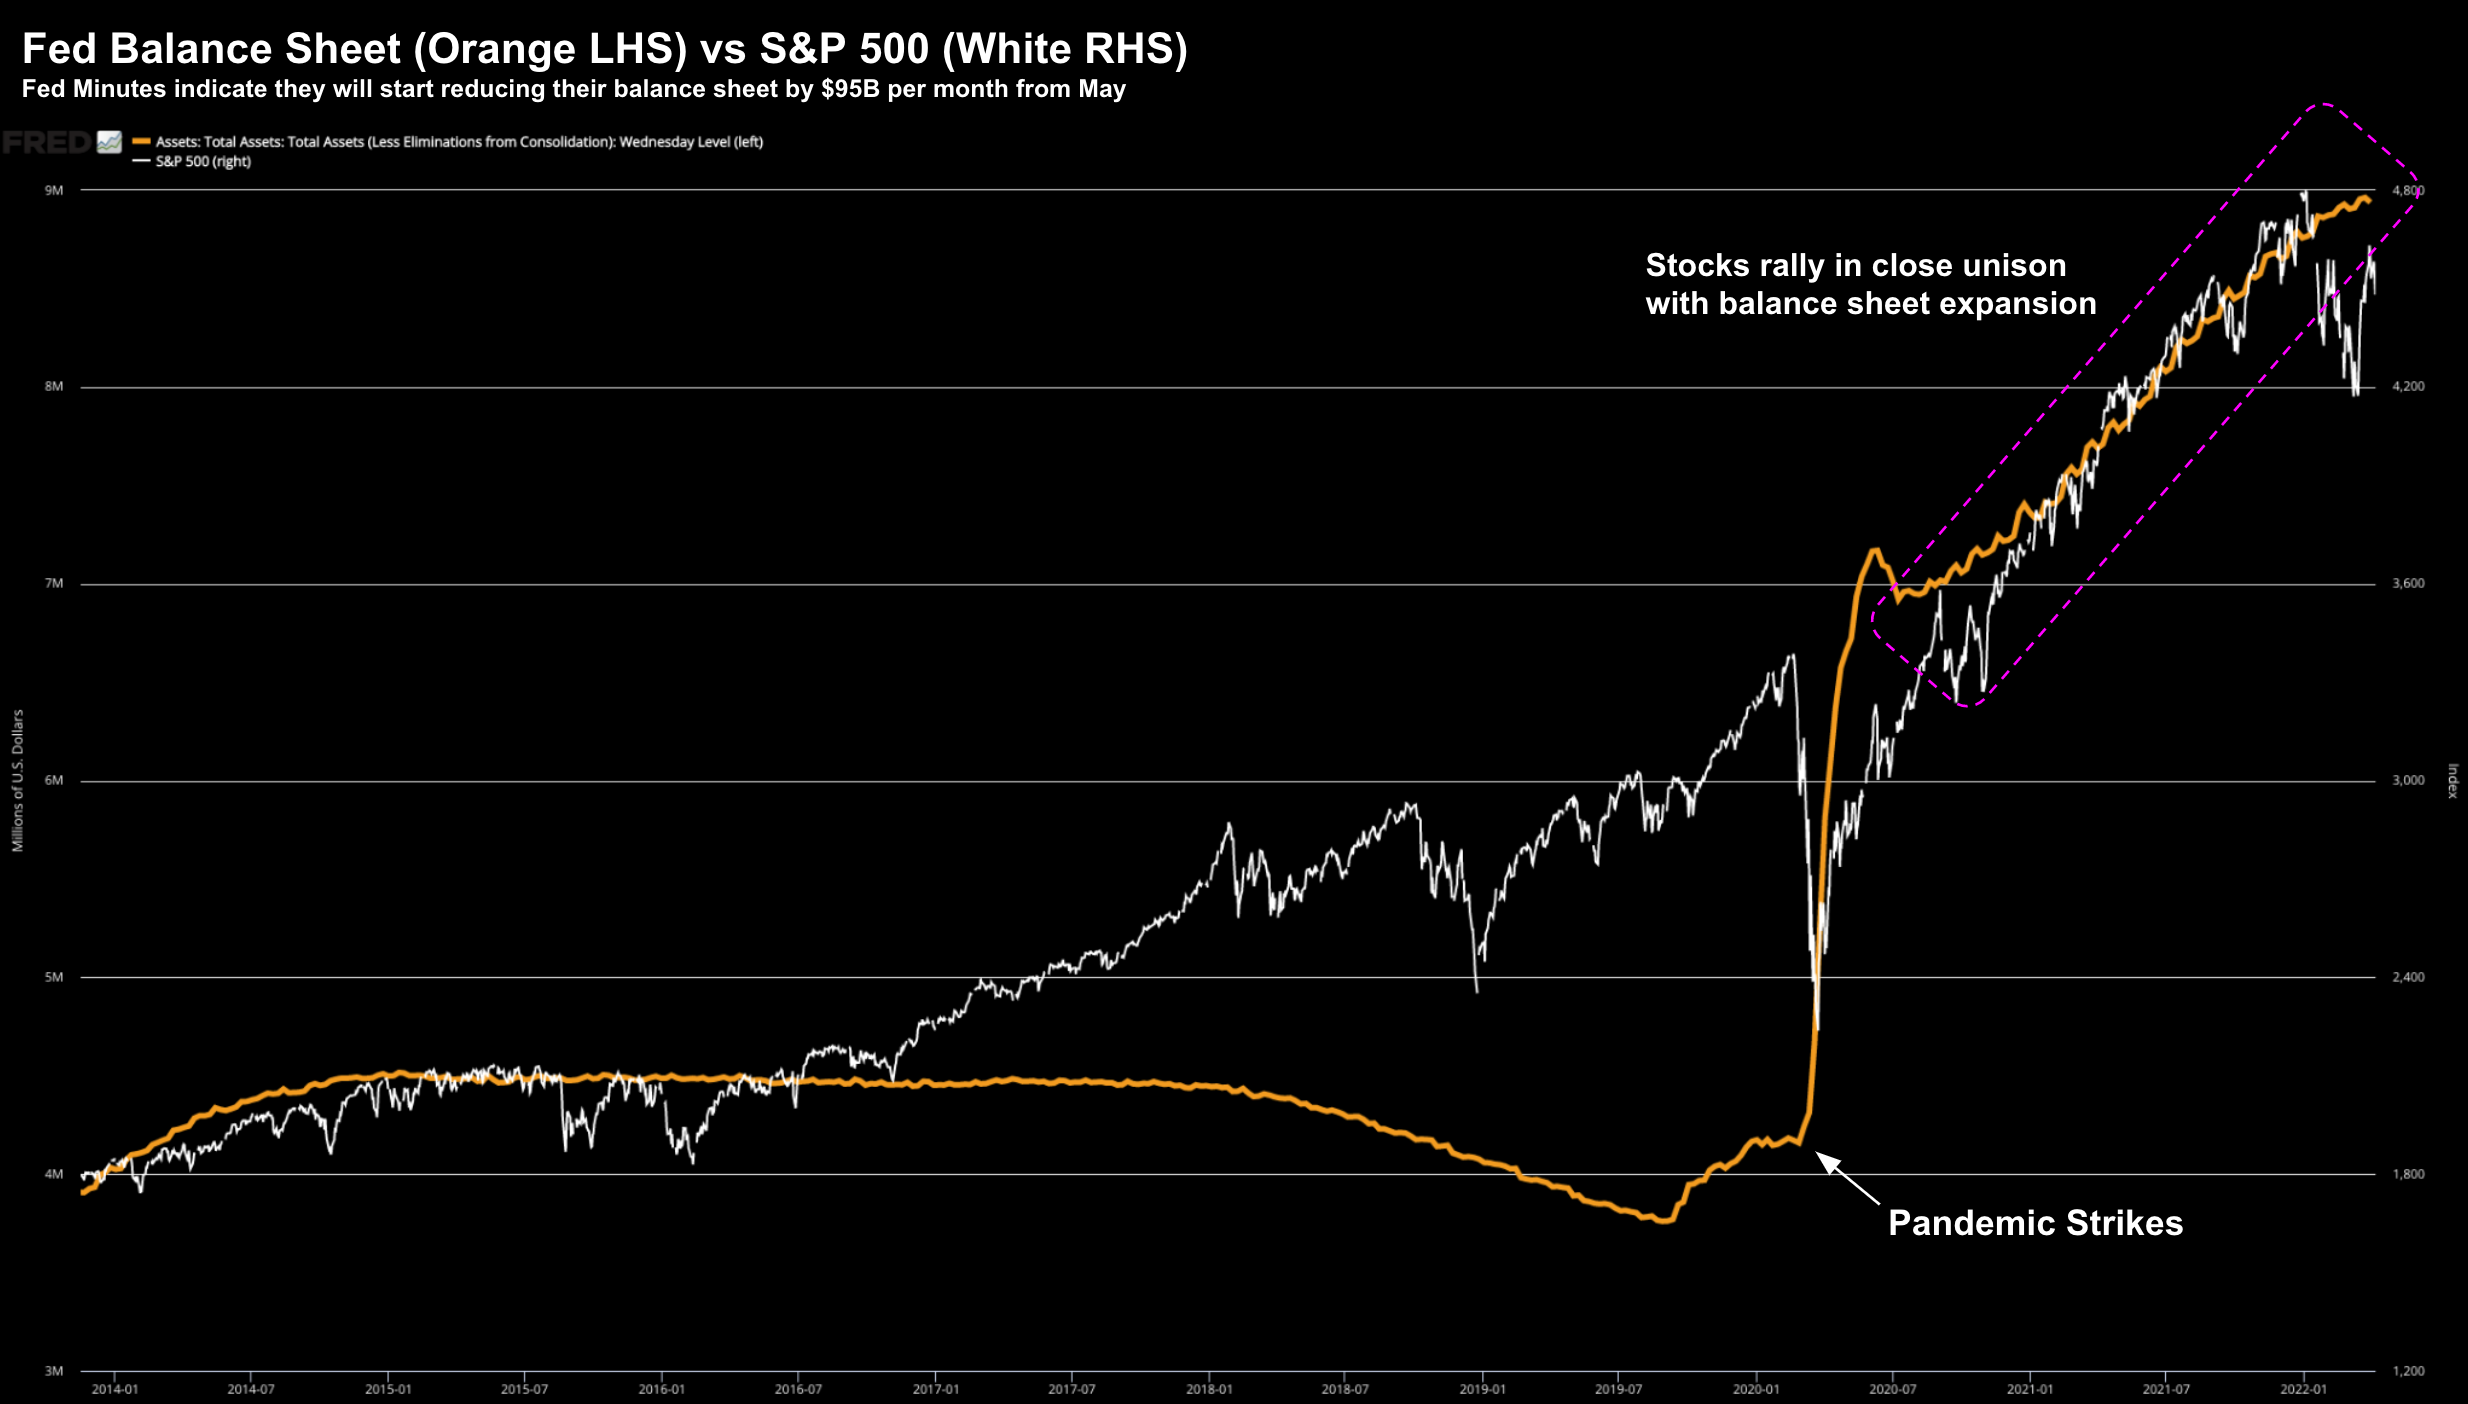
The world"s most influential central bank confirmed it will act quicker than initially anticipated to reduce its $9 Trillion balance sheet.
This is known as "quantitative tightening" (QT) – intended to reduce the supply of money.
And it"s about 12+ months overdue…
In minutes released from the central bank"s latest meeting, officials "generally agreed" the Fed should shrink its balance sheet by $95 billion per month.
But here"s the thing… that could easily increase to more than $100B if they do not get the traction they anticipate on inflation.
If true, it could spell trouble for stocks (more on this in a moment)
As I"ve said in recent missives – I think this is a positive development.
However, it"s going to drive interest rates sharply higher.
And for some, that may not be good news (especially anyone with debt)
Balance Sheet Reduction = Rate Hikes
In order to curb inflation – the Fed is going to adopt a "one-two punch"…
(1) aggressively raise rates (e.g. as much as 50 basis points each meeting); and
(2) reducing its balance sheet (i.e., selling bonds)
Now the Fed minutes also revealed that many officials see QT helping the yield curve to steepen.
And that makes sense…
For example, as the Fed shifts from becoming a buyer of long-term bonds (QE) to a seller – this will most likely elevate the 10-year yield.
Note – bond yields trade inversely to their price.
For those less familiar – short-term government bonds (e.g., 3-month, 1-year and 2-year) generally move in tandem with rate-hike expectations.
However, the long-end of the curve (e.g., 10-year and 30-year) can sometimes fall as short rates rise, flattening (or worse, inverting) the yield curve.
This happens as market participants express concerns over the outlook for economic growth (or the lack of).
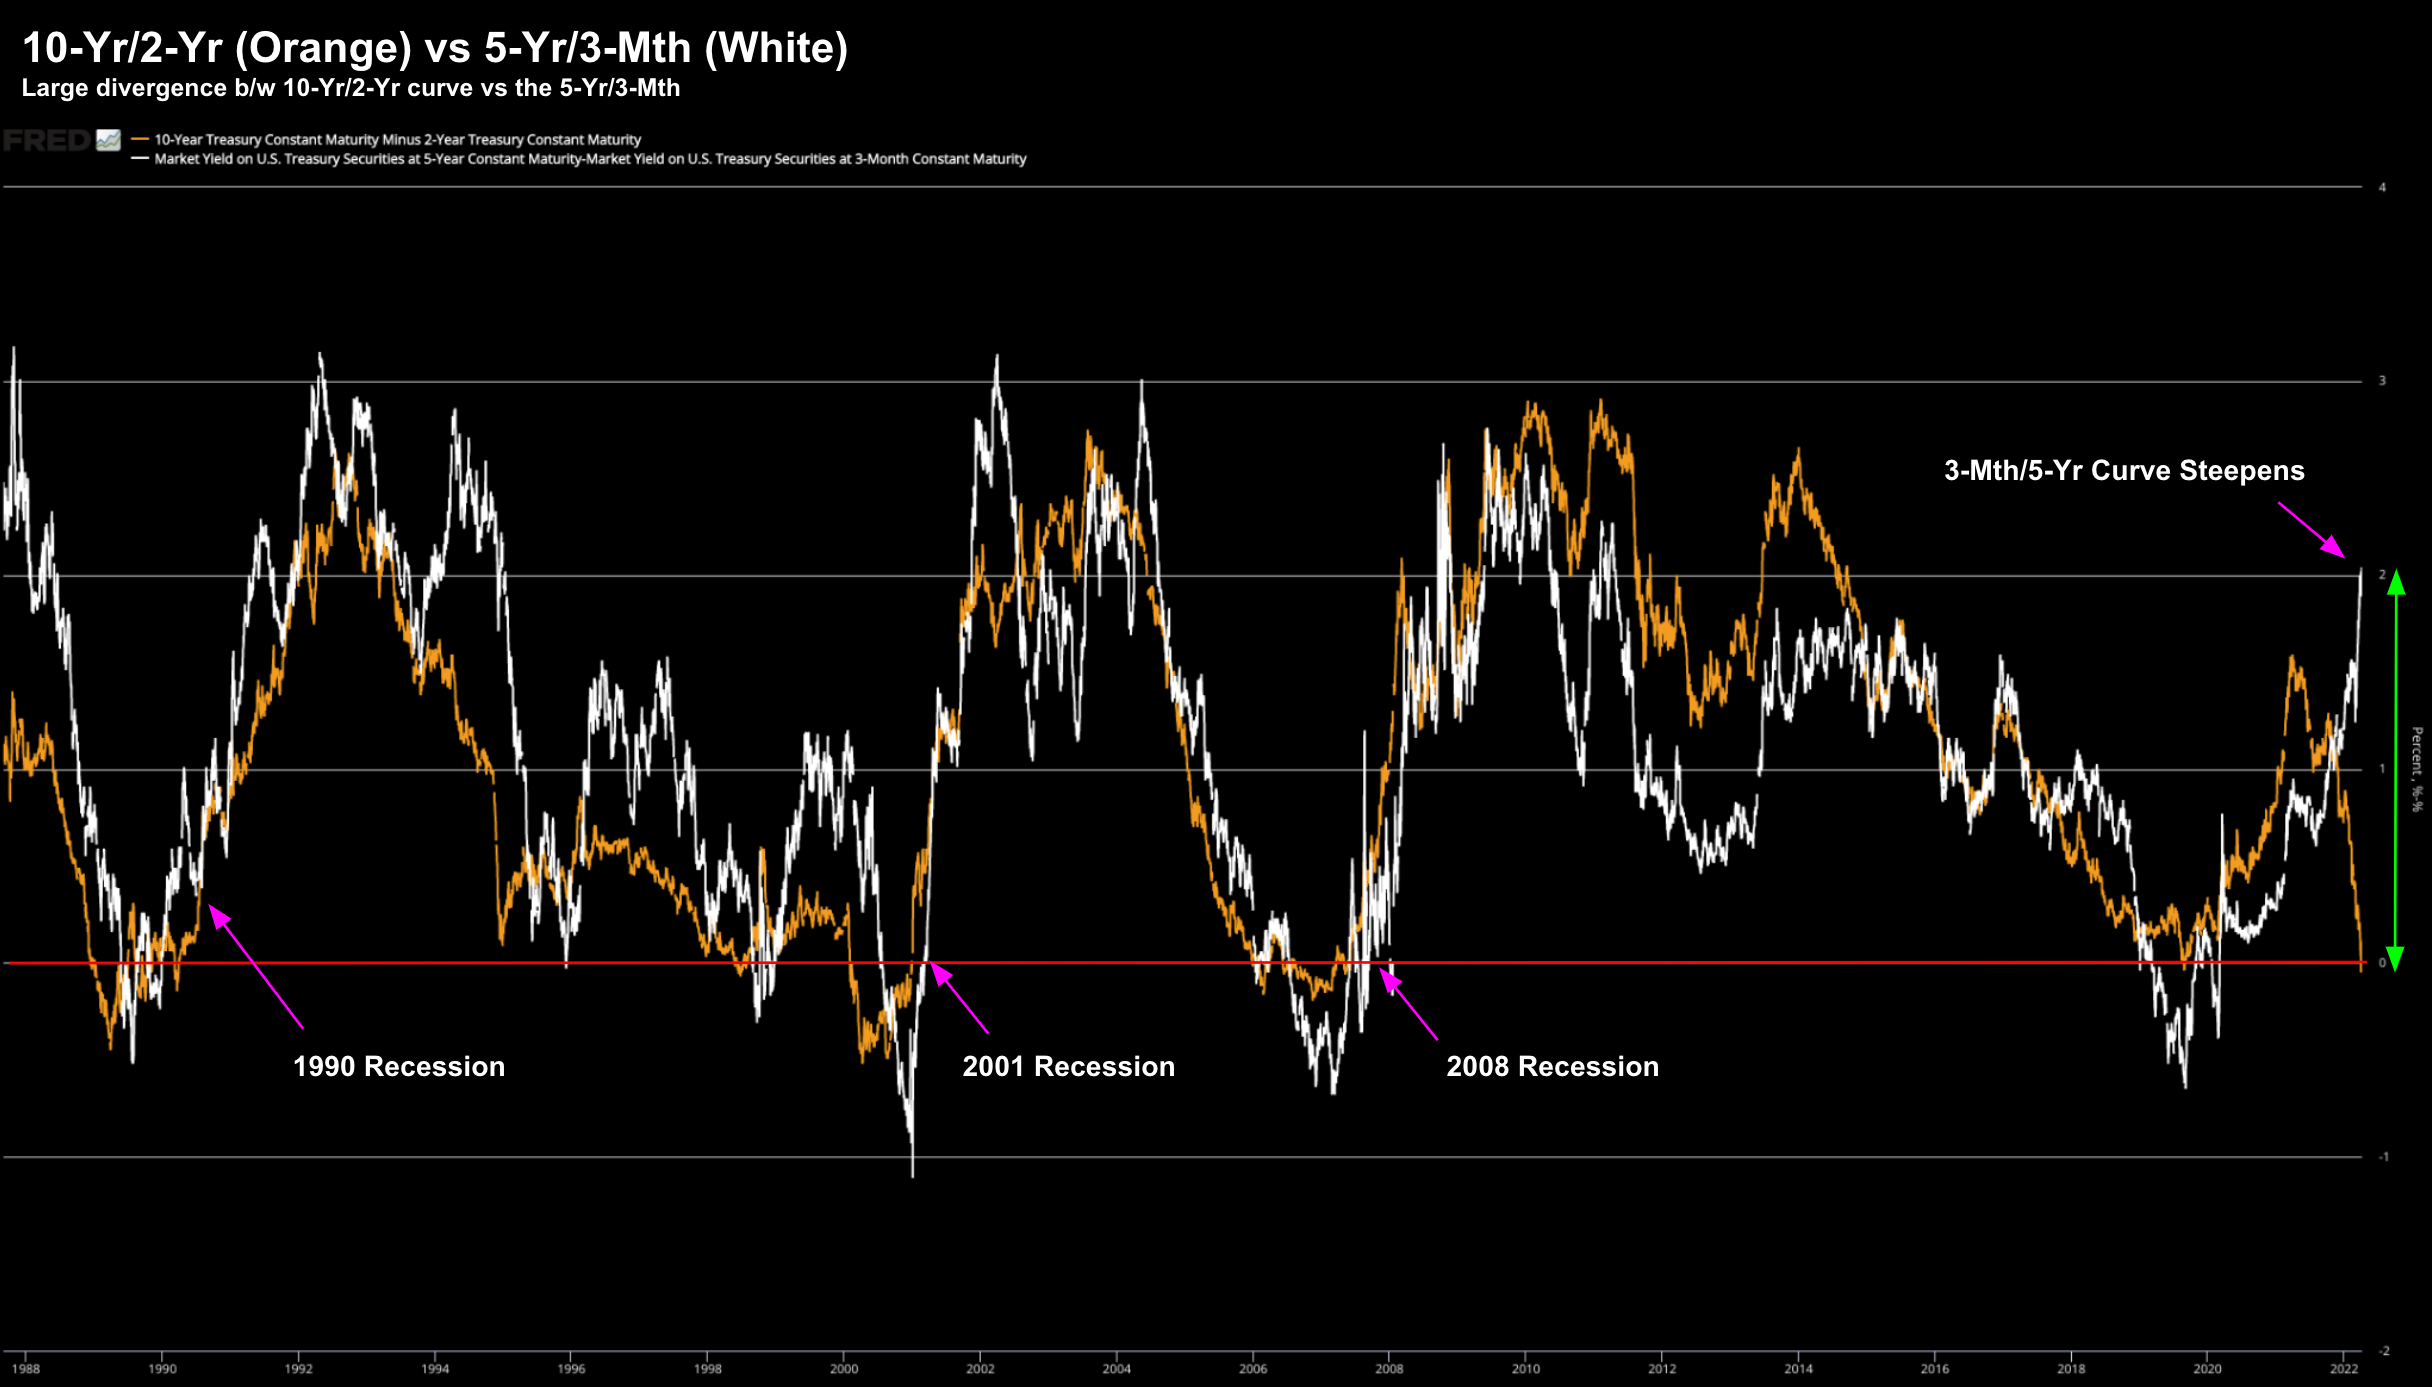
For example, consider the chart below…
April 6 2022
The orange line below shows the long-term yield curve inversion (i.e. below zero)
However, compare that with the shorter-end of the curve in white (e.g. 5-year / 3-month)
Here we see a large divergence (green arrow) – with the shorter curve positive by around 200 basis points.
And as I explained recently – we should be paying attention to various points along the curve (not just the "10s/2s")
For example, I think we start to worry more when we see the shorter end invert (as we have seen in previous recessions)
Let"s talk more to QT and the impact on the long-end…
For example, what will that equal in rate rises?
Deutsche Bank estimate that a $1.5 Trillion balance sheet reduction would equate to between 2.5 and 3.5 quarter-point rate hikes.
And this is the one-two punch.
But it"s very difficult to estimate precisely what QT equals in terms of rate rises… however it"s bound to strike at the heart of markets.
Let"s take a look at the last time this happened… 2018.
A Repeat of 2018? Or Worse?
The first chart I shared showed how the Fed started to reduce its balance sheet in early 2018.
However, it was only to the tune of $10B per month…
Today the Fed have hinted starting at $95B per month… and potentially going higher.
But look at what we saw on the S&P 500 in Q4 of 2018…. as the Fed delivered its "one-two punch":
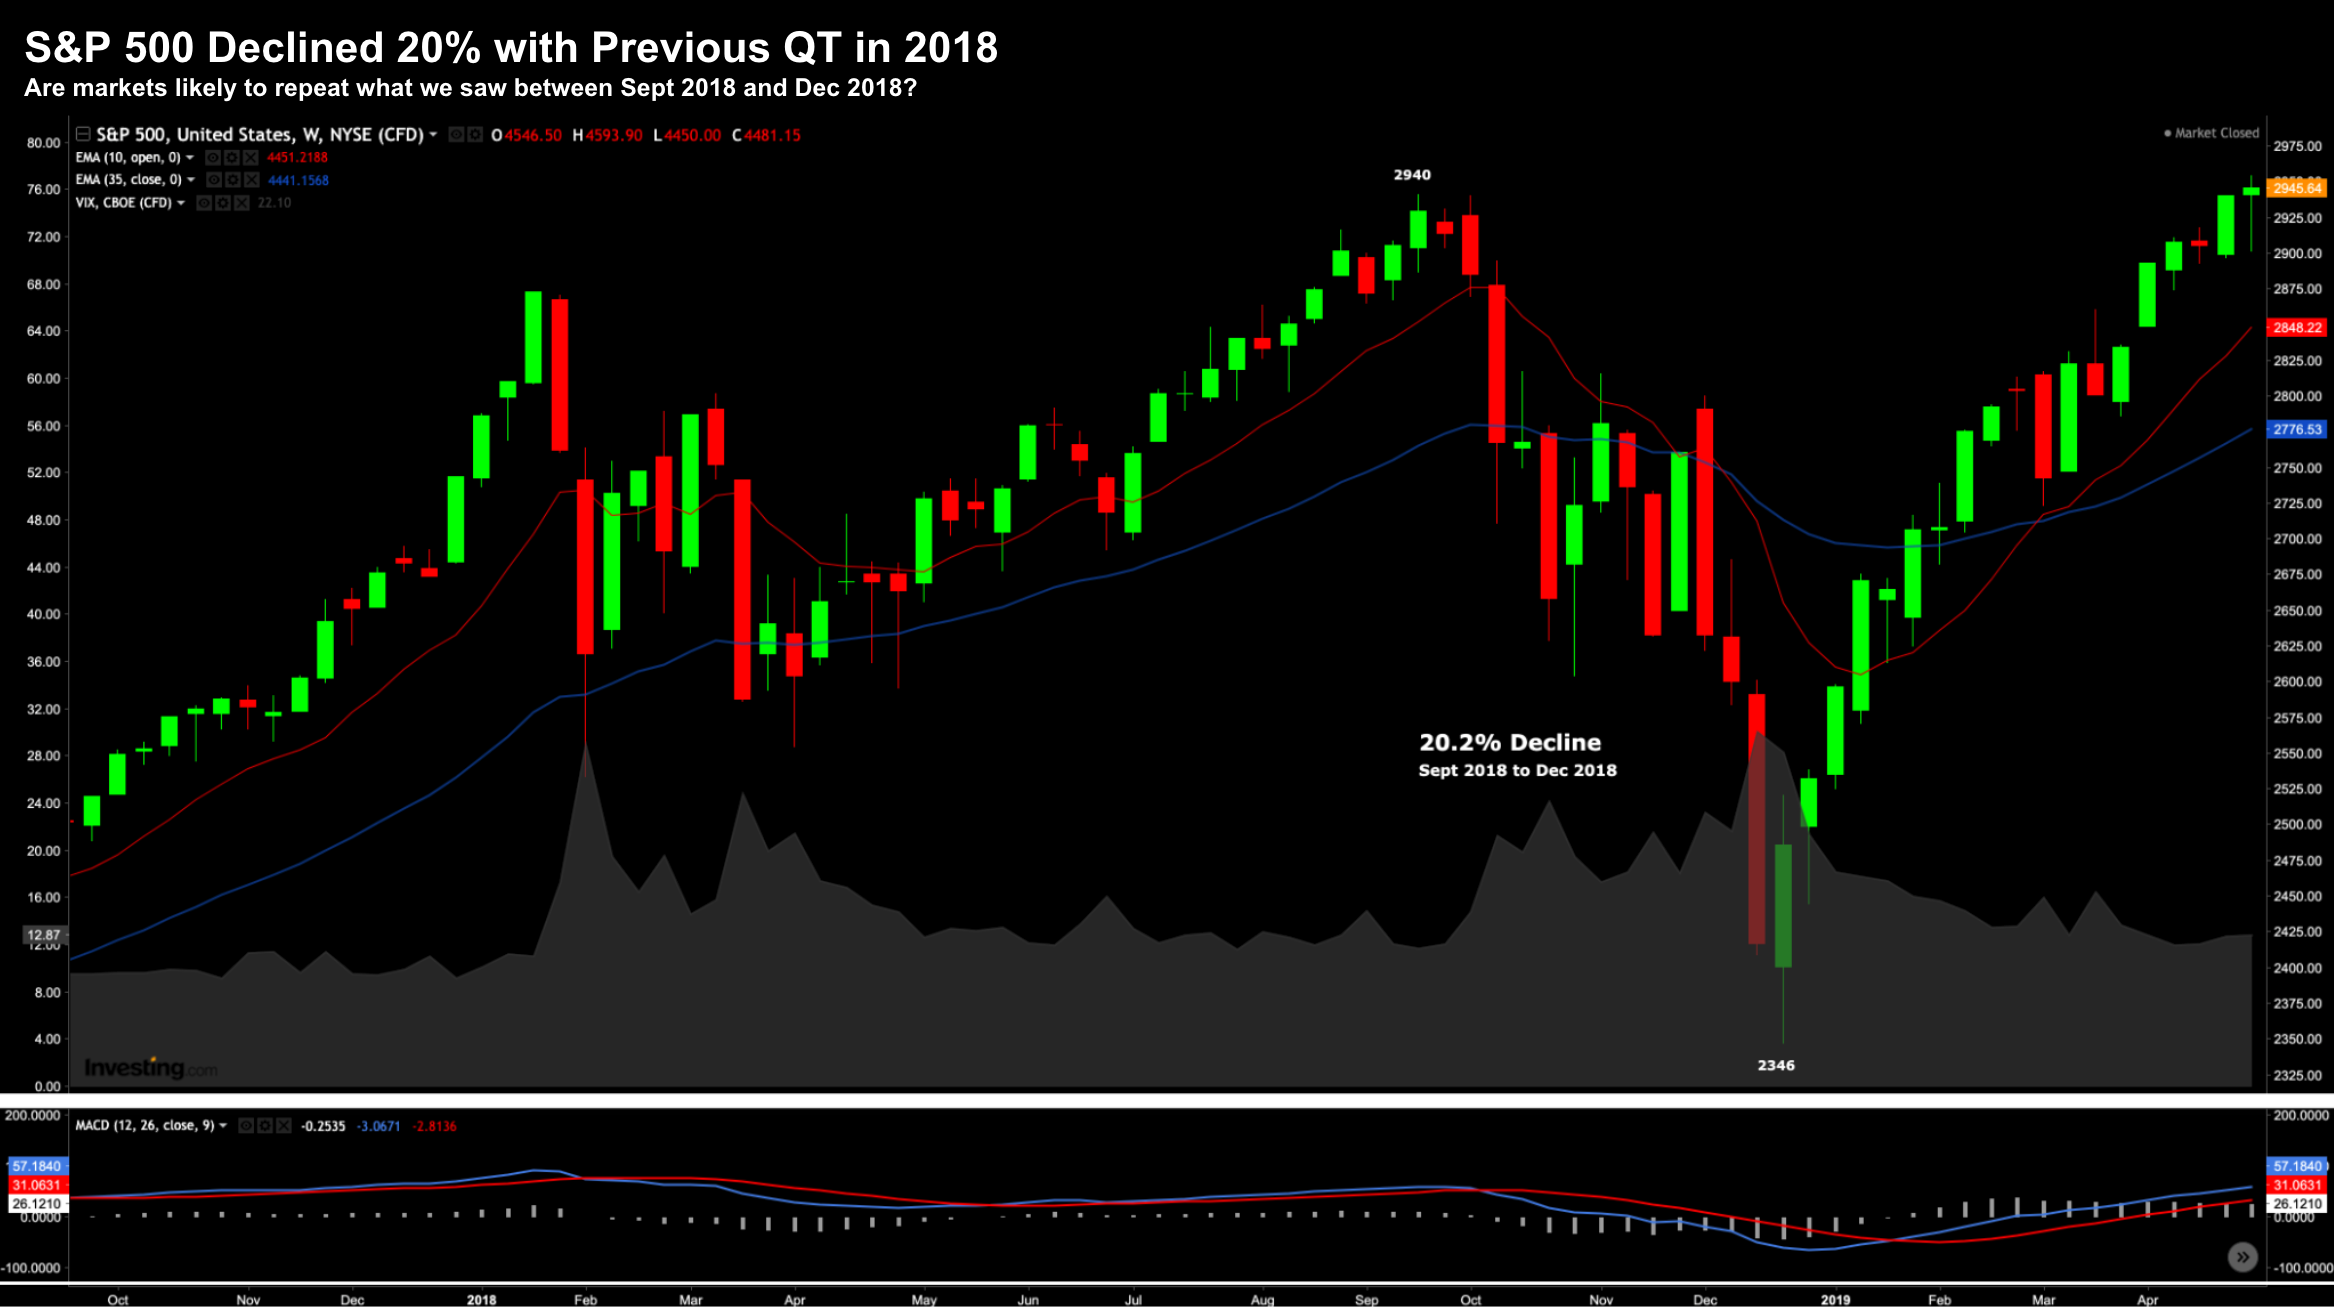
Q4 2018, markets dropped like a stone – losing around 20%.
However, the Fed bowed to the pressure of the market and pivoted early 2019.
Rate hikes turned to rate cuts and QT gave way to QE (i.e. bond buying).
Note: that"s something I also see late 2023.
But what did the Fed pivot do to stocks?
They shot straight up.
Now Powell told the market on Dec 15 last year "… when dealing with balance sheet issues, we"ve learned that it"s best to take a careful sort of methodical approach… as markets can be sensitive to it"
You think Jay?
This time the Fed doesn"t have the luxury of being "sensitive to stocks"…
The so-called "Fed Put" is gone.
They have an inflation number which could challenge 10% YoY in the coming months. Maybe higher?
That"s serious.
But this wasn"t a problem in 2018…
This time the Fed won"t be able to pivot should the market kick and scream (which it will)… they will be pedal to the metal.
The economic (and social) risks of unwanted inflation far exceed that of declines in speculative assets.
Putting it All Together
More Fed equals more volatility.
That"s your equation for 2022 and into 2023.
What that means for investors (and traders) is you need to be a stock picker.
For example, not only do you want to look for strong cash flows – you will want to see balance sheet strength.
The Fed"s actions will lead to lower cash flow for almost all stocks.
Will stocks you own withstand this kind of income (and margin) pressure over the next 2 years?
Many won"t.
On the hand, sectors such as utilities, consumer staples and health-care stocks will likely hold up better.
For example, stocks I have here in my portfolio include the likes of Eli Lilly (LLY) and United Health (UNH)
UNH was up $14 per share today; and LLY up $13.
And of course, big-cap tech is also likely to outperform given their incredible cash flow and balance sheets.
Despite the volatility – you still want exposure to tech growth.
These names remain best in class.