Real Yields Suggest No Recession in 2022
- Why the Fed targets real yields (not nominal)
- 2-10 is not a panacea for timing a recession
- Recession risks for 2022 remain very low
Over the past fifty years, the inversion of the 2-year / 10-year yield curve (aka "2-10") has predicted every recession.
Given its reliable predictive power – its recent inversion consumes financial media.
There"s just one problem:
It"s lousy at timing.
If using only this indicator – a recession can result anywhere from 12 to 24 months after the date of inversion.
That"s somewhat helpful…. as you know it"s coming.
However, post the inversion and prior to the onset of recession – it"s not uncommon for stocks to rally 25%+
That"s a lot to miss out on.
And it raises a good question: are all yield curves reliable?
The answer is no.
For example, there are a variety of ways to measure the shape of the yield curve.
It all depends on the two durations you choose.
The problem is they can give conflicting signals.
For instance, recently most pundits will refer to the "2-5", "2-10", "5-10" and the "10-30″ spread.
Which (if any) should you follow?
For example, at the time of writing we find the following spreads:
- 5-10 spread is negative (-5 bps)
- 2-10 spread has pivoted from negative to positive (+20 bps); and the
- 10-30 spread is essentially flat (+3 bps).
Is one more reliable than the other?
From mine, none of these are particularly helpful in the near-term.
Again, whilst the 2-10 inversion has predicted every recession over the past 50 years… the focus should be on what real yields are doing.
After all, this is the Fed"s focus and specifically what they are targeting
What"s more – these are what drive the actions of consumers as they
- reflect true cost of borrowing; and
- reflect real returns on savings and deposits
For example, if real yields are below zero – this will incentivize investors to speculate as they are losing money in cash (as is the case today).
This is what we have seen the past 2-3 years.
Second, the Fed has explicitly said they are not actually targeting the nominal Fed funds rate… their focus is the real Fed funds rate.
In other words, the overnight cash rate adjusted for inflation.
With that preface, let"s take a look real yields versus those which are nominal. From there, what is the real yield curve tells us; i.e.,
- why the Fed are a long way "behind the curve"; and
- when to worry about the onset of a recession
Spoiler alert: we have seen the same pattern repeat with every recession – I don"t see why this one will be any different.
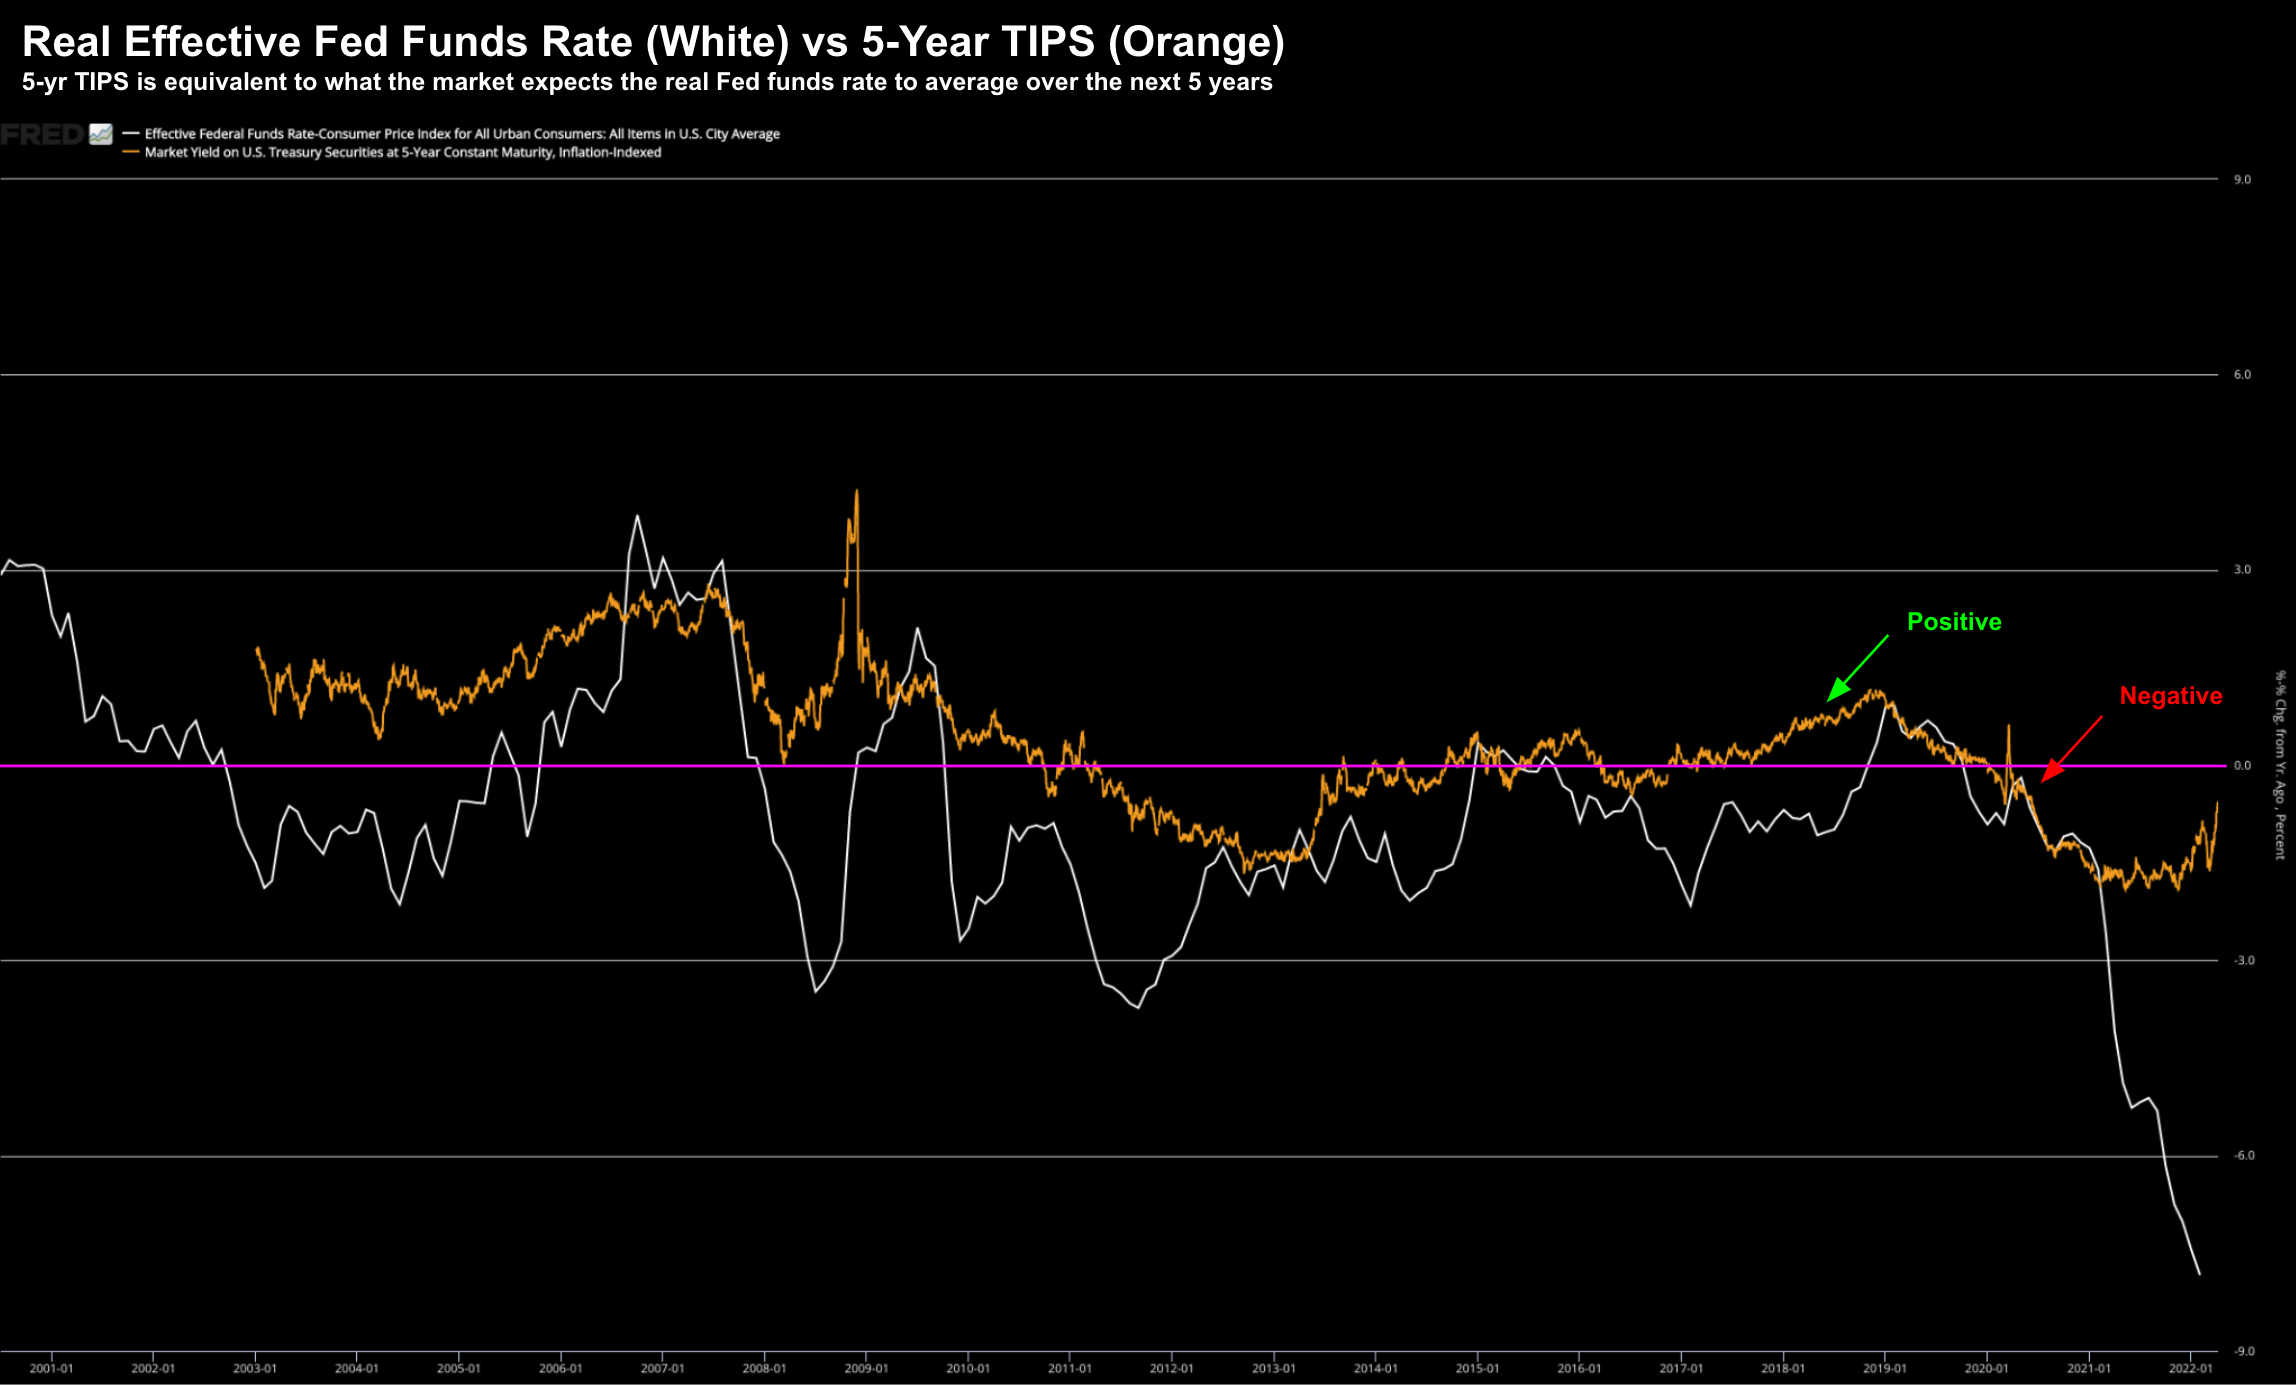
This "Real" Curve is the Fed"s Focus
Over the past few years writing this blog – I"ve often talked about the importance of 5-year Treasury Inflation Protection Securities (TIPS)
TIPS were created in 1997 to reflect true returns.
In short, they are said to be the equivalent to what the market expects the real Fed funds rate to average over the next 5 years.
Below I have plotted two lines:
- 5-Year TIPS (orange); vs
- Real Effective Fed Funds Rate (white) – adjusted using CPI
April 10 2022
From mine, this chart gives us more insights into the Fed"s likely actions vs say the "inverted" 2-10.
Three simple reasons:
- These are real yields (i.e. adjusted for CPI);
- The Fed focuses more on the real fed funds rate (not nominal); and
- It"s what the market expects the Fed to do over the next 5 years.
This chart helps us determine a couple of very important things:
The first to note is how they trade in relation to each other (e.g. specifically which is higher).
I will talk to two scenarios:
#1. 5-Year TIPS (orange) above the Real Fed Funds Rate (white)
In this situation (which is the case today by a strong margin) — the market is expecting the Fed to tighten policy in the future.
For example, the greater the delta, the more the market expects the Fed to raise rates.
#2. 5-Year TIPS (orange) below the Real Fed Funds Rate (white)
The opposite situation is cause for concern.
When the real fed funds rate rises above 5-year TIPS – the market expects the Fed to cut rates.
Put another way, the market is saying conditions are too tight.
For example, for each of the past three recessions, we saw the orange line move back above the white line.
Monetary policy became too tight and a recession quickly followed.
The chart above shows we are not remotely close to this today.
Therefore, it"s my view the Fed can comfortably raise rates several times (e.g., as much as 200 basis points) before markets start to pause.
However, what has pundits on edge is the one-two punch of quantitative tightening.
This could have the effect of flattening the curve (or inverting it) – which would tell us that monetary conditions are tight and a recession is about to follow.
From mine, look for this towards the end of the year.
Real Yield Curve is Sharply Positive
To help visualize the slope of this curve – below I"ve subtracted the overnight real Fed funds rate (i.e., -7.5% adjusted for CPI) from the 5-year TIPS (-0.5%)
Here we can see just how positive this curve is (white line):
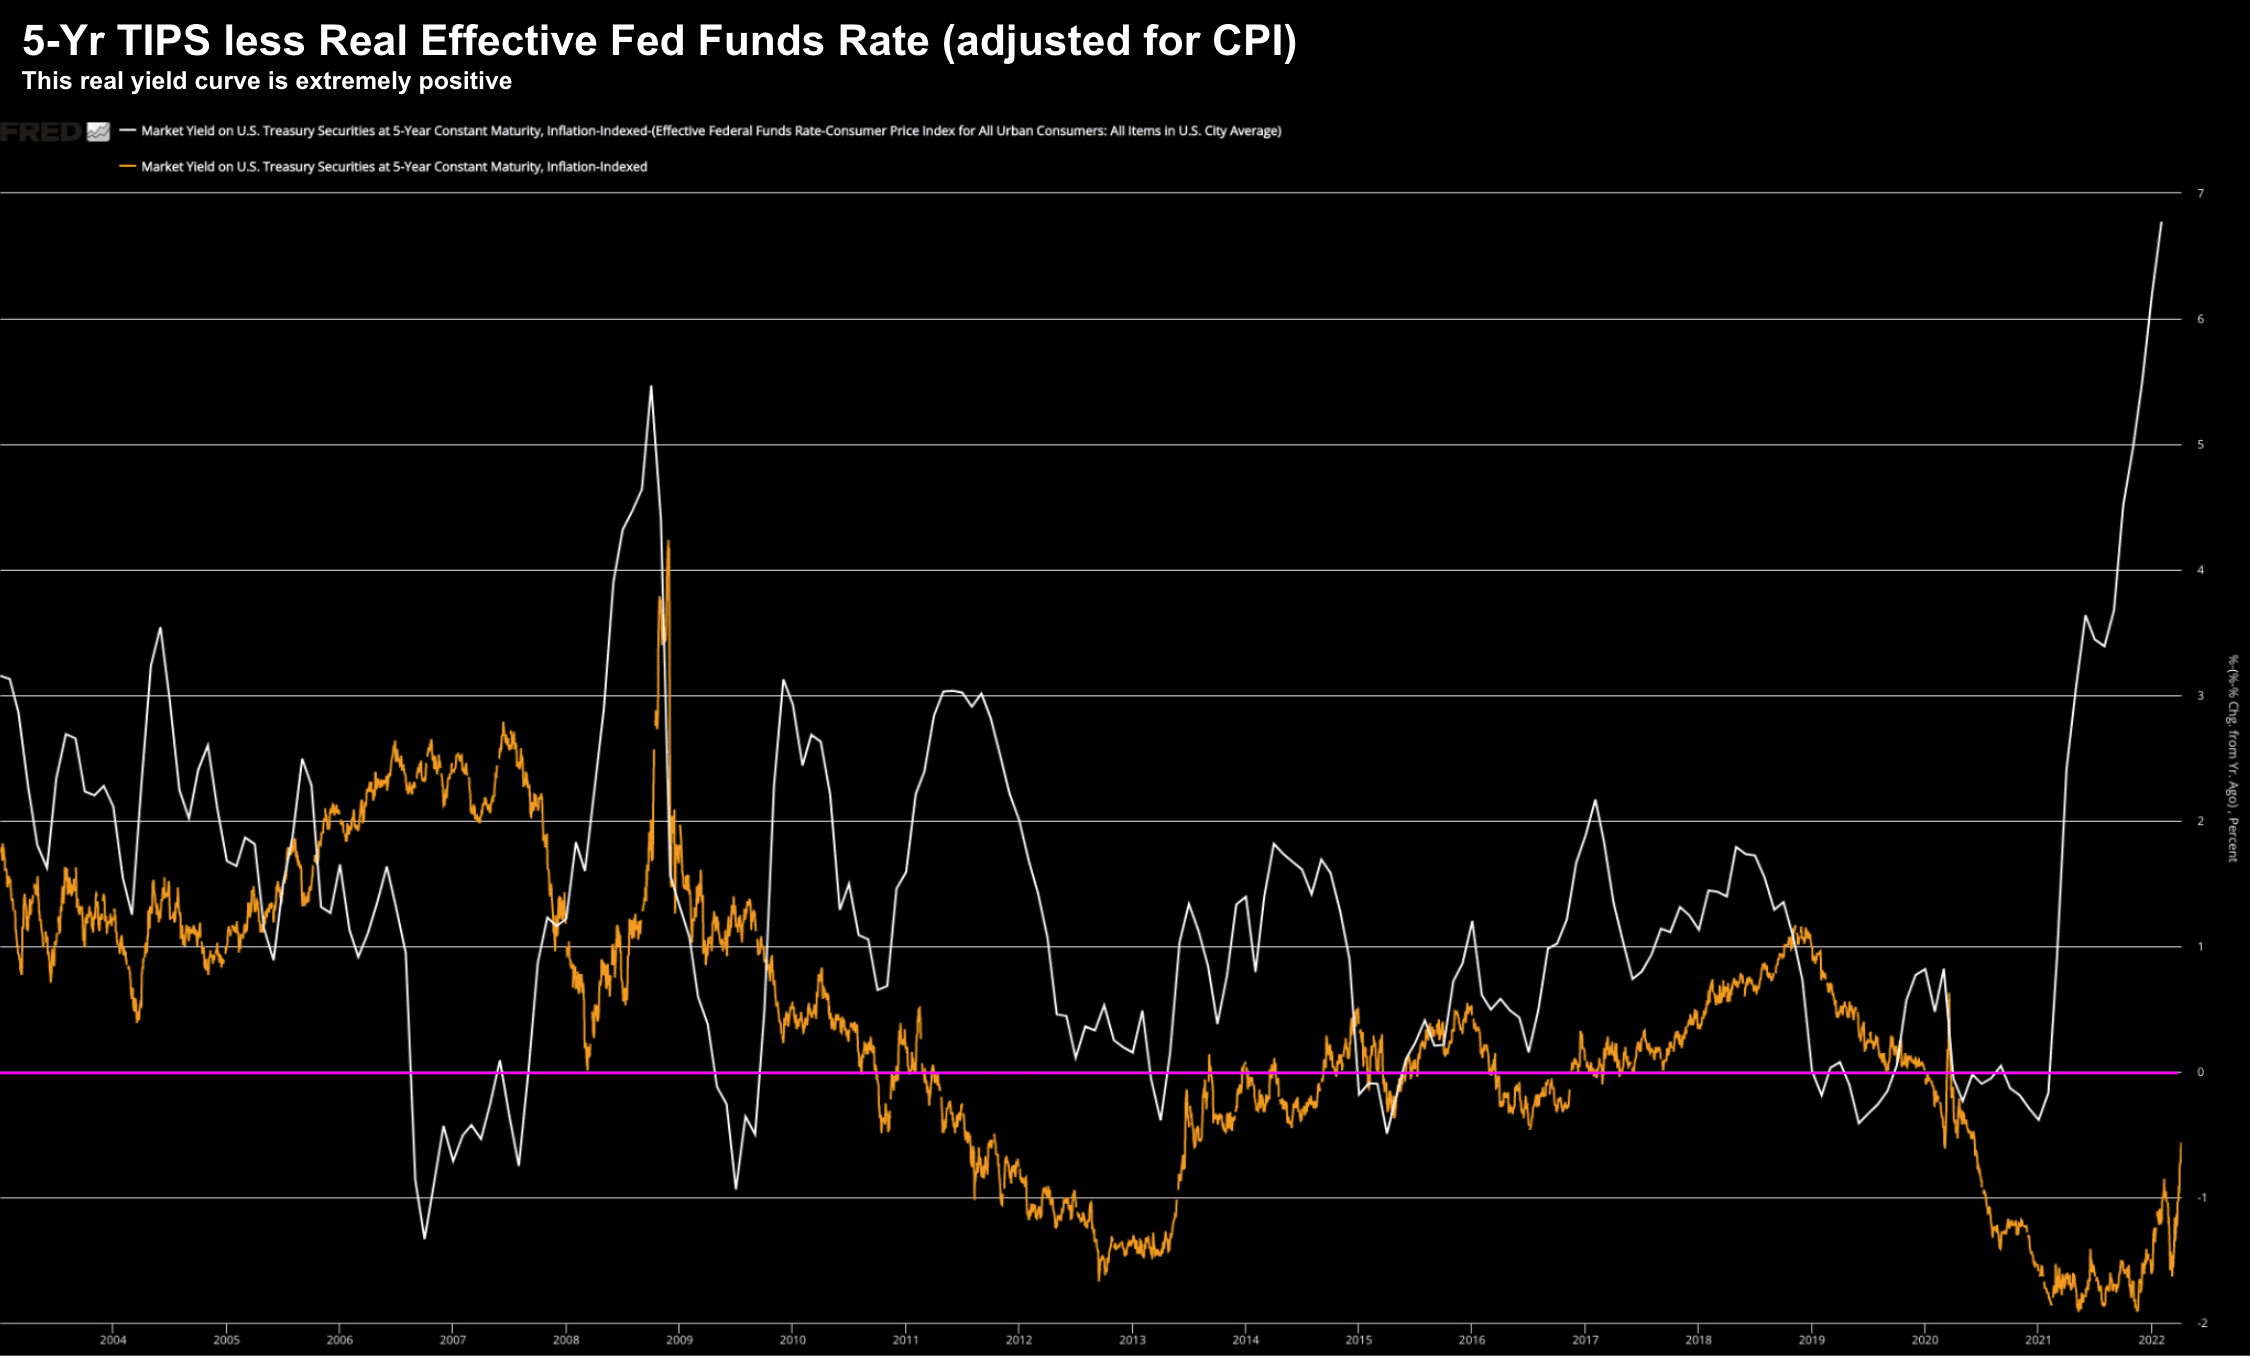
April 10 2022
Note – in this case I"ve calculated real yields using CPI.
For example, if adjusting the Fed funds rate with Core PCE inflation (exc. food and energy) – this curve would be positive 5%+
What this slope demonstrates is two things:
- how much the Fed are behind the "curve" when it comes to inflation; and
- to expect a rapid series of aggressive rate hikes.
Separately, this chart also demonstrates how the Fed had ample scope to tighten months ago.
However, they chose not to (presumably because they thought inflation was transitory)
This was a massive error of judgement.
Regardless, the time to worry will be when the real yield curve flattens.
We are not there yet…
However, when (not if) the 5-Year TIPS (orange) trades below the Real Fed Funds Rate (white) – see the first chart – sound the recession alarm.
Putting it All Together
Based on the above, I don"t see any risk of recession this year.
Not only are monetary conditions ultra-loose – the employment picture remains very strong.
Corporate balance sheets are robust and profits are also strong.
What"s more, there are other indicators such as swap spreads and credit spreads which don"t indicate the onset of a near-term recession.
Note: these are starting to widen – but nothing beyond normal levels.
Yield curves are useful – but they are no panacea.
As mentioned in my preface, pending what durations you choose, you will get a variety of signals.
For me, I will continue to pay close attention to what we see with shorter-term real yields…. and how they trade in relation to say 5-Year TIPS.
As this has a far greater bearing on the real economy when it comes to behaviors such as borrowing and spending.