Trading Per the Script
- October can be a volatile month
- Adding some (more) Apple and Amazon to my portfolio
- Why patience is typically rewarded…
Welcome to October…
And certainly one of the more "opportunistic" months of the year (in my view).
Now October comes with a bad rap…
The reason: it"s a whopping 36% more volatile than the other months (on average).
But don"t let volatility like today scare you…
Embrace it!
For example, if we"re to see a meaningful correction of 10% or more (and I still think we will) – look to add to either:
(a) winning positions; and/or
(b) create new positions in quality companies.
More on that in a moment…
Q4: A Good Record Despite October
Whilst we should "strap in for the ride" over October – the last quarter is typically a strong one for equities.
That"s not to say this quarter will repeat (it may not) – but law of averages suggests it"s higher probability.
According to the Stock Almanac, the S&P 500 has averaged gains of 3.9% for Q4. Furthermore, it has been up four out of every five years since World War II.
That"s a decent record…
For example, this places it as the best quarter of the year (on average).
Q1 is second best with an average gain of 2.3%… with the worst being Q3 at just 0.6%.
Now to today"s example question:
Will Q4 offer us an investable opportunity?
An Investable Opportunity
"The game of speculation is the most uniformly fascinating game in the world. But it is not a game for the stupid, the mentally lazy, the person of inferior emotional balance, or the get-rich-quick adventurer. They will die poor"
– Edwin Lefèvre, "Reminiscences of a Stock Operator"
Not only is "Reminiscences of a Stock Operator" my favourite trading book… it"s also one of my favourite quotes.
Indeed, the game of speculation is one of discipline, hard work, tenacity, learning how to lose, and knowing this is a game of patience.
I often say to people that investing (or trading) is not about your next "10 trades"… it"s about your next "1,000" over the next 20-30 years
I"ve been at the game of asset speculation in stocks (and property) since the mid-1990s…
Through writing this blog for 10+ years (it started in 2011) – those who know me – will tell you I"m neither the "get-rich-quick adventurer" or the "mentally lazy" type.
At least I hope not!
There are no short-cuts to this game. There is only hard work, discipline and "grinding out" what works.
And to that end, my own personal approach (and this will vary for everyone) is to take a longer-term view.
I wait for entry points which maximize my risk/reward.
And earlier this month – I did not think it was in my favour.
In other words, I felt the near-term downside risk (e.g., 10-15%) outweighed the upside.
Now last week I shared the monthly chart for the S&P 500 to offer some perspective:
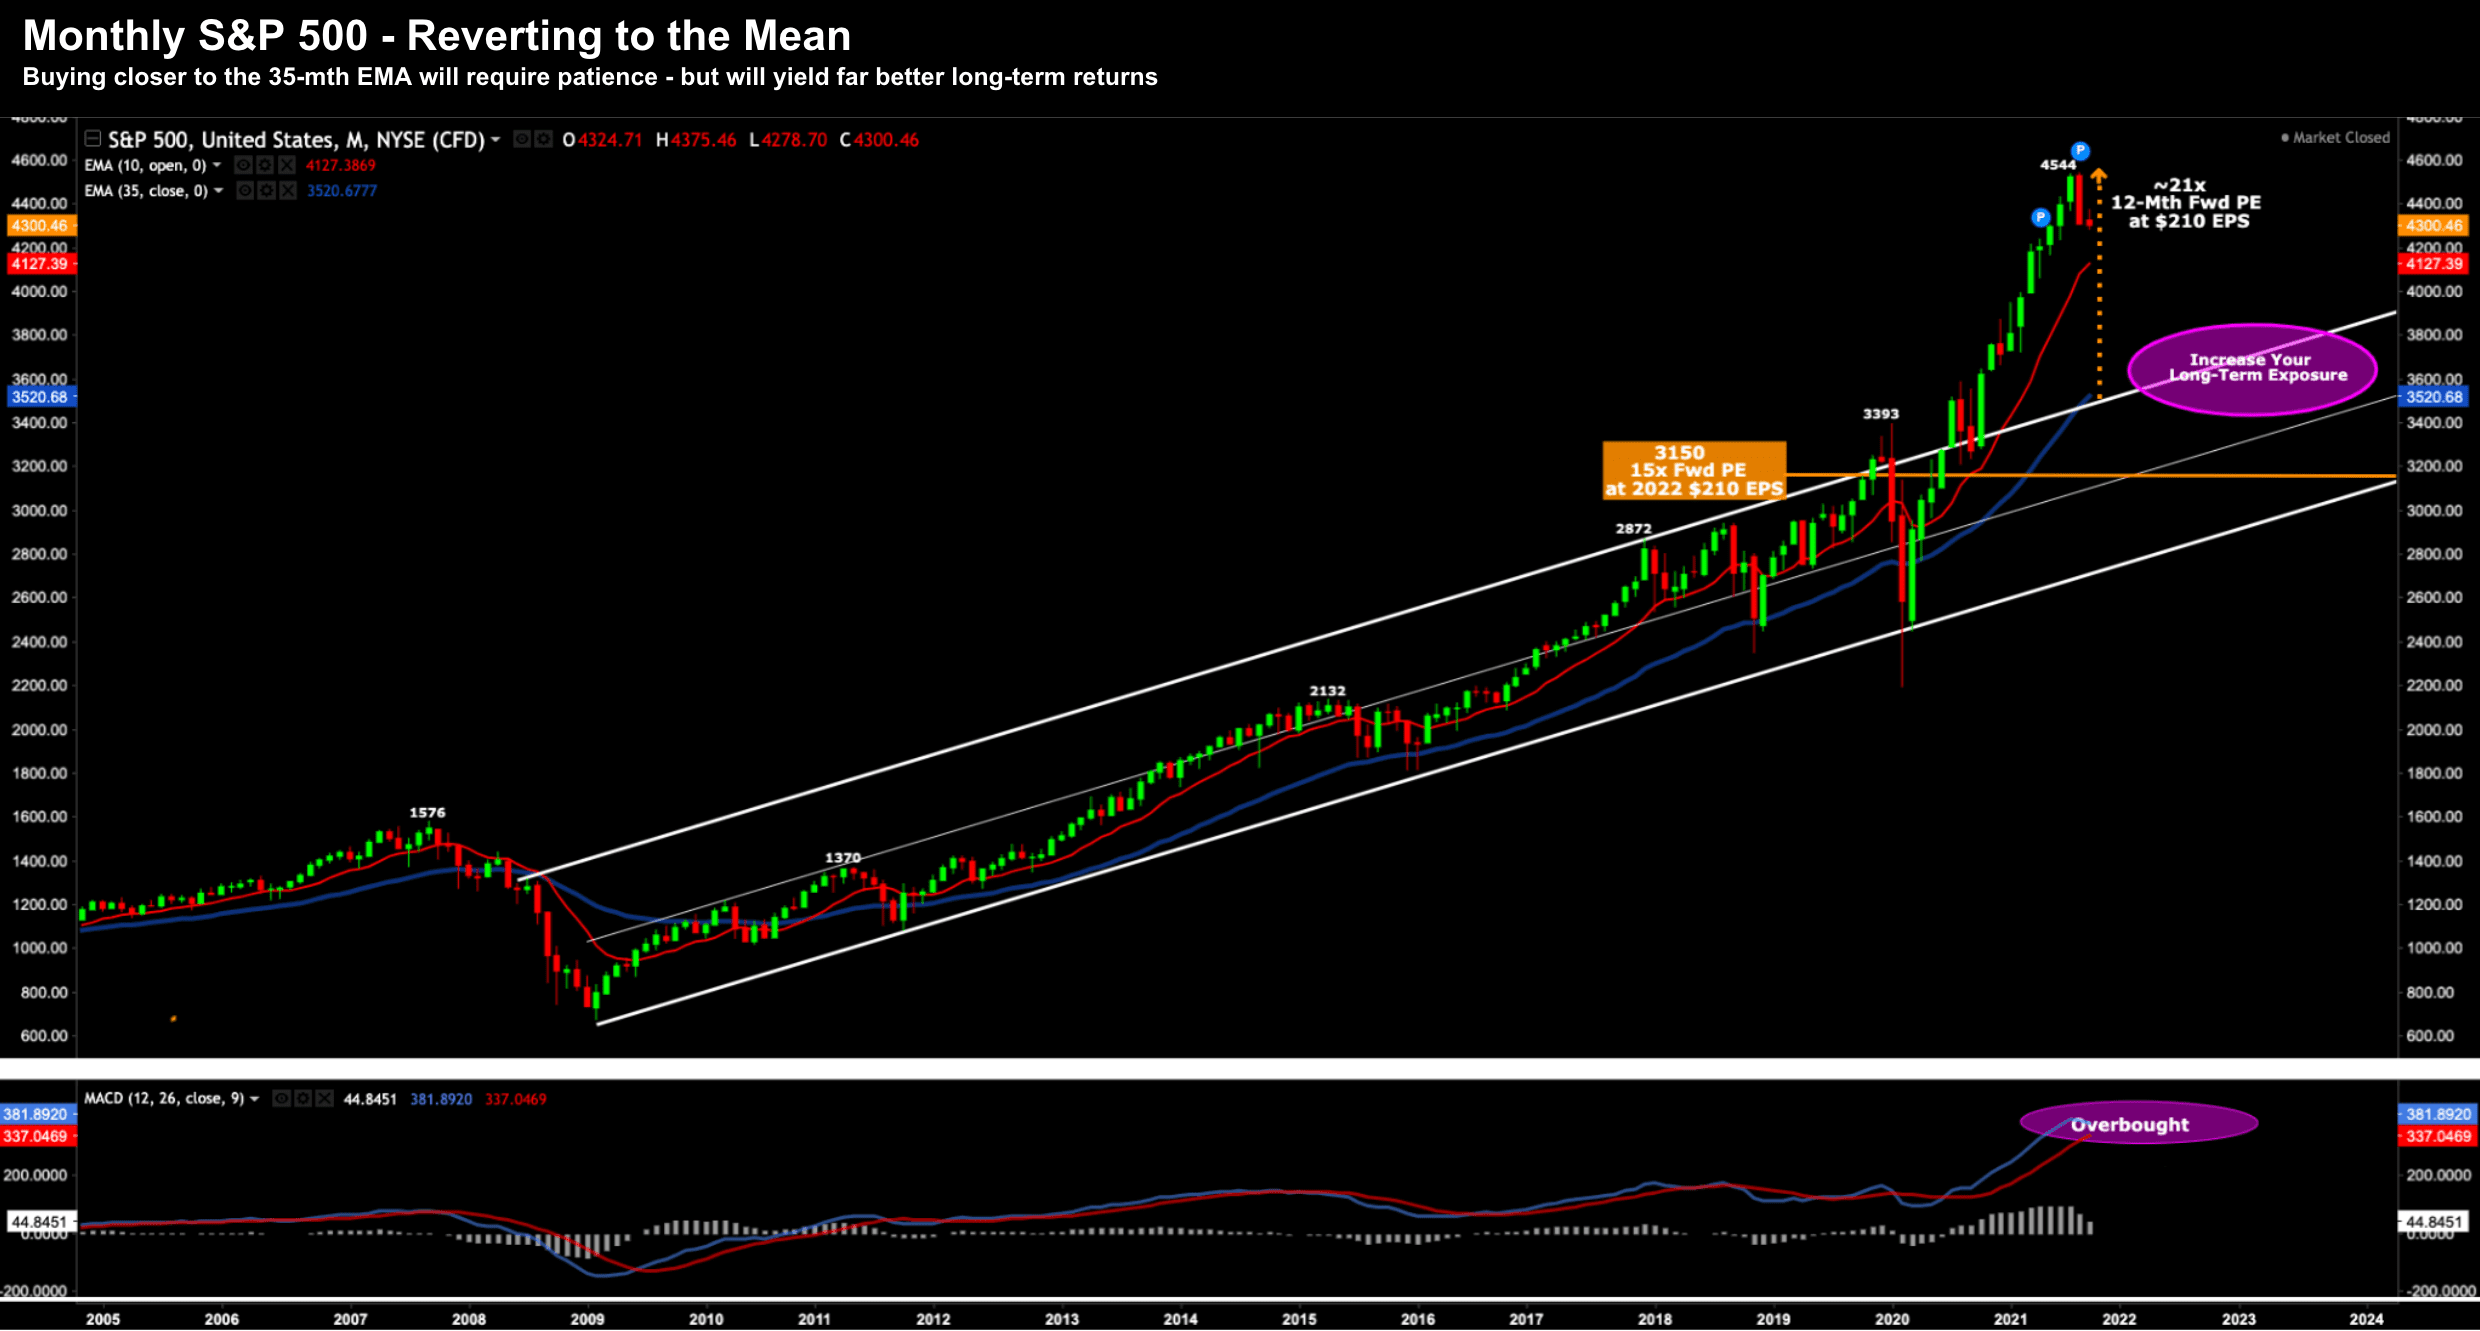
October 04 2021
Now according to Factset, the S&P 500 is trading at ~21x forward Sept 2022 earnings
On the surface you might think that is "excessive".
However, you could equally argue that it"s justified given:
(a) current rates of growth; and more importantly
(b) real rates of interest being negative.
As a reference point, the 200-year average PE for the Index is around 15x.
If were were to assume earnings of ~$210 p/share (Factset"s estimate) – a 15x multiple puts the market at 3150
But that"s a level we are headed to in the near-term…. not even close.
However, I do think:
(a) Earnings growth (or YoY comps) are likely to get much tougher;
(b) GDP is also likely to slow (we are already seeing downgrades); and most importantly
(c) interest rates are likely to rise over the next 1-2+ years
Put this together and the multiples will come down.
In other words, a forward PE of 21x may come to down say "19x" (or less)
For example, 19 x $210 = $3,990
Buy at a "Discount" for the Long-Term
Last week, I shared a table which showed CAGRs (Compound Annual Growth Rates) for the S&P 500 over the past 50 years.
I drew examples (from the end of September) for each of 1971, "81, "91, "01 and "11 through today.
The Index average CAGR was just above 10% if we assume an average dividend of 1.5%
As an aside, that"s not bad given there are many "top" hedge funds that fail to match that kind of return year-in-year-out over a similar timeframe.
Case in point: Warren Buffett won $1M taking exactly that bet.
In 2008, Warren Buffett issued a challenge to the hedge fund industry, which in his view charged exorbitant fees that the funds" performances couldn"t justify. Protégé Partners LLC accepted, and the two parties placed a million-dollar bet.
Buffett has won the bet, Ted Seides wrote in a Bloomberg op-ed in May. The Protégé co-founder, who left in the fund in 2015, conceded defeat ahead of the contest"s scheduled wrap-up on December 31, 2017, writing, "for all intents and purposes, the game is over. I lost."
Buffett"s ultimately successful contention was that, including fees, costs and expenses, an S&P 500 index fund would outperform a hand-picked portfolio of hedge funds over 10 years. The bet pit two basic investing philosophies against each other: passive and active investing.
I digress…
But let"s stick with the "passive" theme..
And let"s also assume you bought near the peak of the dot.com bubble – your CAGR sank considerably (i.e.~5.5% exclusive of dividends over 20 years)
To illustrate this point, take a look at the chart below. I"ve labelled 4 sample entry points for the purpose of the illustration:
- Sept 2000 (pre-crash)
- Sept 2001 (mid-way during crash)
- Sept 2007 (near the peak)
- Sept 2008 (mid-way during the crash)
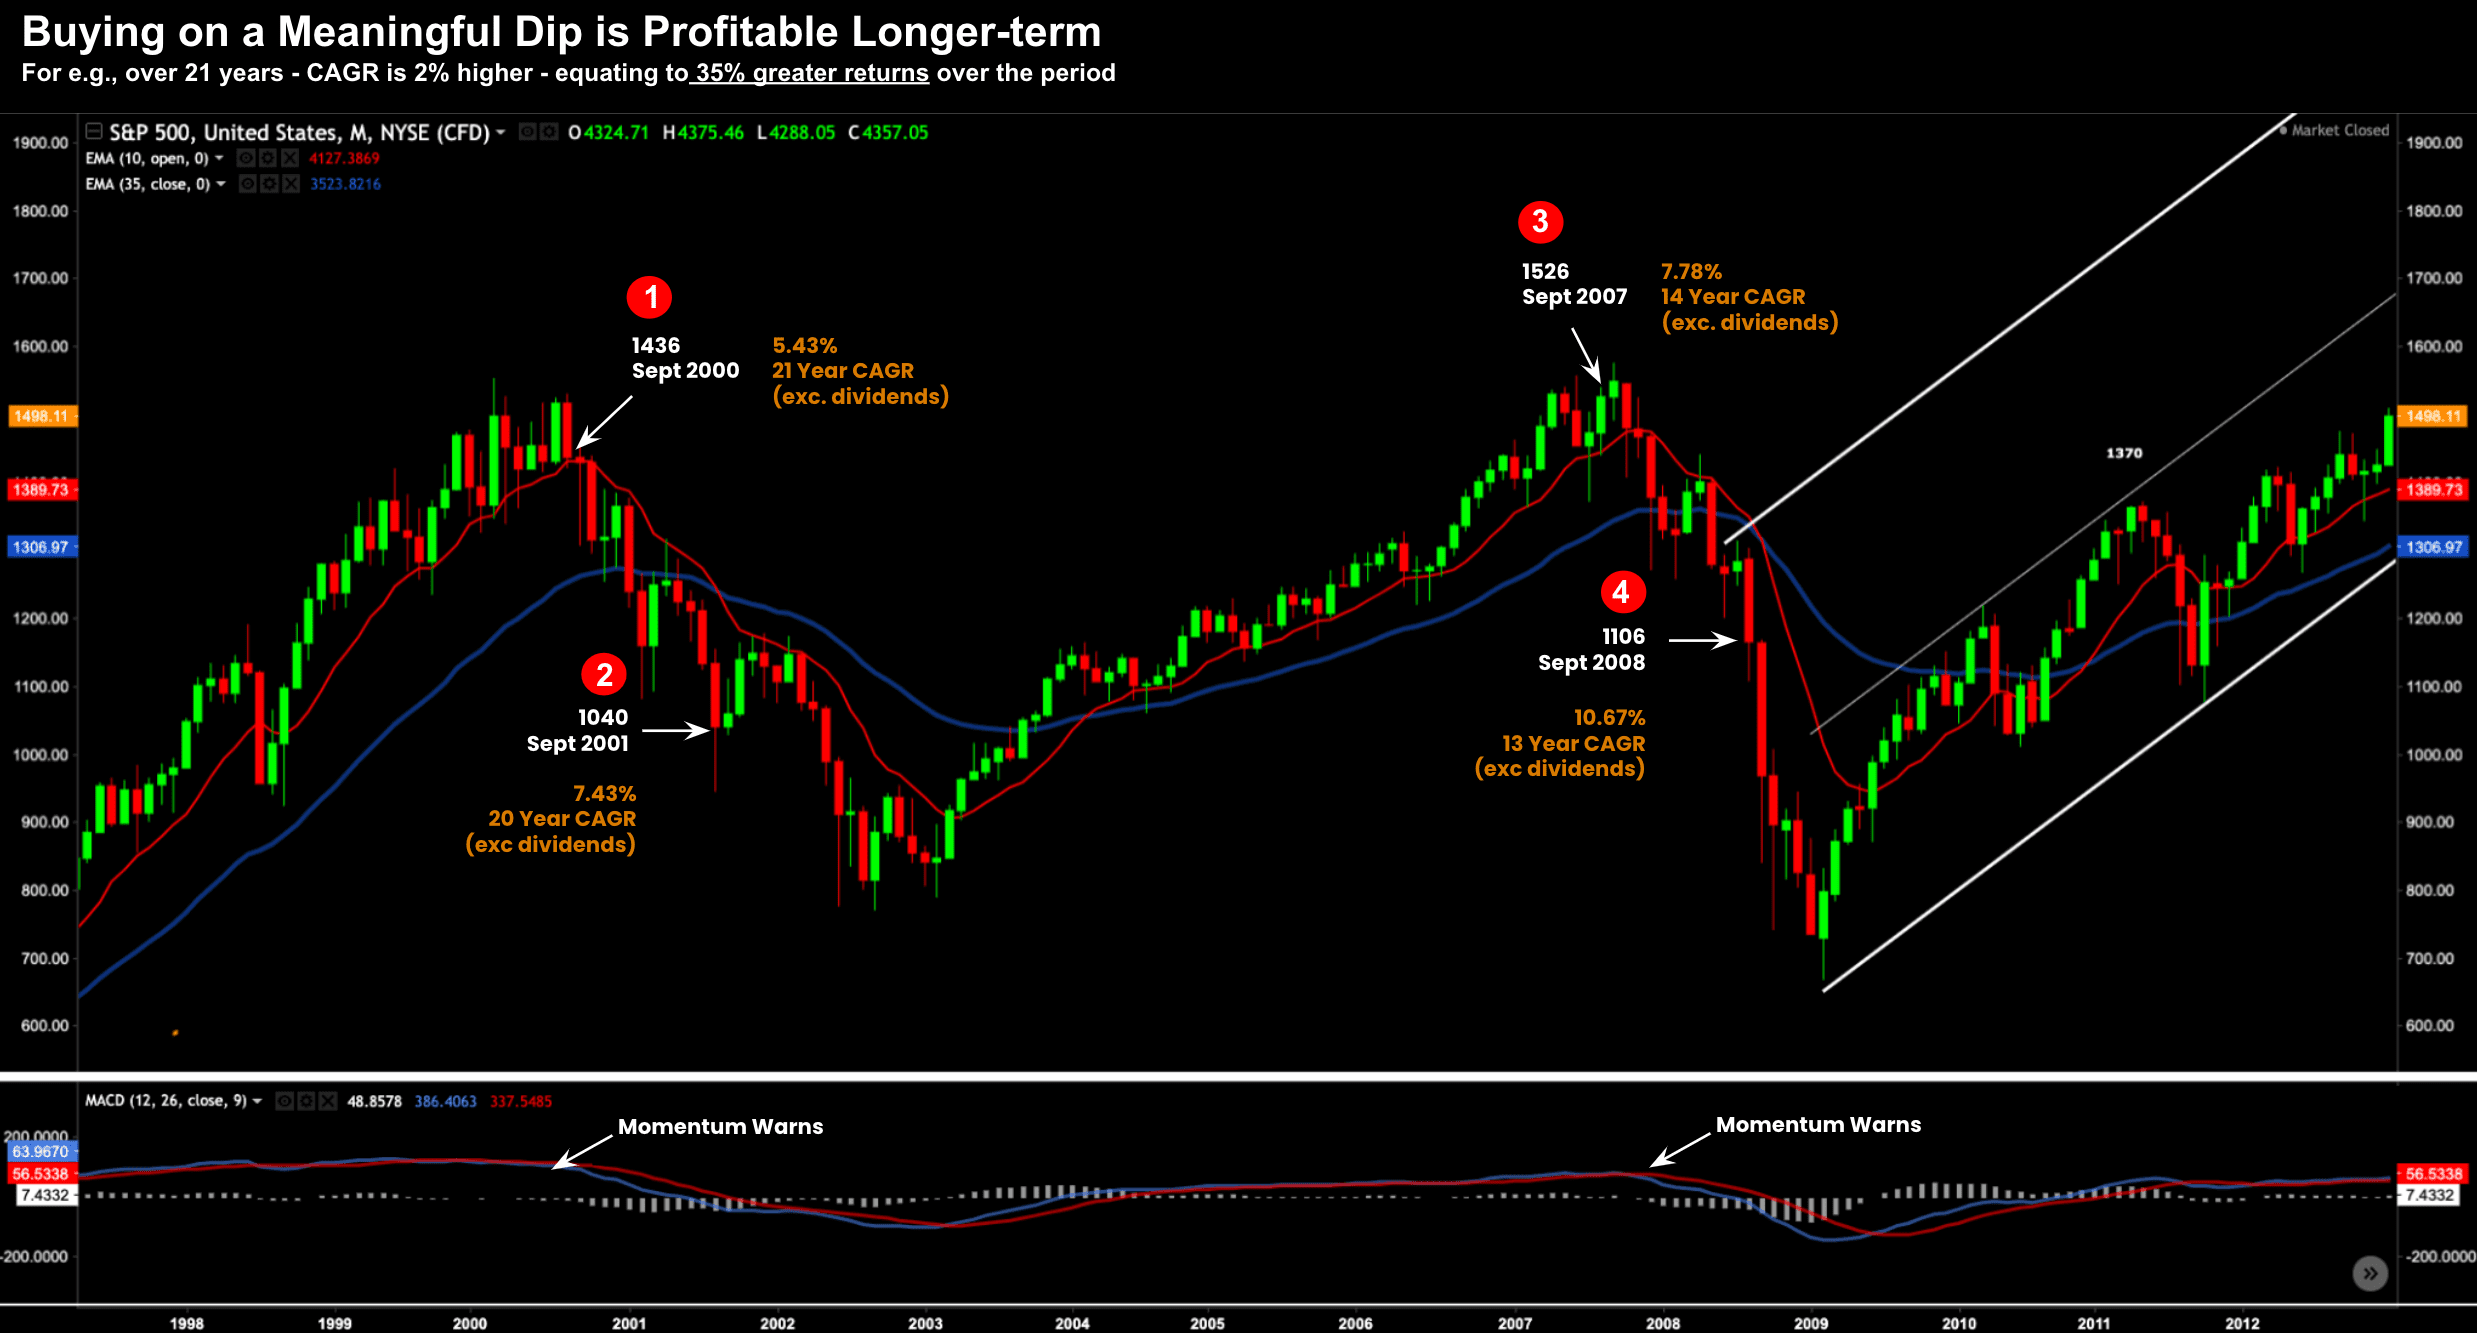
Buying on a Pullback (longer-term) Pays Dividends
The table below shows the respective CAGRs at each of these 4 entry-points (illustrated by an example investment of $100,000)
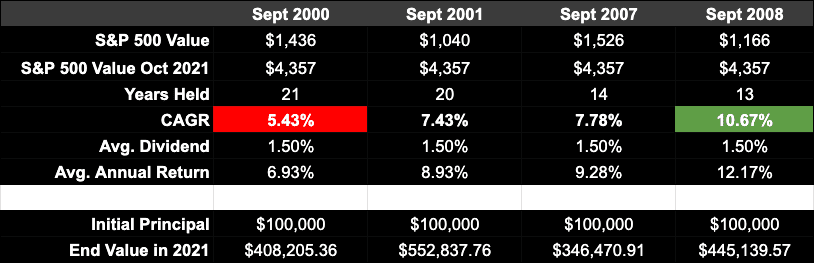
If you invested during the correction of 2001 (half-way through the correction; i.e. not at the bottom) — this returned 35% more than investing near the dot.com peak (i.e. $552K vs $408K resultant capital if initially investing $100,000)
We find something similar buying the correction of 2008. Here, we see a 10.67% CAGR (exclusive of dividends) vs just 7.78% buying near the peak.
Which brings me to today…
I think we"re moving towards a meaningful (e.g., 10% or more) buying correction.
Now my call for this may not be right… but it feels like we"re getting closer.
Below is the weekly chart (after today"s activity)
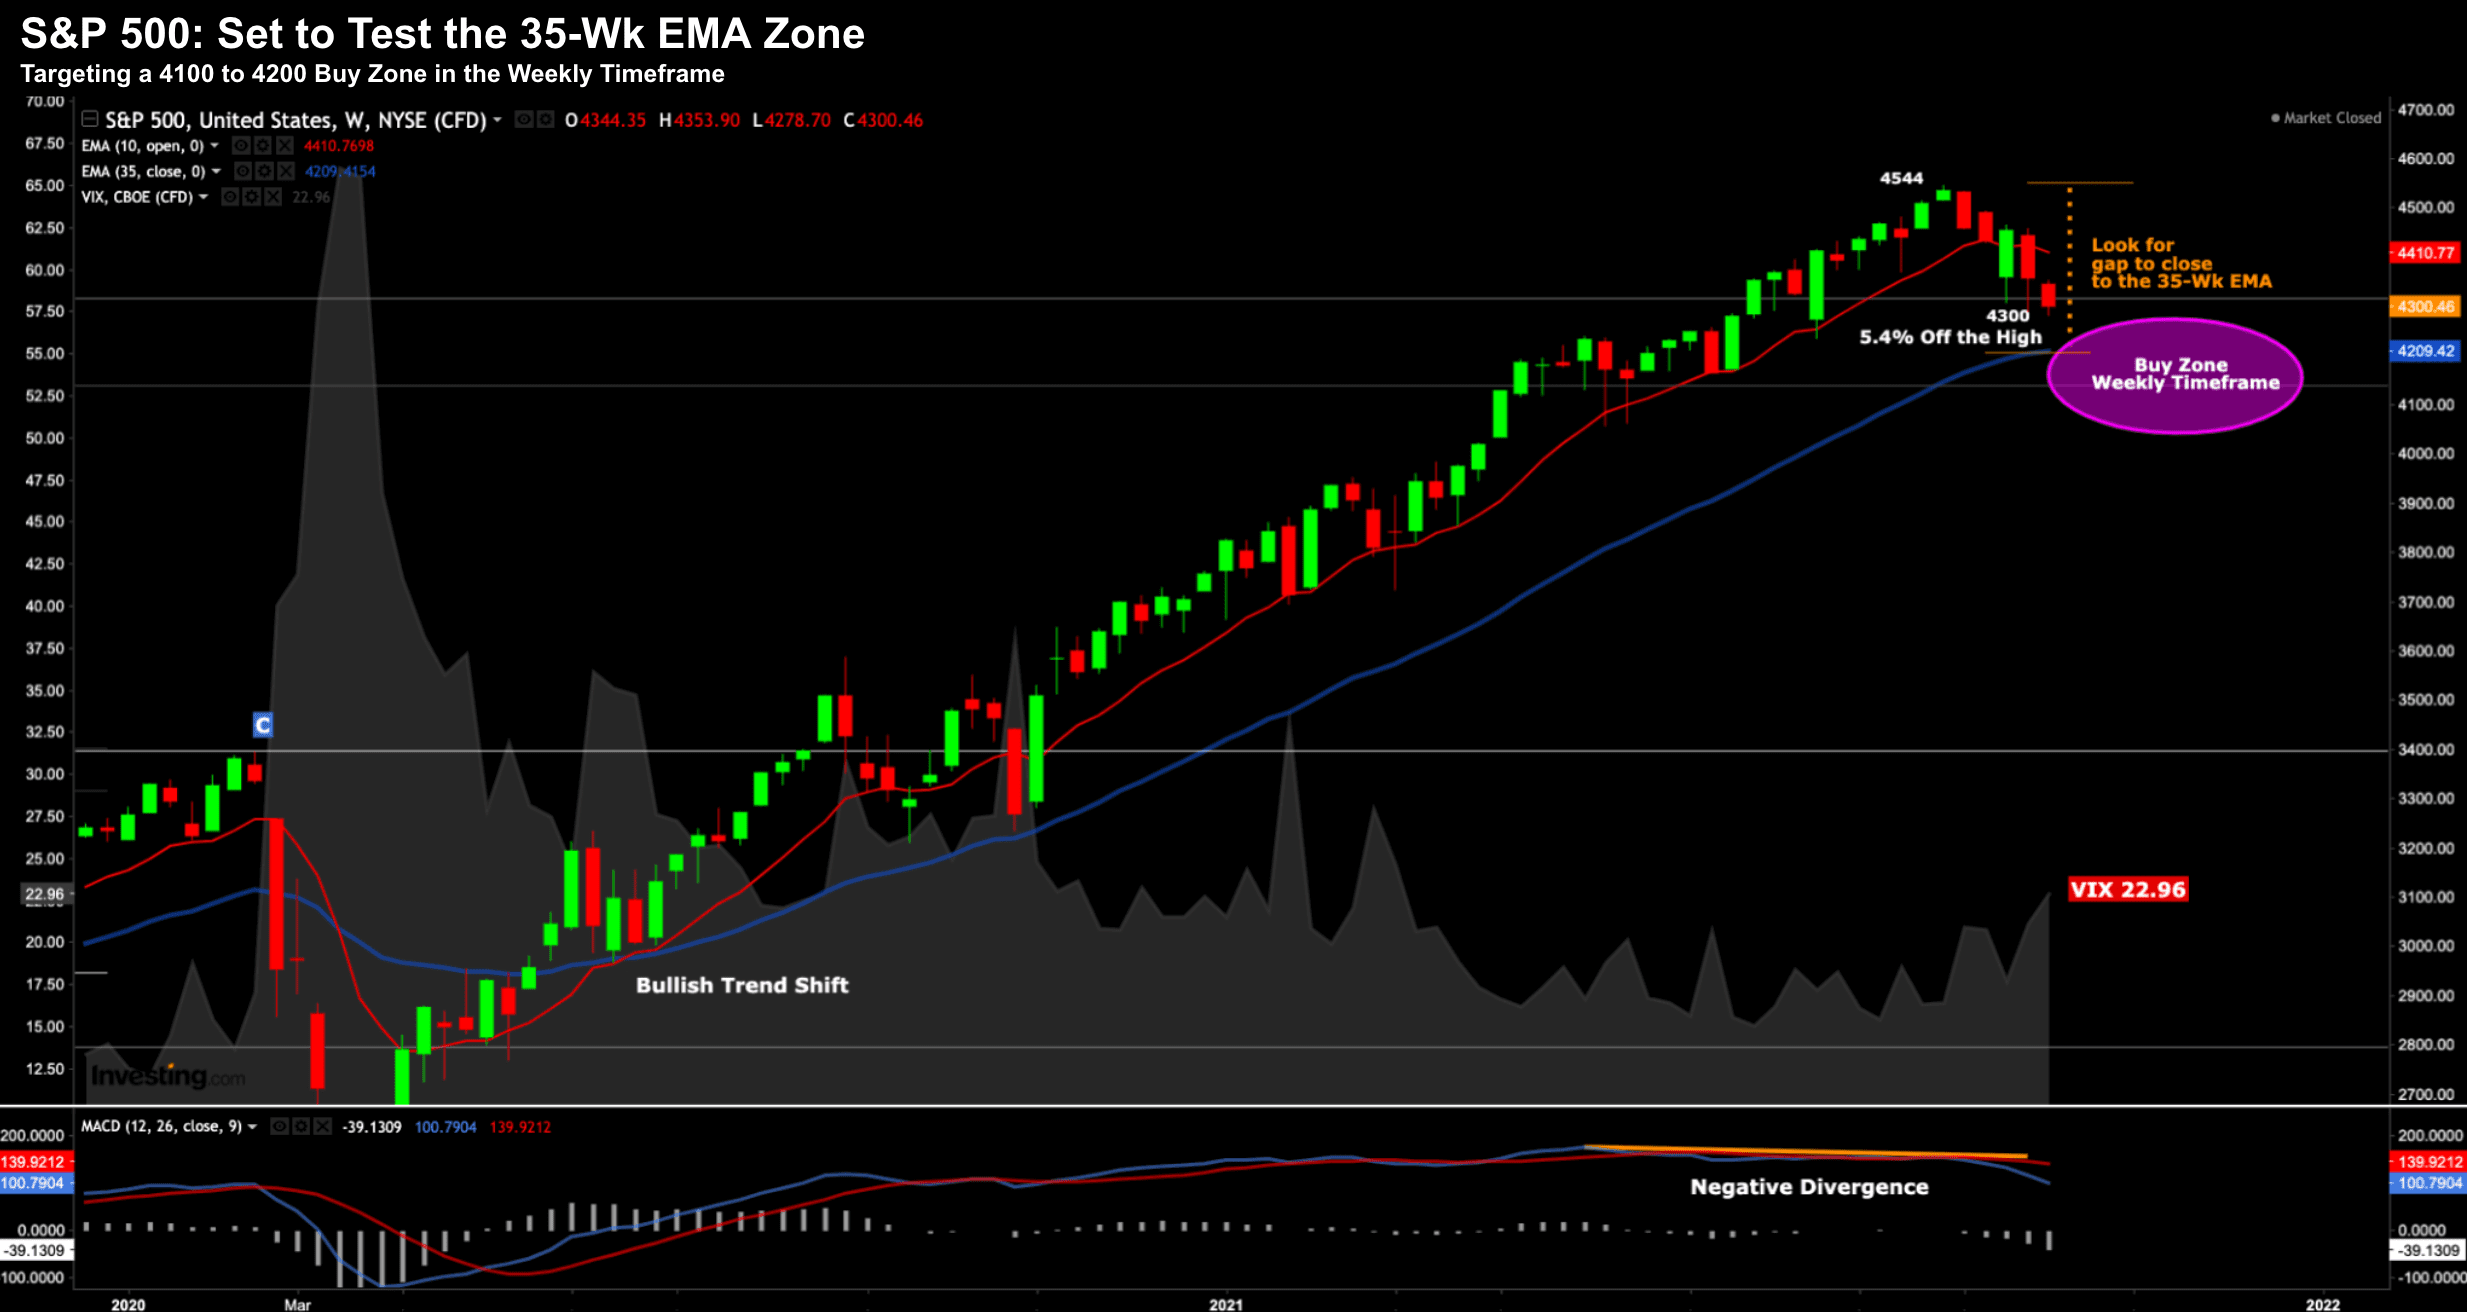
Oct 04 2021
We are still only 5.4% off the highs.
That"s not much in the grand scheme of things – despite the headlines screaming "market sell-off".
Now if the market was off 10-15% – I might give them some credence to the description "sell-off"
But hey – media is about monetization of eyeballs – and "market selloff" is a headline more likely to drive clicks!
I digress…
My best guess (and I don"t pretend to be Nostradamus) is we will test the 4100 to 4200 zone in the coming weeks.
We may even get a little more than that…
And if you"re trading using a weekly timeframe – I think it"s a decent risk/reward opportunity.
Again, note the sharply correcting MACD in the lower window… this is what warned of potential weakness.
This told me the buyers were no longer lining up (as they once were) and strength was being sold.
But at some point, this equation will shift.
Putting it All Together…
Now today I nibbled at two trades…
I added some Apple and Amazon stock (both in my long-term hold portfolio)
And whilst I think we"re not immune from more downside in tech (e.g. should we see yields continue to sharply rise) — their levels are far more attractive than say a few weeks ago.
Below is the weekly chart for Apple – now trading very close to its 35-week EMA (and ~13% off its high)
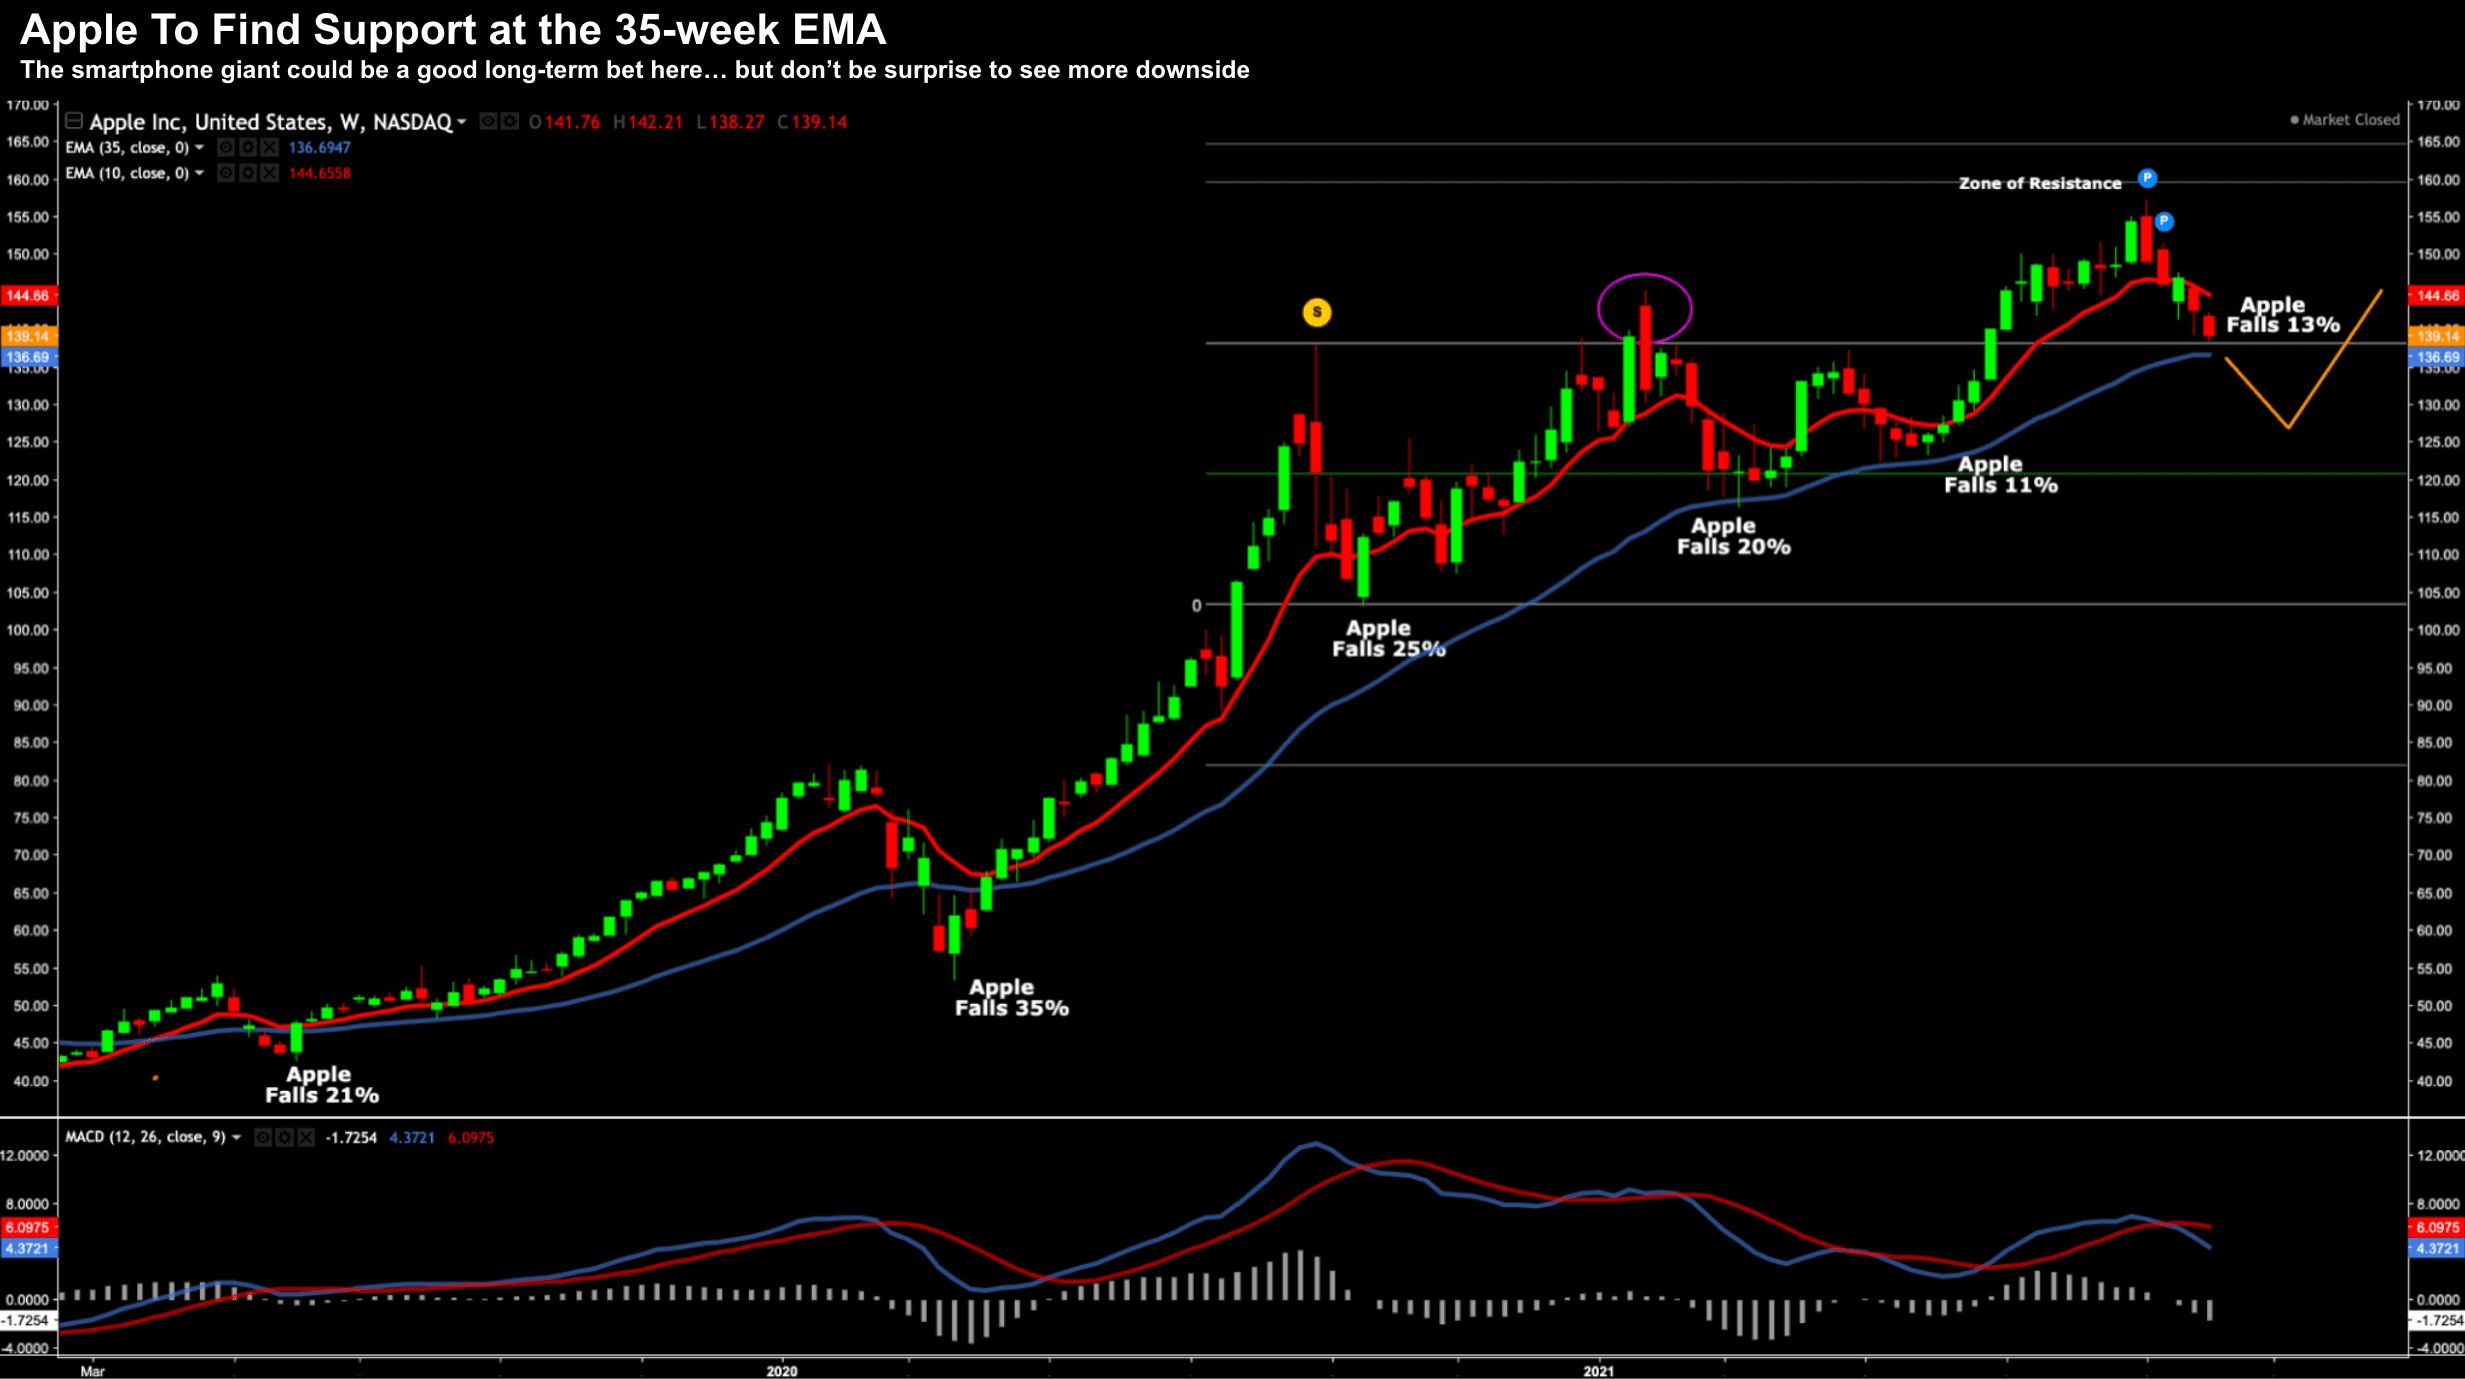
Oct 04 2021
And if Apple falls to about $120 (long-term support) – I will likely add a little more.
Note: I"ve circled the major high of Jan 2021 – as I"m looking for support in this zone. Previous levels of resistance can often act as support. However, if this breaks, it could be a quick trip lower.
For what it"s worth – Apple is currently 10% of my total portfolio – my second largest holding after Google.
From an Index perspective, I would like to see another 5% downside.
And if we see that, I will start adding more exposure to the Index via the SPY ETF.