Bear Market Rally… For Now
- The price we"re paying for ~$10 Trillion borrowed
- A lot of demand has been pulled forward
- Bear market rally until proven otherwise
Despite Friday"s rally, the S&P 500 hit its longest weekly losing streak since 2011.
The Dow Jones Industrial Average tracked its first 7-week losing streak since 2001.
What goes up must come down…
Which brings me today"s exam question:
- is the stock market bottom in for 2022? or
- is this a typicall (sharp) bear market rally?
My answer: the latter until proven otherwise.
Let"s start with the S&P 500 and what we could see next.
And I will follow with why "lower lows" are not out of the question this year (as I assess the market fundamentally and technically).
7 Week Losing Streak
2021 was an unusual year in many ways.
For example, we only experienced two very modest pullbacks all year – both approx 7%
In addition, the S&P 500 spent almost 75% of the year in what technicians call "overbought" territory – where the RSI traded above 70.
It was the one of the "most hated" rallies in near-term memory. I say that because those waiting to buy on a pullback missed out… with the S&P 500 gaining 28% for the year.
Not now…
May 13 2022
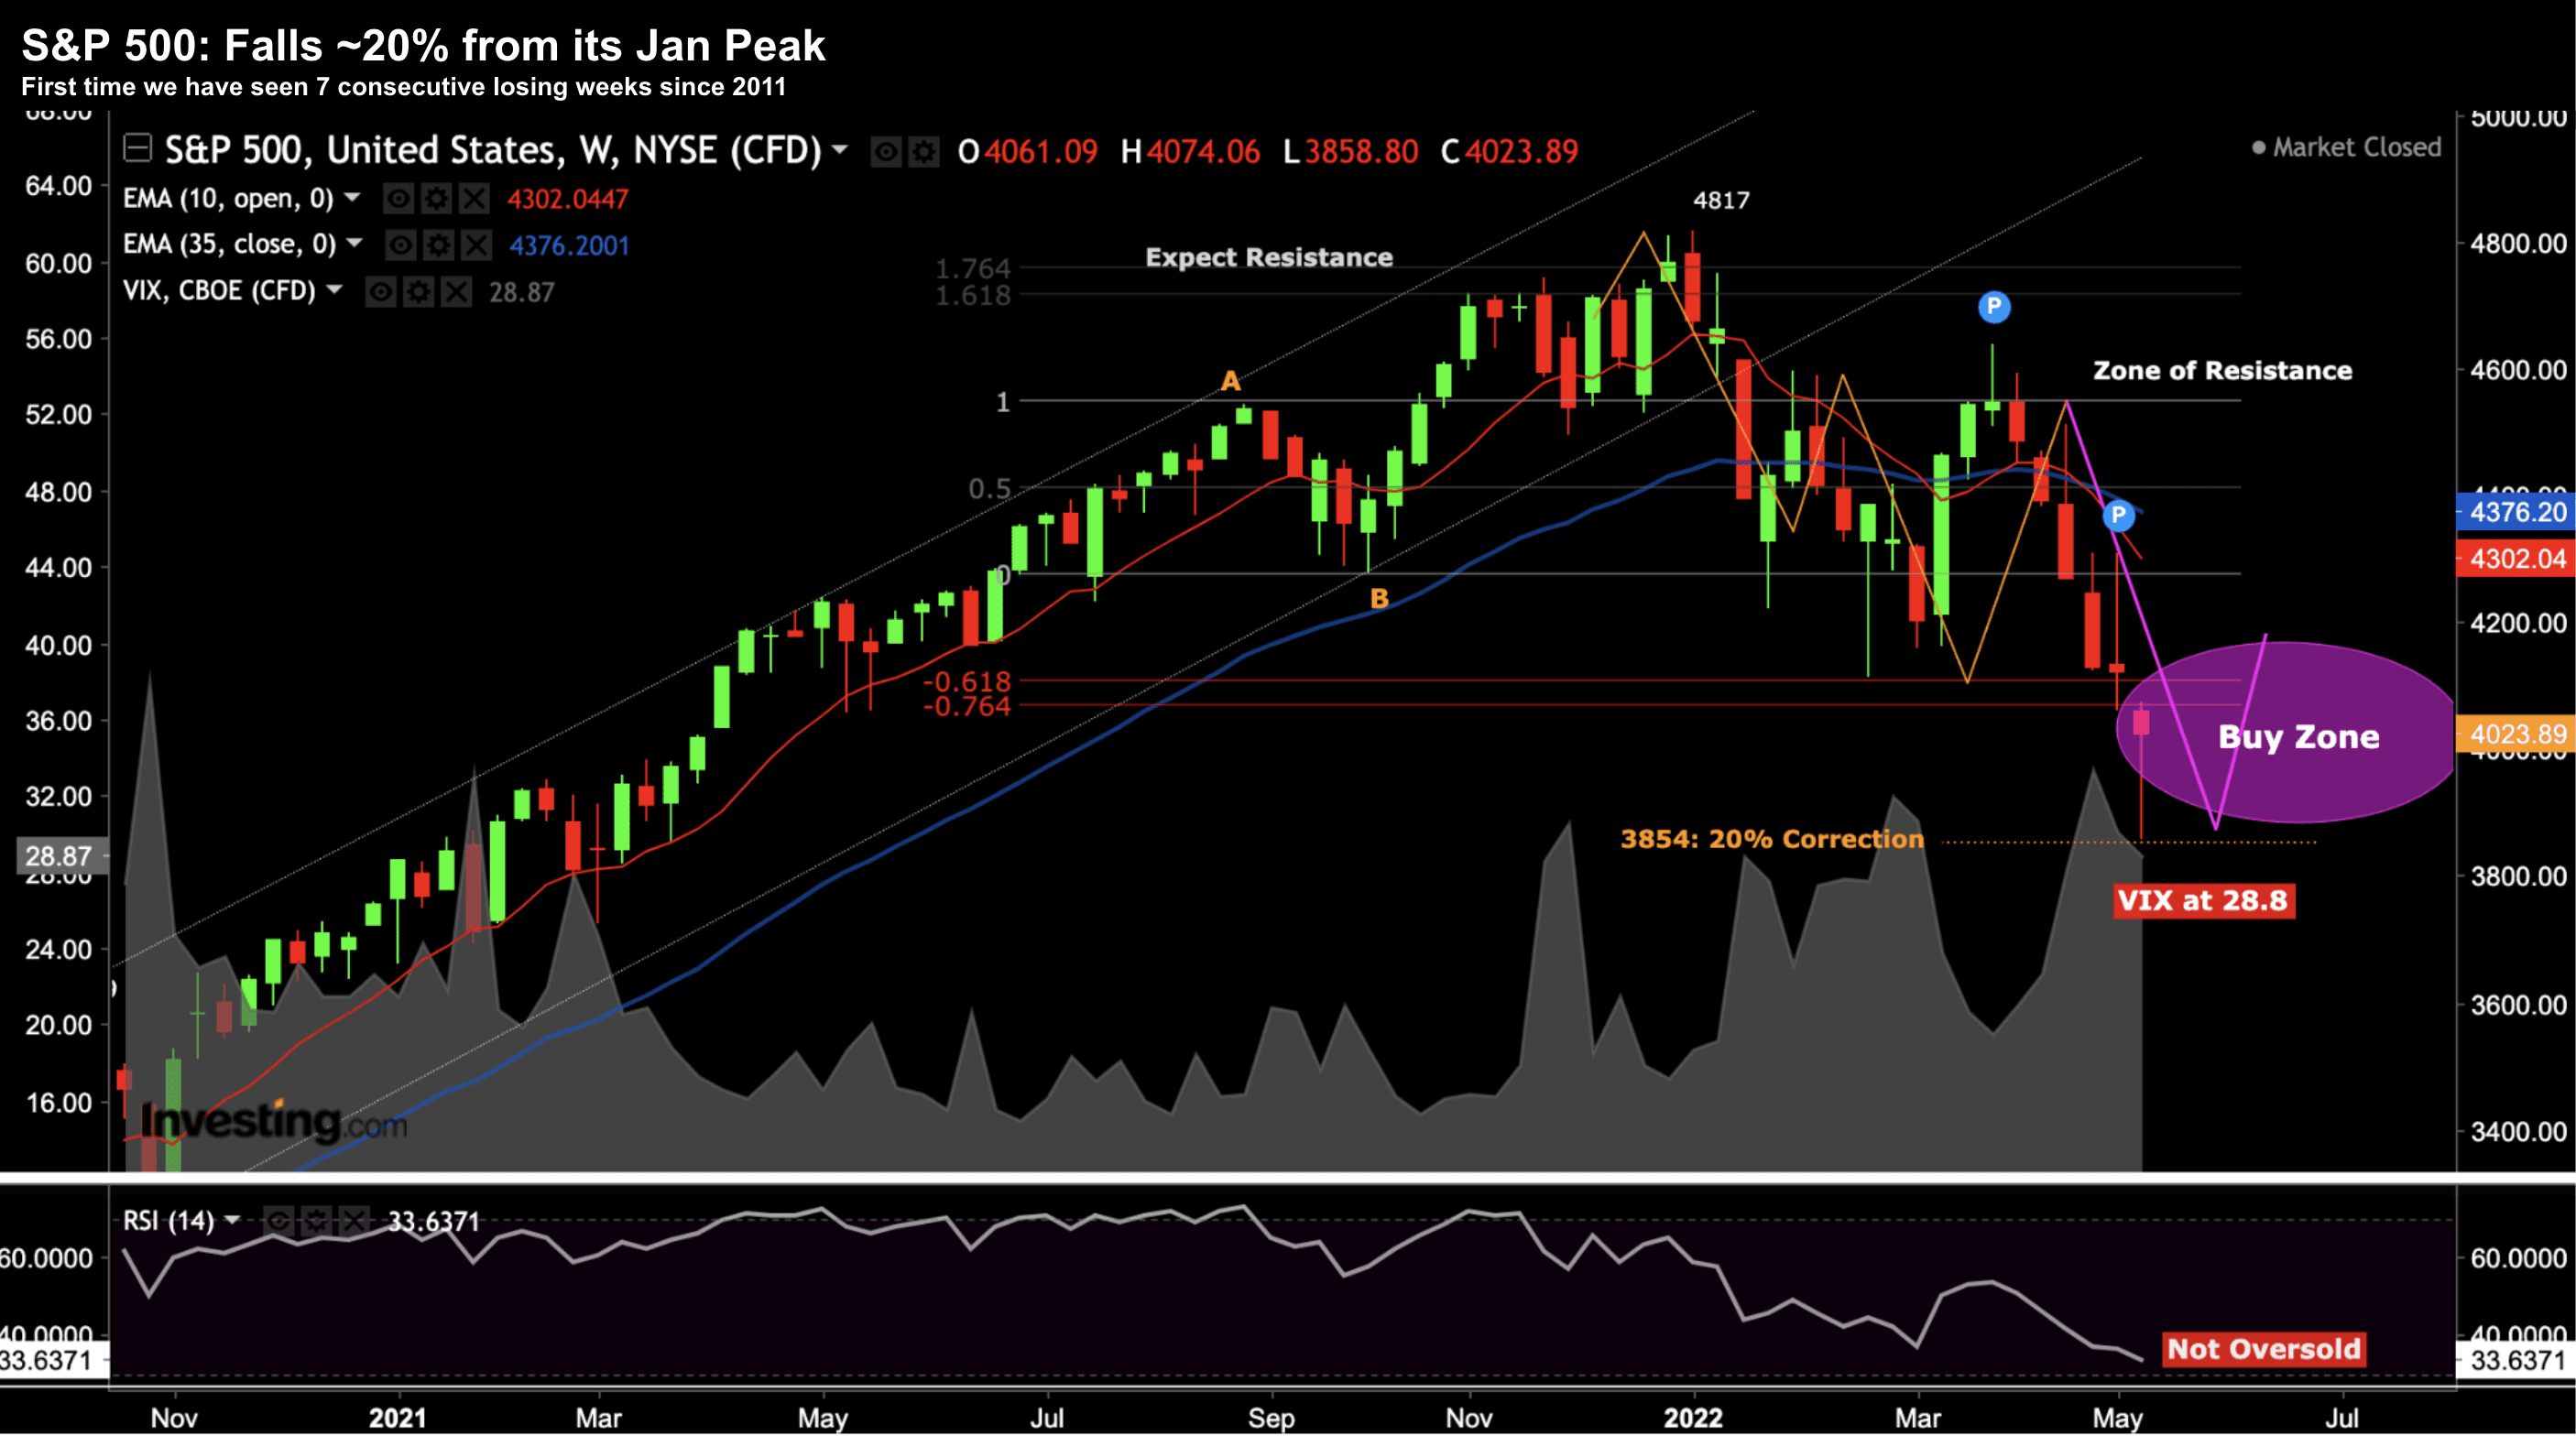
The S&P 500 has now pulled back ~20% from its early Jan high of 4817.
And this has us trading in what I consider a buy-zone (and where I think we could see near-term support)
However, that"s not to say we cannot go lower.
I think we do.
For example, if I look at the VIX (trading around 28) and the RSI (lower window above) — we have not seen either (a) panic selling; or (b) oversold conditions.
That said, I also believe the market is set up for a near-term bounce.
For example, the 10-week EMA (red line) trades around 4300. From mine, something in the realm of 4200 to 4300 is likely over the coming weeks.
However, that"s where the market is likely to find selling pressure… as traders (and investors) holding losing (or weak) positions use the opportunity to exit at a better price.
What Goes Up Must Come Down
November last year I expressed my concern that things were over-extended (fundamentally and technically).
For example, I share the monthly time frame below (Nov 27) and what I felt could be a sharp move lower:
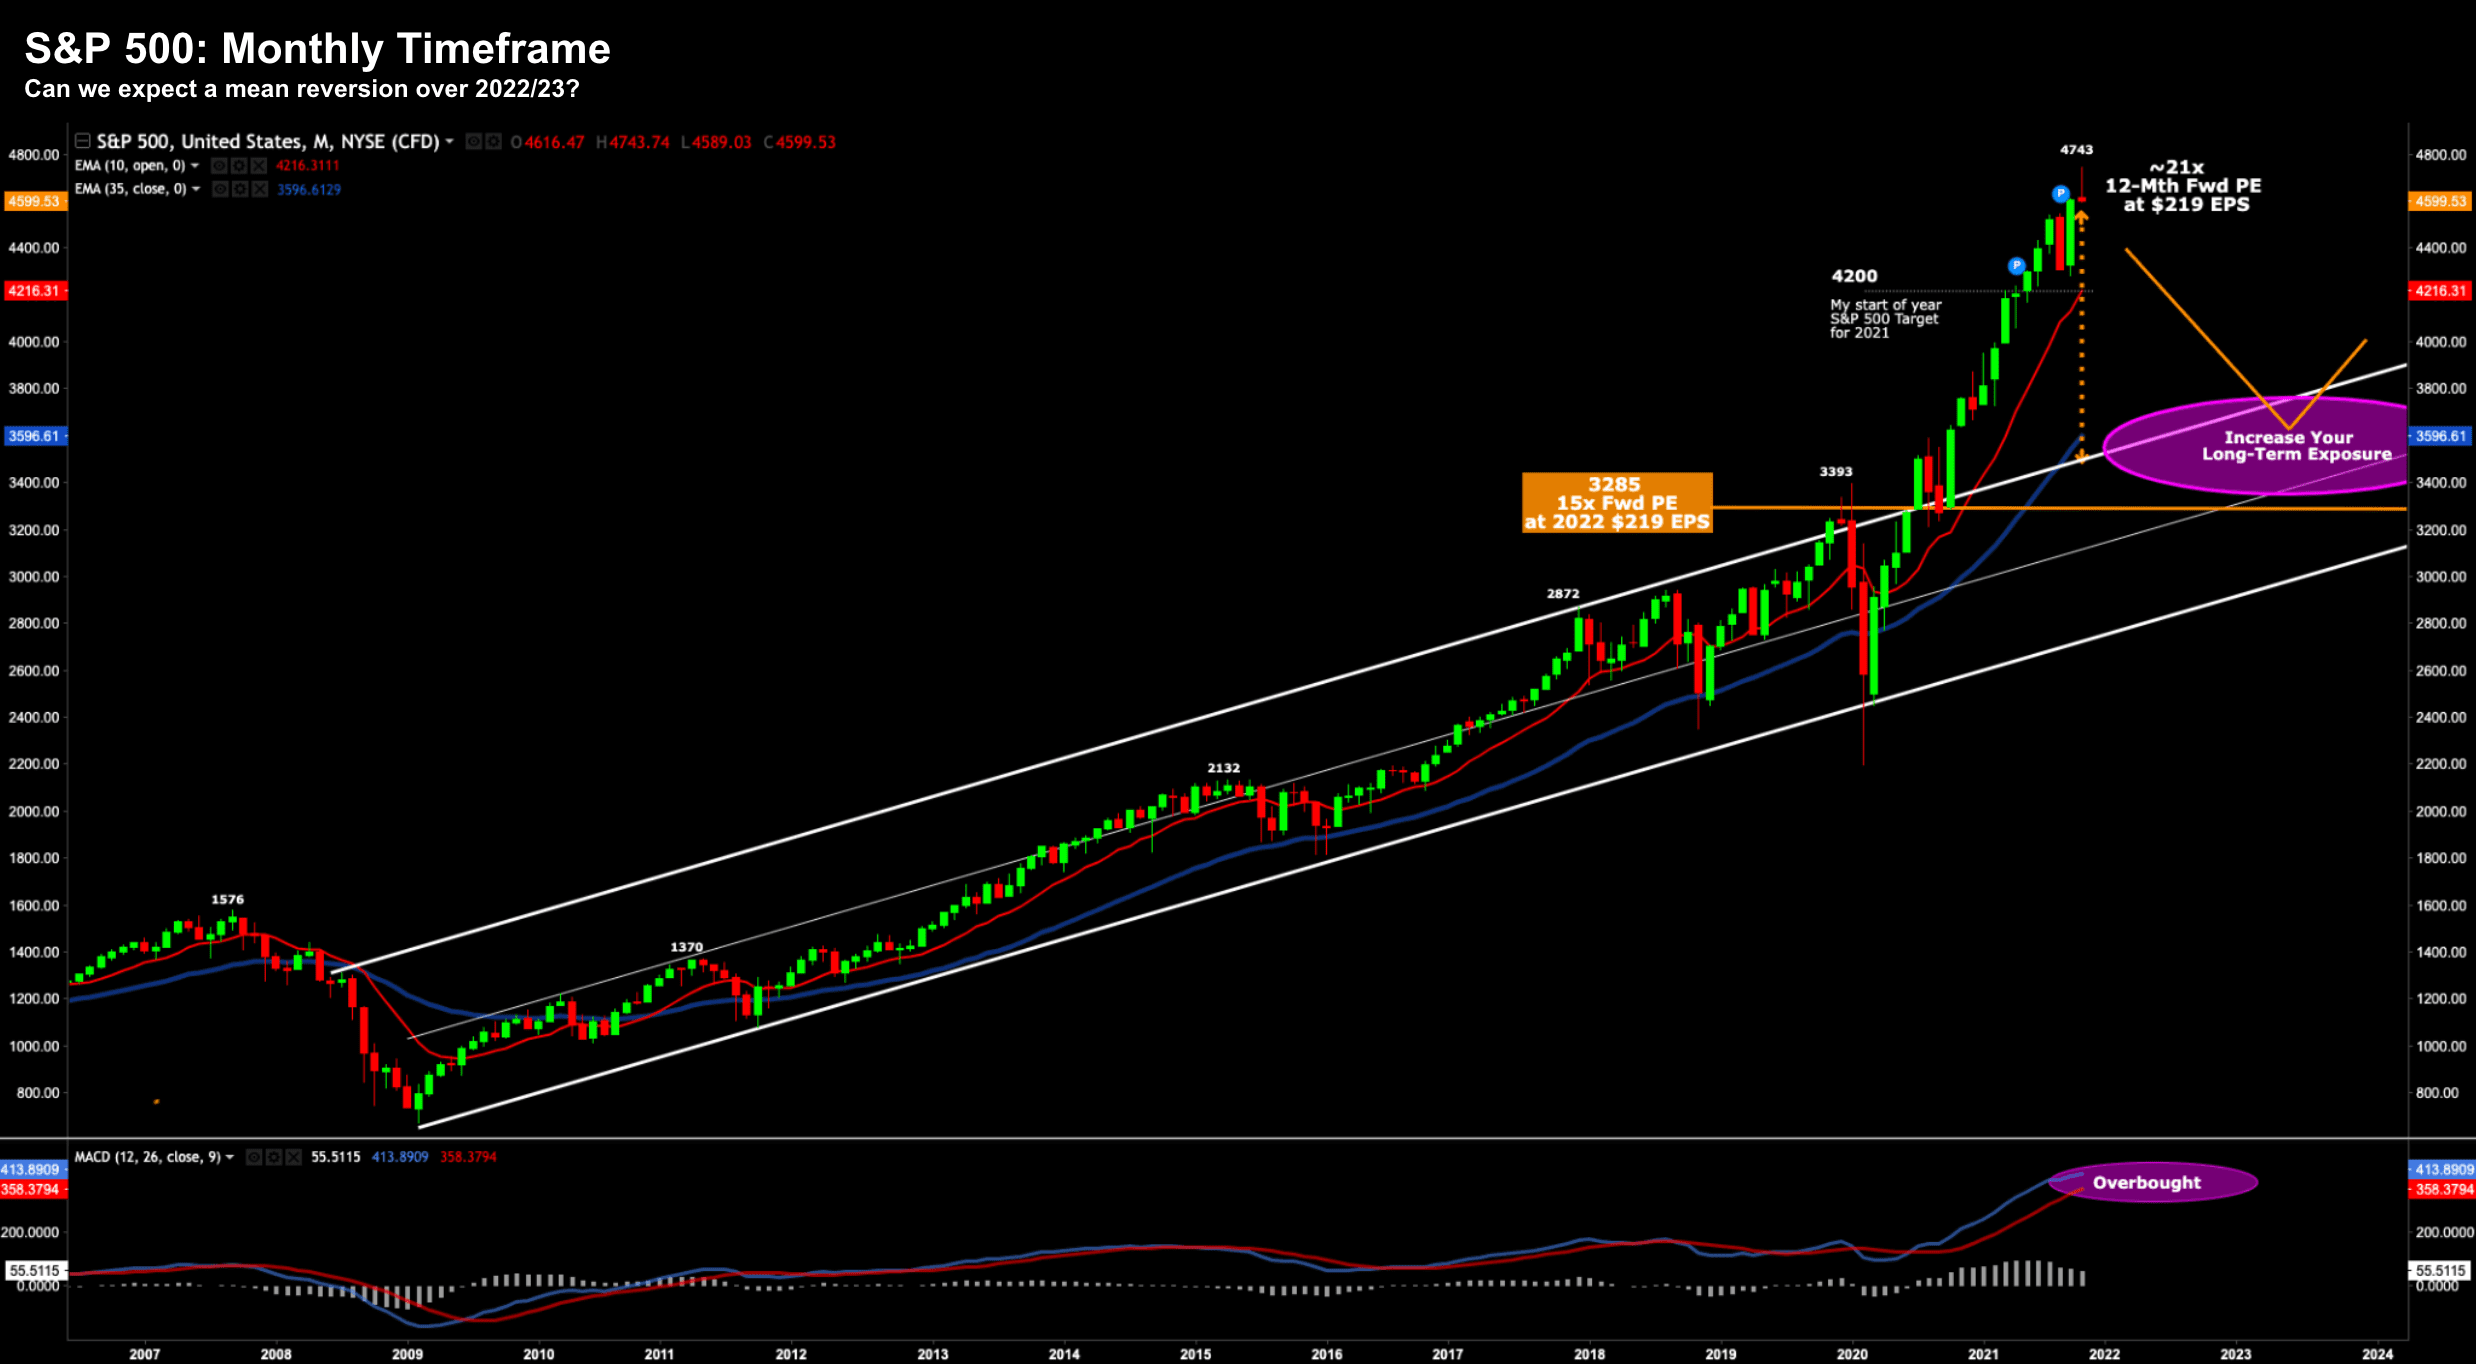
November 27 2021
From a purely technical lens – the obvious risk was the meaningful delta to the 35-month EMA (blue line above).
This has now come in considerably given the 7-week slide – but potentially has more to go.
Below is the updated monthly chart:
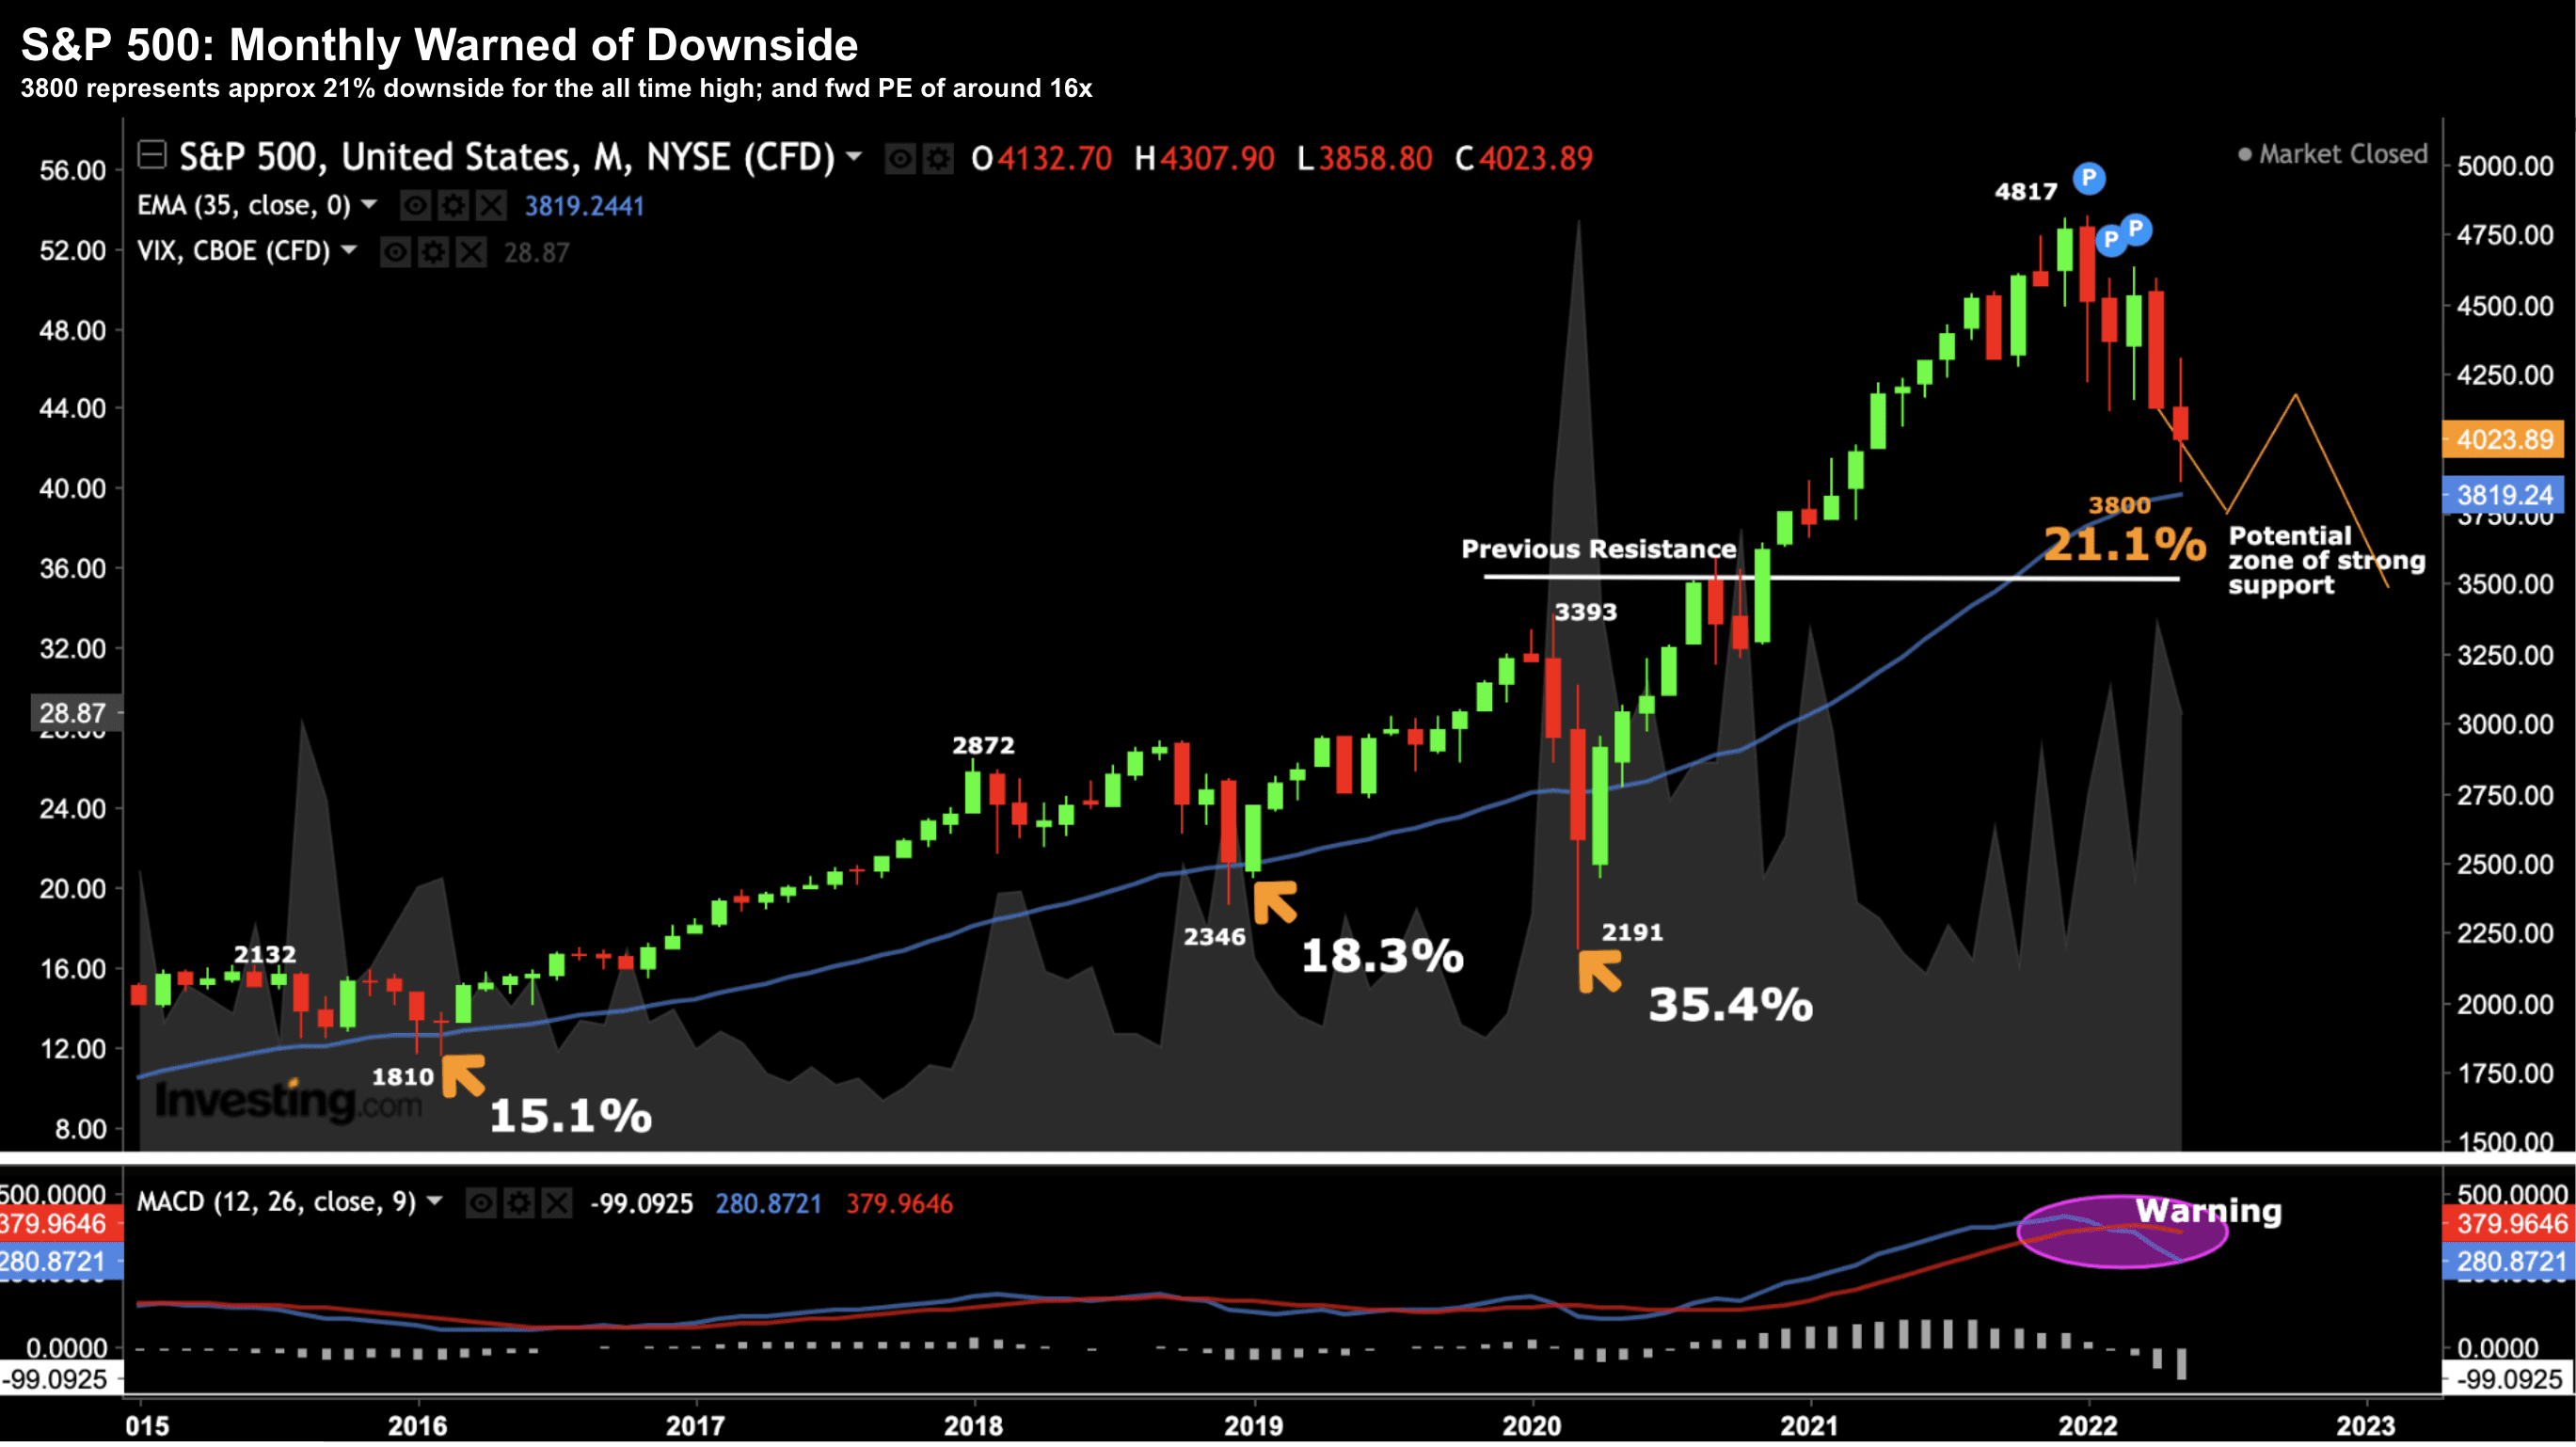
May 13 2022
Things have traded pretty much precisely as I penciled in over 6 months ago.
The ~20% correction from the peak sees us very close to the 35-month EMA
A couple of technical observations here (before I look at things fundamentally)
- We"re likely to find near-term support around this zone
- The monthly-MACD however warns of further downside (as it did 4 months ago)
- 3500 was a previous zone of resistance through Aug-Oct 2020;
- This could be the next major area of support on any capitulation (i.e. peak to trough decline of 27.3%)
Thoughts on a "Bear Market" and Valuations
It"s worth noting the average peak-to-decline move during bear markets (or where there is the likelihood of recession) is in the realm of 25% and 35%.
Naturally, most recessions are accompanied by "bear markets" .
From mine, the probabilities are very high we will experience a (Fed induced) recession late 2023 (not 2022).
The 20% move (so far) has essentially removed a lot of the valuation excess that was present last year (as this chart from Bloomberg highlights)
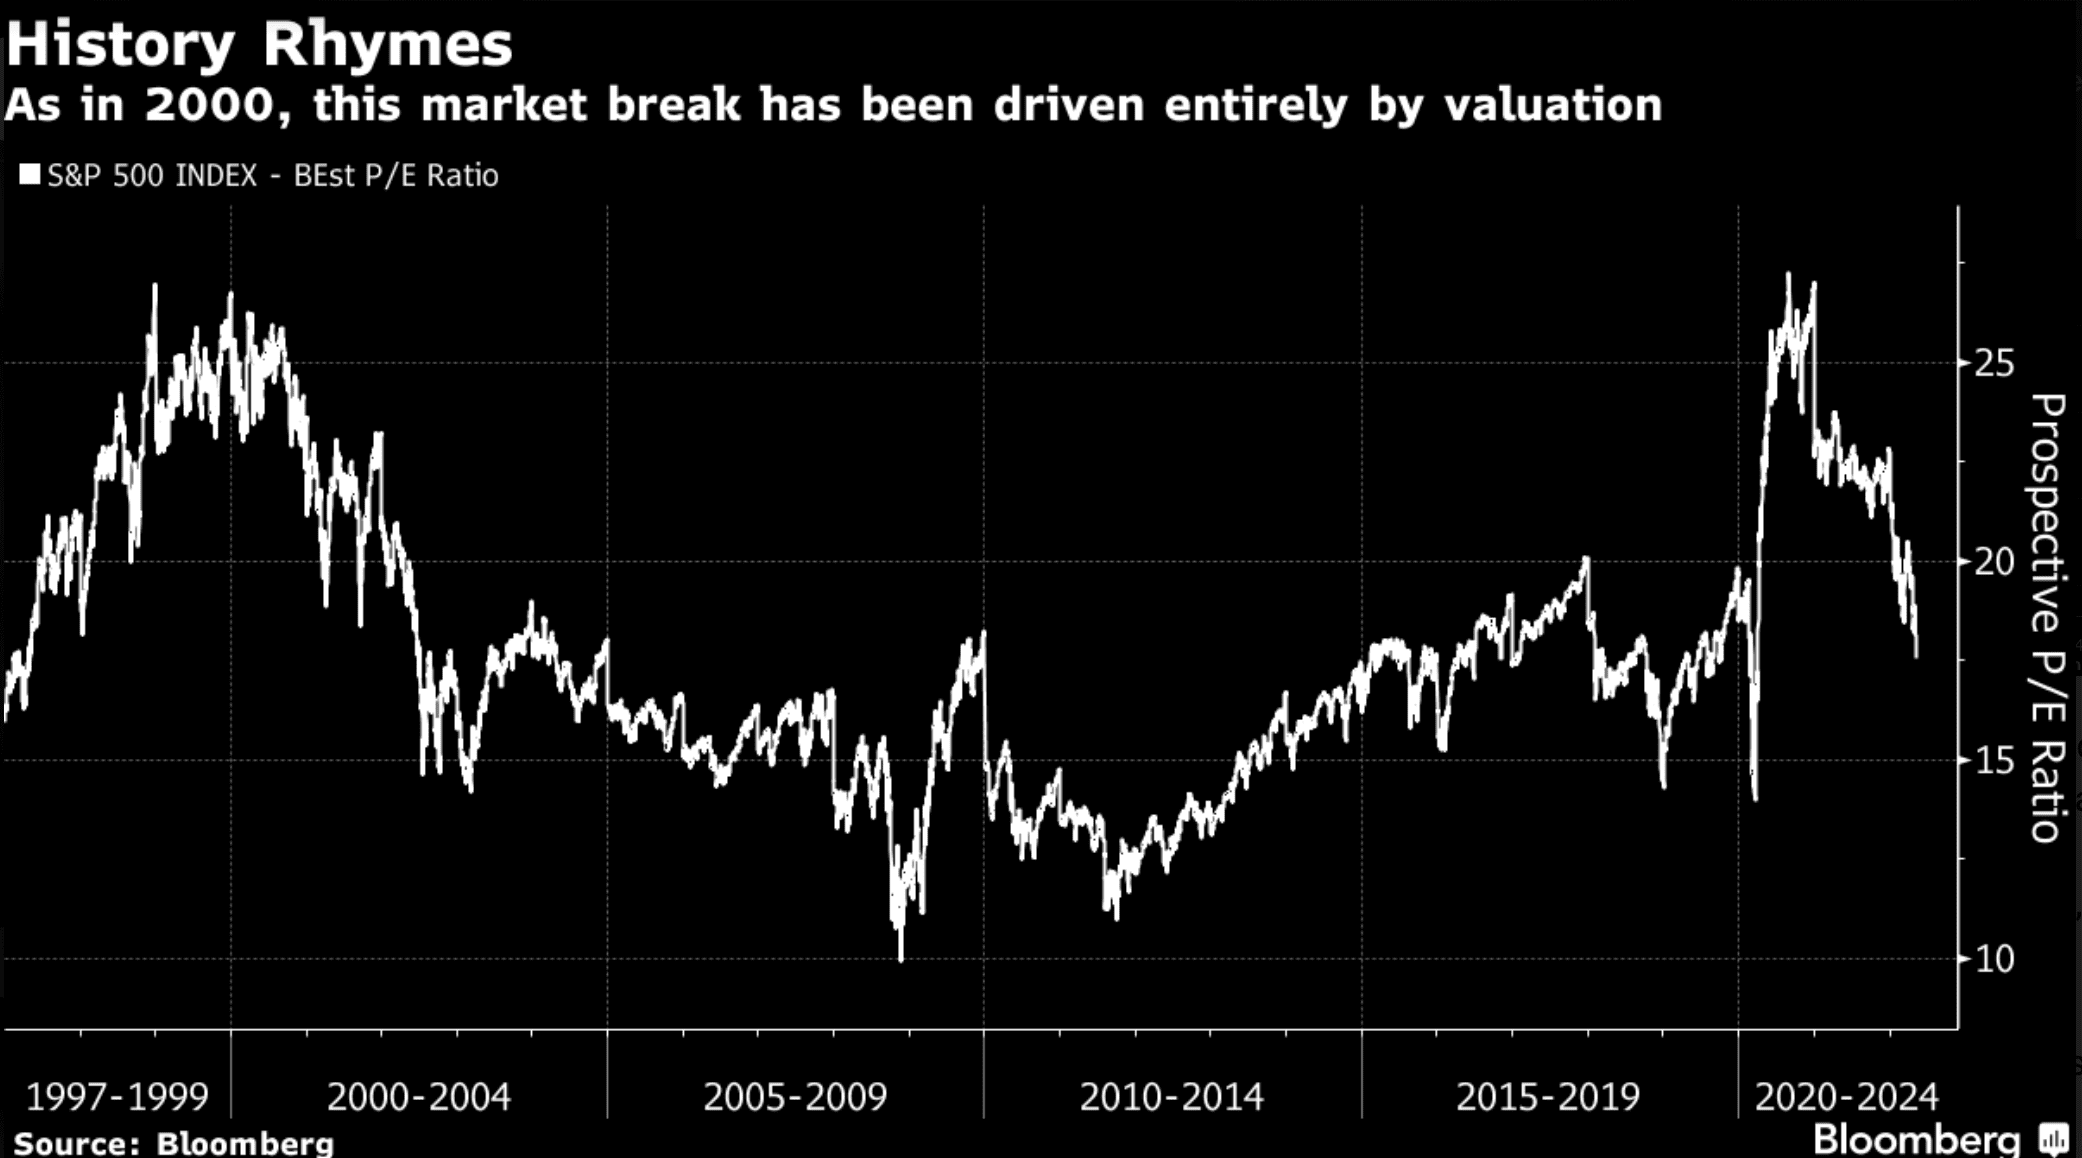
Stock Market Valuations: How History Often Rhymes
From my perspective, that is both a healthy and much needed development.
However, given the average decline of a bear market, it"s unlikely (and highly presumptuous) to think the lows for 2022 are in.
They could be… but you can"t make that call yet.
From mine, we will probably see a correction in the realm of around 25% before I increase my conviction that we are closer to a bottom.
That said, I have a high conviction we"ve seen the highs for 2022 (i.e., 4817)
So what does all that mean in terms of valuations?
From a fundamental picture, late last year the S&P traded above 21x forward projected earnings.
That"s approximately 40% higher than the 100-year S&P 500 average of around 15x
That said, I recognize that stocks warrant a premium given rates are negative in real terms (and likely to remain that way).
However, as bond yields (and rates) rise, earnings multiples will naturally come in (as this Bloomberg chart shows).
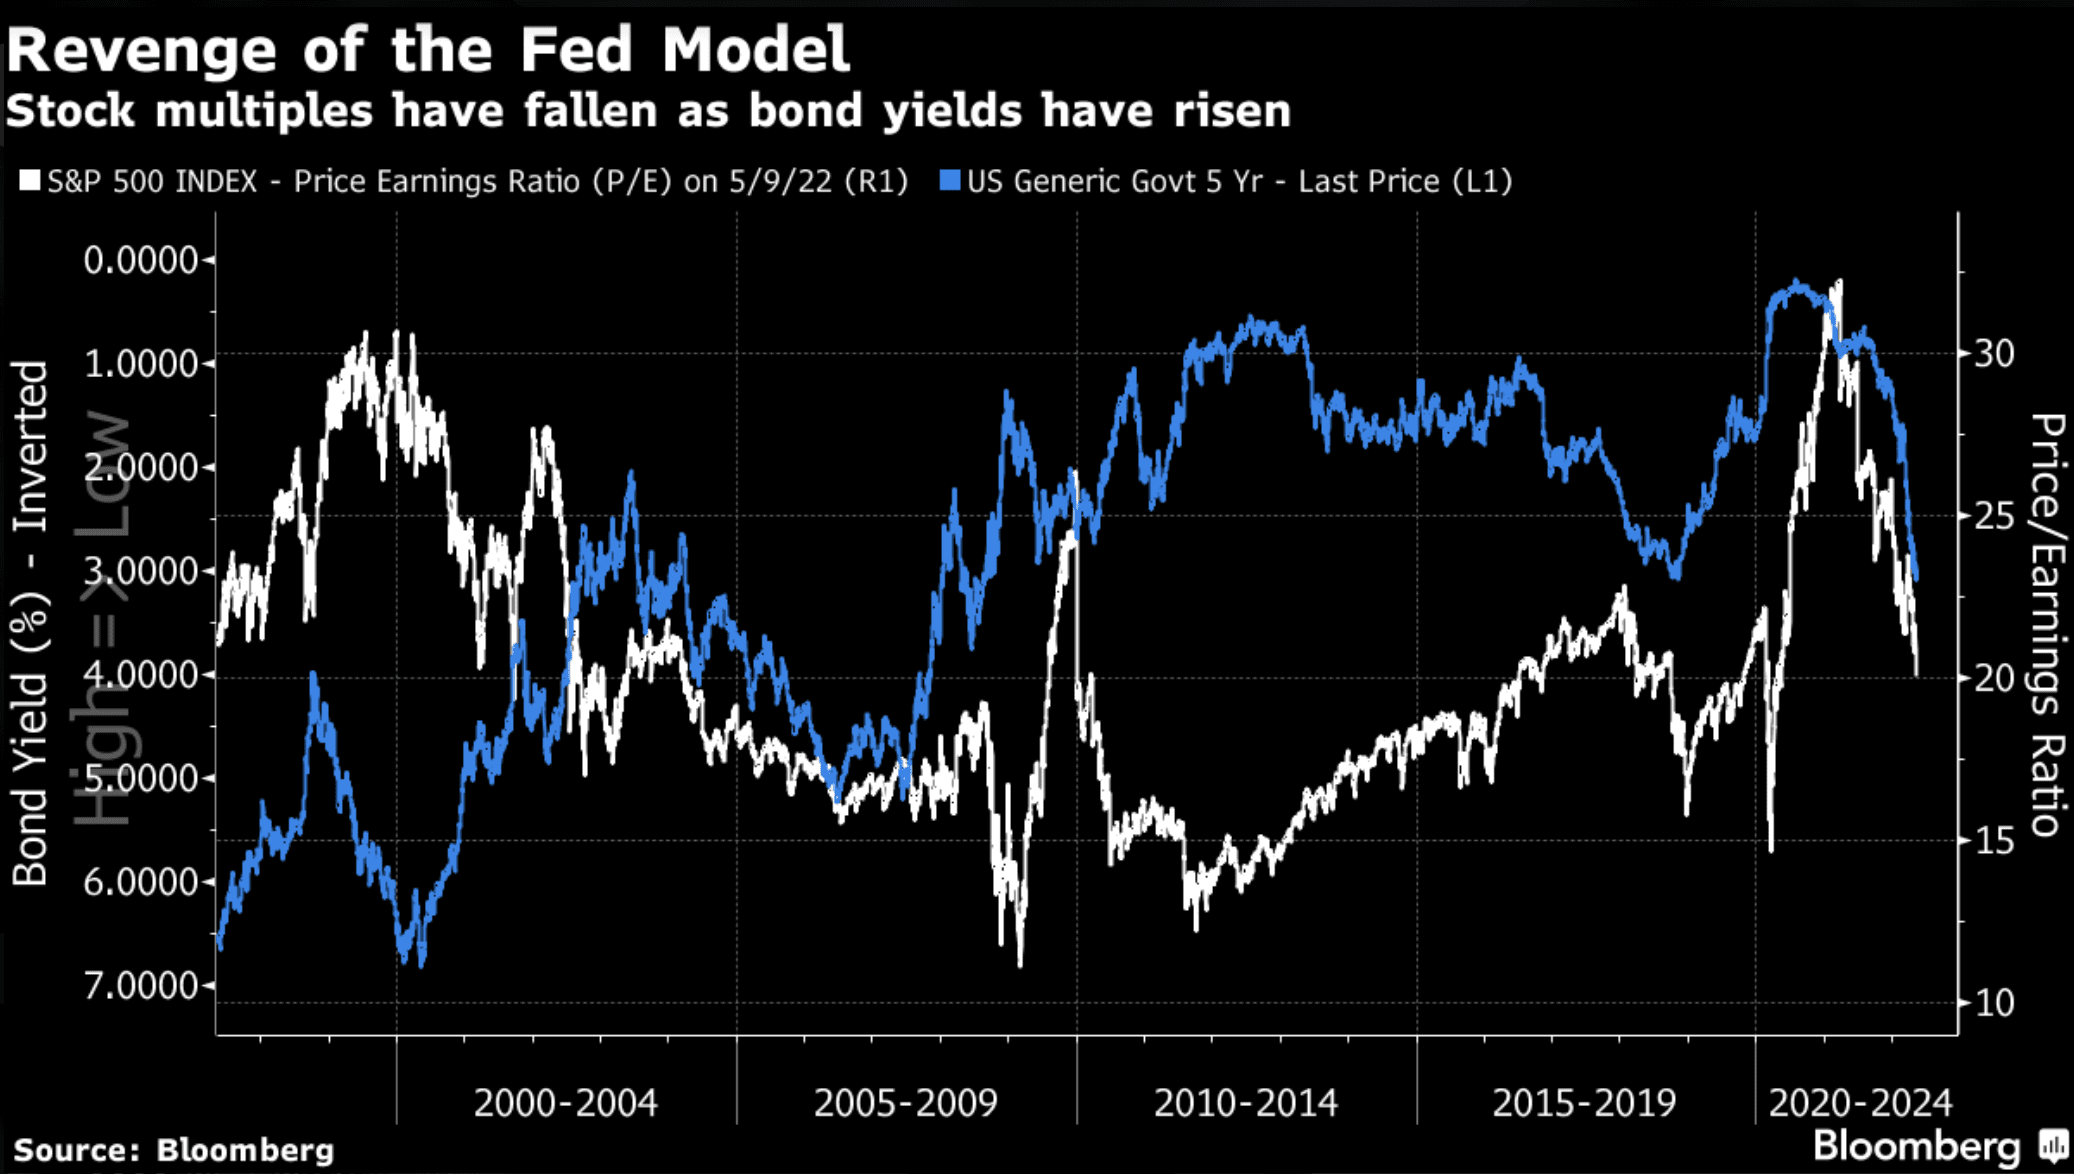
The difficult (near impossible) question to answer is what is the right multiple?
Perhaps Chris Smart of the Barings Investment Institute said it best:
"One thing that we all learned in April was that we now know that nobody knows what multiples should be because they don"t know if the Fed is behind the curve."
From mine, I"ve always felt a "reasonable" multiple (in this climate) is somewhere in the realm of 16x to 17x forward earnings.
And as we could see from the earlier Bloomberg valuation chart ("History Rhymes") – this is what the market averaged over the past 20 years.
Now for example, let"s assume forward EPS in the realm of $225 and $235 (according to Factset) for the S&P 500.
With the index trading 4023 – that"s a multiple b/w 17.9x and 17.1x (at the lower end)
That"s slightly higher than the average over the past 20 years – however what we see with real rates – that"s not excessive.
However, it also reminds us there could be more pain ahead.
For example, should we see capitulation (which we are yet to experience in my view); and we assume a forward multiple of 15x (i.e. the 100-year average) – that puts us around 3,525
That would represent a peak-to-decline fall of 27% and very much in line with average recession / bear market corrections.
It would also line-up with the previous Aug-Oct 2020 technical level of resistance (highlighted on the monthly chart); which typically turns into a new support level.
At that point, you "pin your ears back" and buy for the long-term.
The Price We Now Pay
Before I close, sometimes we need to remind ourselves that over the past two years, we"ve seen unprecedented monetary and fiscal policy.
For example, monetary in terms of the incremental $4.5T added to the Fed"s (now some $9 Trillion) balance sheet (QE) – whilst anchoring short-term rates at zero.
And fiscal in terms of record government deficits.
Combined, these two policies resulted in ~$10 Trillion of fresh liquidity.
The result was the price of literally everything went up.
I often like to call it an "everything bubble".
What"s more, it had the (intended?) effect of pulling forward years of demand.
The primary problem (as I see it) wasn"t the Fed"s initial emergency response to ensure the smooth functioning of markets (through the provision of ample liquidity)…. here they did the right thing.
The issue was the "emergency level" response ran ~18 months longer than it needed to.
Put another way, for more than 12 months (minimum), we have had a Fed Reserve asleep at the wheel.
Now they are paying for their misjudgment.
However, with respect to the government – fiscal policy was reckless.
The pandemic offered the government an excuse to decimate the public"s balance sheet.
For the most part, most of this wasteful spending was unnecessary, and will likely go down as one of the greatest fiscal errors in modern times (maybe all-time?)
Consider the following:
Q1 2017 the US national debt was around $19.8 Trillion (with Real GDP at $17.9T).
Today national public debt sits near $30 Trillion.
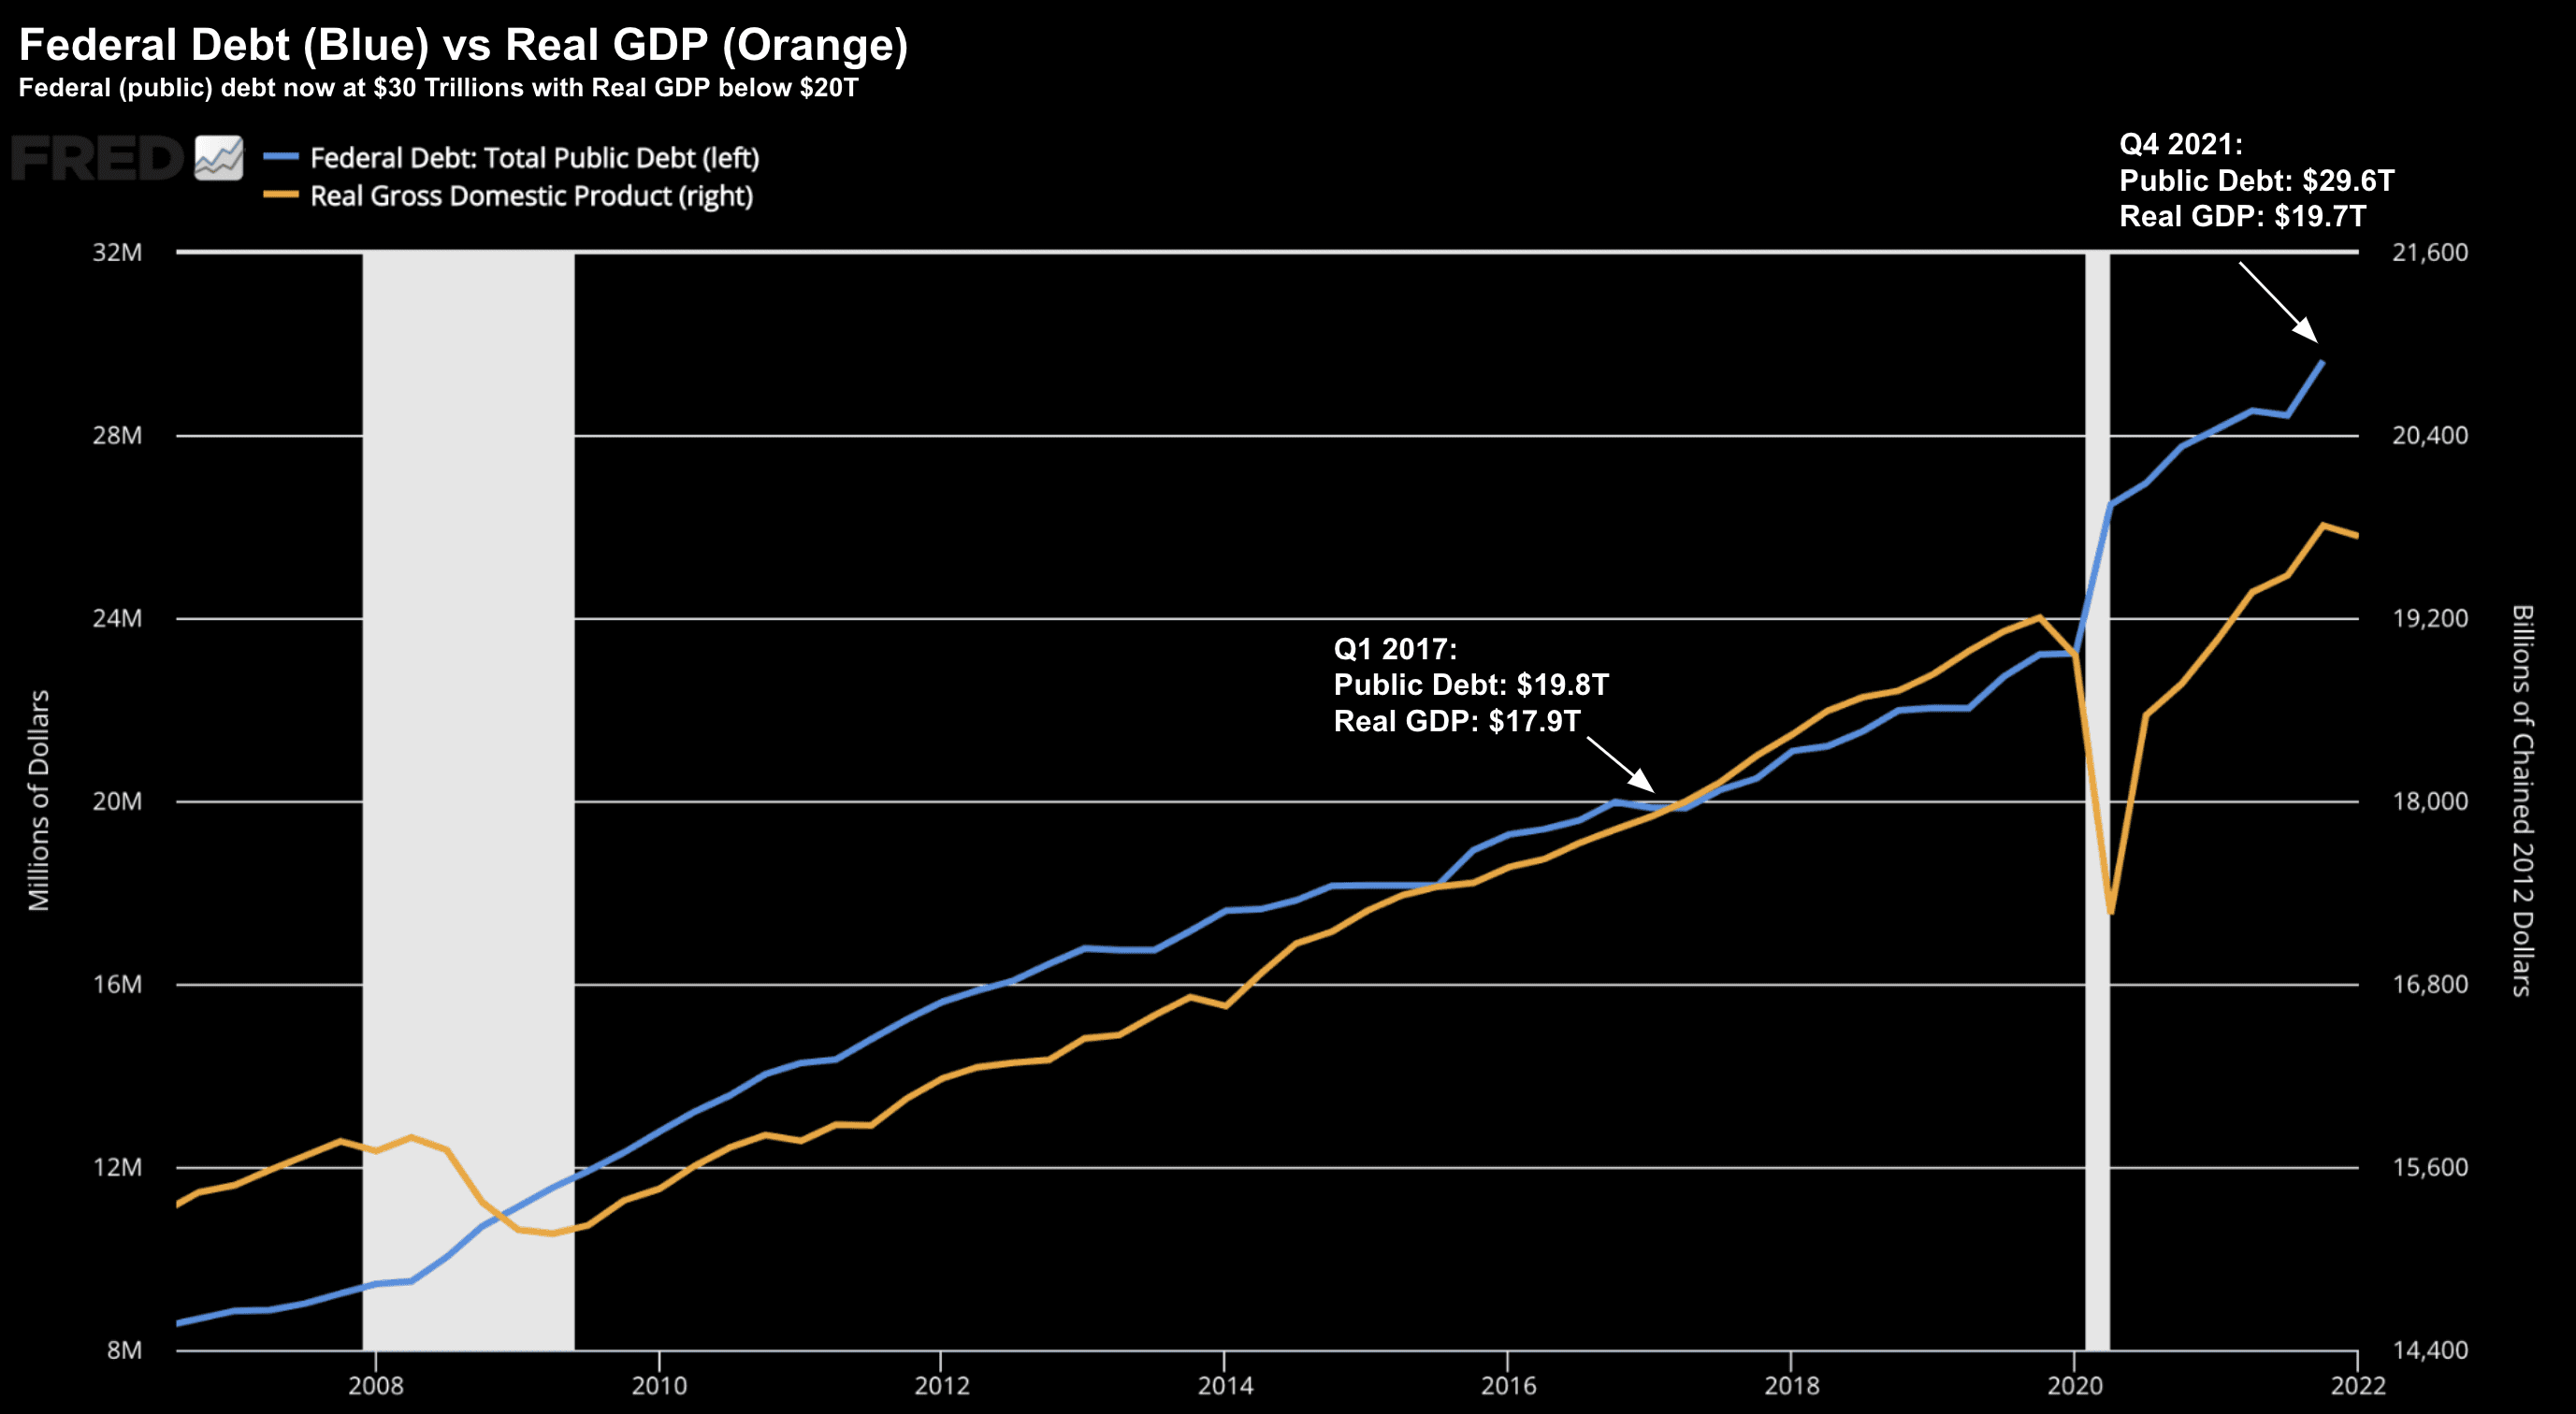
May 13 2022
Here we can visualize the $10T increase in public debt – which is far in excess of an economy only growing at 2% at most (and likely to reverse in 2023)
Excessive deficits are neither healthy nor sustainable.
And when rates are rising… the pain becomes more acute.
Sadly, we are all being forced to pay the cost (mostly in the form of inflation and ultimately higher taxes)
Put another way, we"re going to have to deal with these problems one way or another.
2022 marks the beginning of what that "cost" looks like.
Putting it All Together
It"s often said that "every recession sows the seeds for the next recovery…. and every recovery sows the seeds for the next recession"
There"s just one catch…
This time around the Fed (combined with the Government) managed to exaggerate both the recovery and the resultant recession.
There is always a price to pay for excess. It"s never an "if"… it"s always a "when"
Part of that is the adjustment is what we have seen in stock valuations (house prices will soon follow as rates normalize)
The other is consumers having to pay more for just about everything (i.e., housing, food, energy, consumables).
We have a problem where too much money is chasing too few goods.
That"s the definition of inflation. It"s a monetary phenomenon.
The Fed are now trying to address this via the only two mechanisms they have:
- increase the "demand" for money by raising rates (i.e. making it more attractive); and
- reducing its supply (i.e. QT in the form of allowing $95B p/mth to roll-off their balance sheet)
The "good" news for investors who have patiently waited for valuations to come in – is we"re approaching a point where long-term quality assets look attractive.
Yes, we"re likely to experience a lot of volatility as we get "more Fed".
That"s okay.
It"s always hardest to buy when no-one else wants to.
But my overall view stocks are approaching valuations we"ve not seen in years (excluding the brief collapse in March 2020).
And that will be a time to buy. Not sell.