What Markets are Trying to Figure Out
- Why SNAP"s warning is a big red-flag for Q2 earnings
- What kind of market "pullback" is this? and
- Expect sharp rallies; but market strength will be sold
Markets are working hard to try and calibrate a rapidly changing environment.
For example, are we trading:
(a) "recessionary bear" – where equity declines of 25-35% are typical over the course of a year (or more); or is this
(b) a non-recessionary 20-25% correction due to expected Fed tightening – where earnings multiples are trimmed?
For what it"s worth – I lean towards the former.
I think we will see a recession in the second half of 2023 – where the S&P 500 is likely to test the zone of around 3500.
That would represent a peak-to-trough decline of 27.3% from Jan 2022.
That said, many analysts I read don"t see a recession this (or next) year. They see inflation peaking and the Fed to pivot sharply from their current hawkish stance.
If this is accurate – we might be closer to a near-term bottom (i.e ~3800 zone).
But let"s talk more to pullbacks… and what to look for.
Dimensioning Market Pullbacks
With every market – there are generally three types of pullbacks we experience.
Chris Watling of Longview Economics defined it this way:
#1: Plain vanilla pullbacks.
Typically between a few percent and up to around 10% or so. These are predominantly about purging over exuberance/excessive risk appetite from prices. 2018 as a good example, and it successfully wiped out over-enthusiasm after the big Trump corporate tax cut.
#2: More troubling, often shock related 3 – 6 month pullbacks.
These often start with over exuberance in markets and morph into a mini shock and a need for the Fed to rein in its monetary policy hawkishness (or stimulate). They also often occur at the end of a 2 – 3 year mini economic cycle upswing as growth is starting to roll over. Examples include the 2015-16 reaction to trouble in China, the 1997-98 selloff primarily driven by the emerging market crisis; and the late 2018 selloff which forced the Fed to abandon its plans for QT asset sales.
#3: Longer lasting cyclical bear markets
Typically persist for several quarters and even as long as 2 – 3 years. They are driven by some combination of: (i) a US/global economic recession; (ii) tight money (in the broadest definition); and/or (iii) a shock (potentially, and often, an unwinding of a bubble, occasionally a long lasting, all-encompassing war, e.g. WWII, Korean war).
With respect to #1 – 2021 was a good example.
We had 5-7% pullbacks where they were always bought (given easy monetary environment; surging corporate profits; low inflation; and a cashed up consumer).
However, 2022 is very different.
Now it"s simply a question of whether this is #2 or #3?
As I say, I"m leaning towards #3 unless we see dramatic improvement to sticky inflation (not simply headline CPI).
For example, should the Fed persist with rate normalization (e.g. in the realm of 3.00% nominal) – combined with $95B p/mth QT to combat persistent unwanted inflation – we will most likely head straight into scenario 3 (i.e., a recession).
However, if the inflationary data improves and there are solid signs it has peaked… we could get away with #2.
And if that"s the case, we would need to hear this definitively from the Fed with their language.
I don"t expect this over the next 3-6 months.
But here"s the thing:
Irrespective of whether this is #2 or #3 – we"re going to see sharp rallies along the way.
That"s to be expected.
For example, today all three major indexes posted gains (led by banks after JP Morgan provided some positive sentiment at their annual investor day summit – lifting the entire sector).
As such, I would not be surprised to see the S&P 500 rally as far as 4200 to 4300 over the course of the next few days or weeks.
And that"s what we need to see before we can even think about changing any conviction that the lows for 2022 have been made. For clarity, I still see "lower lows"...
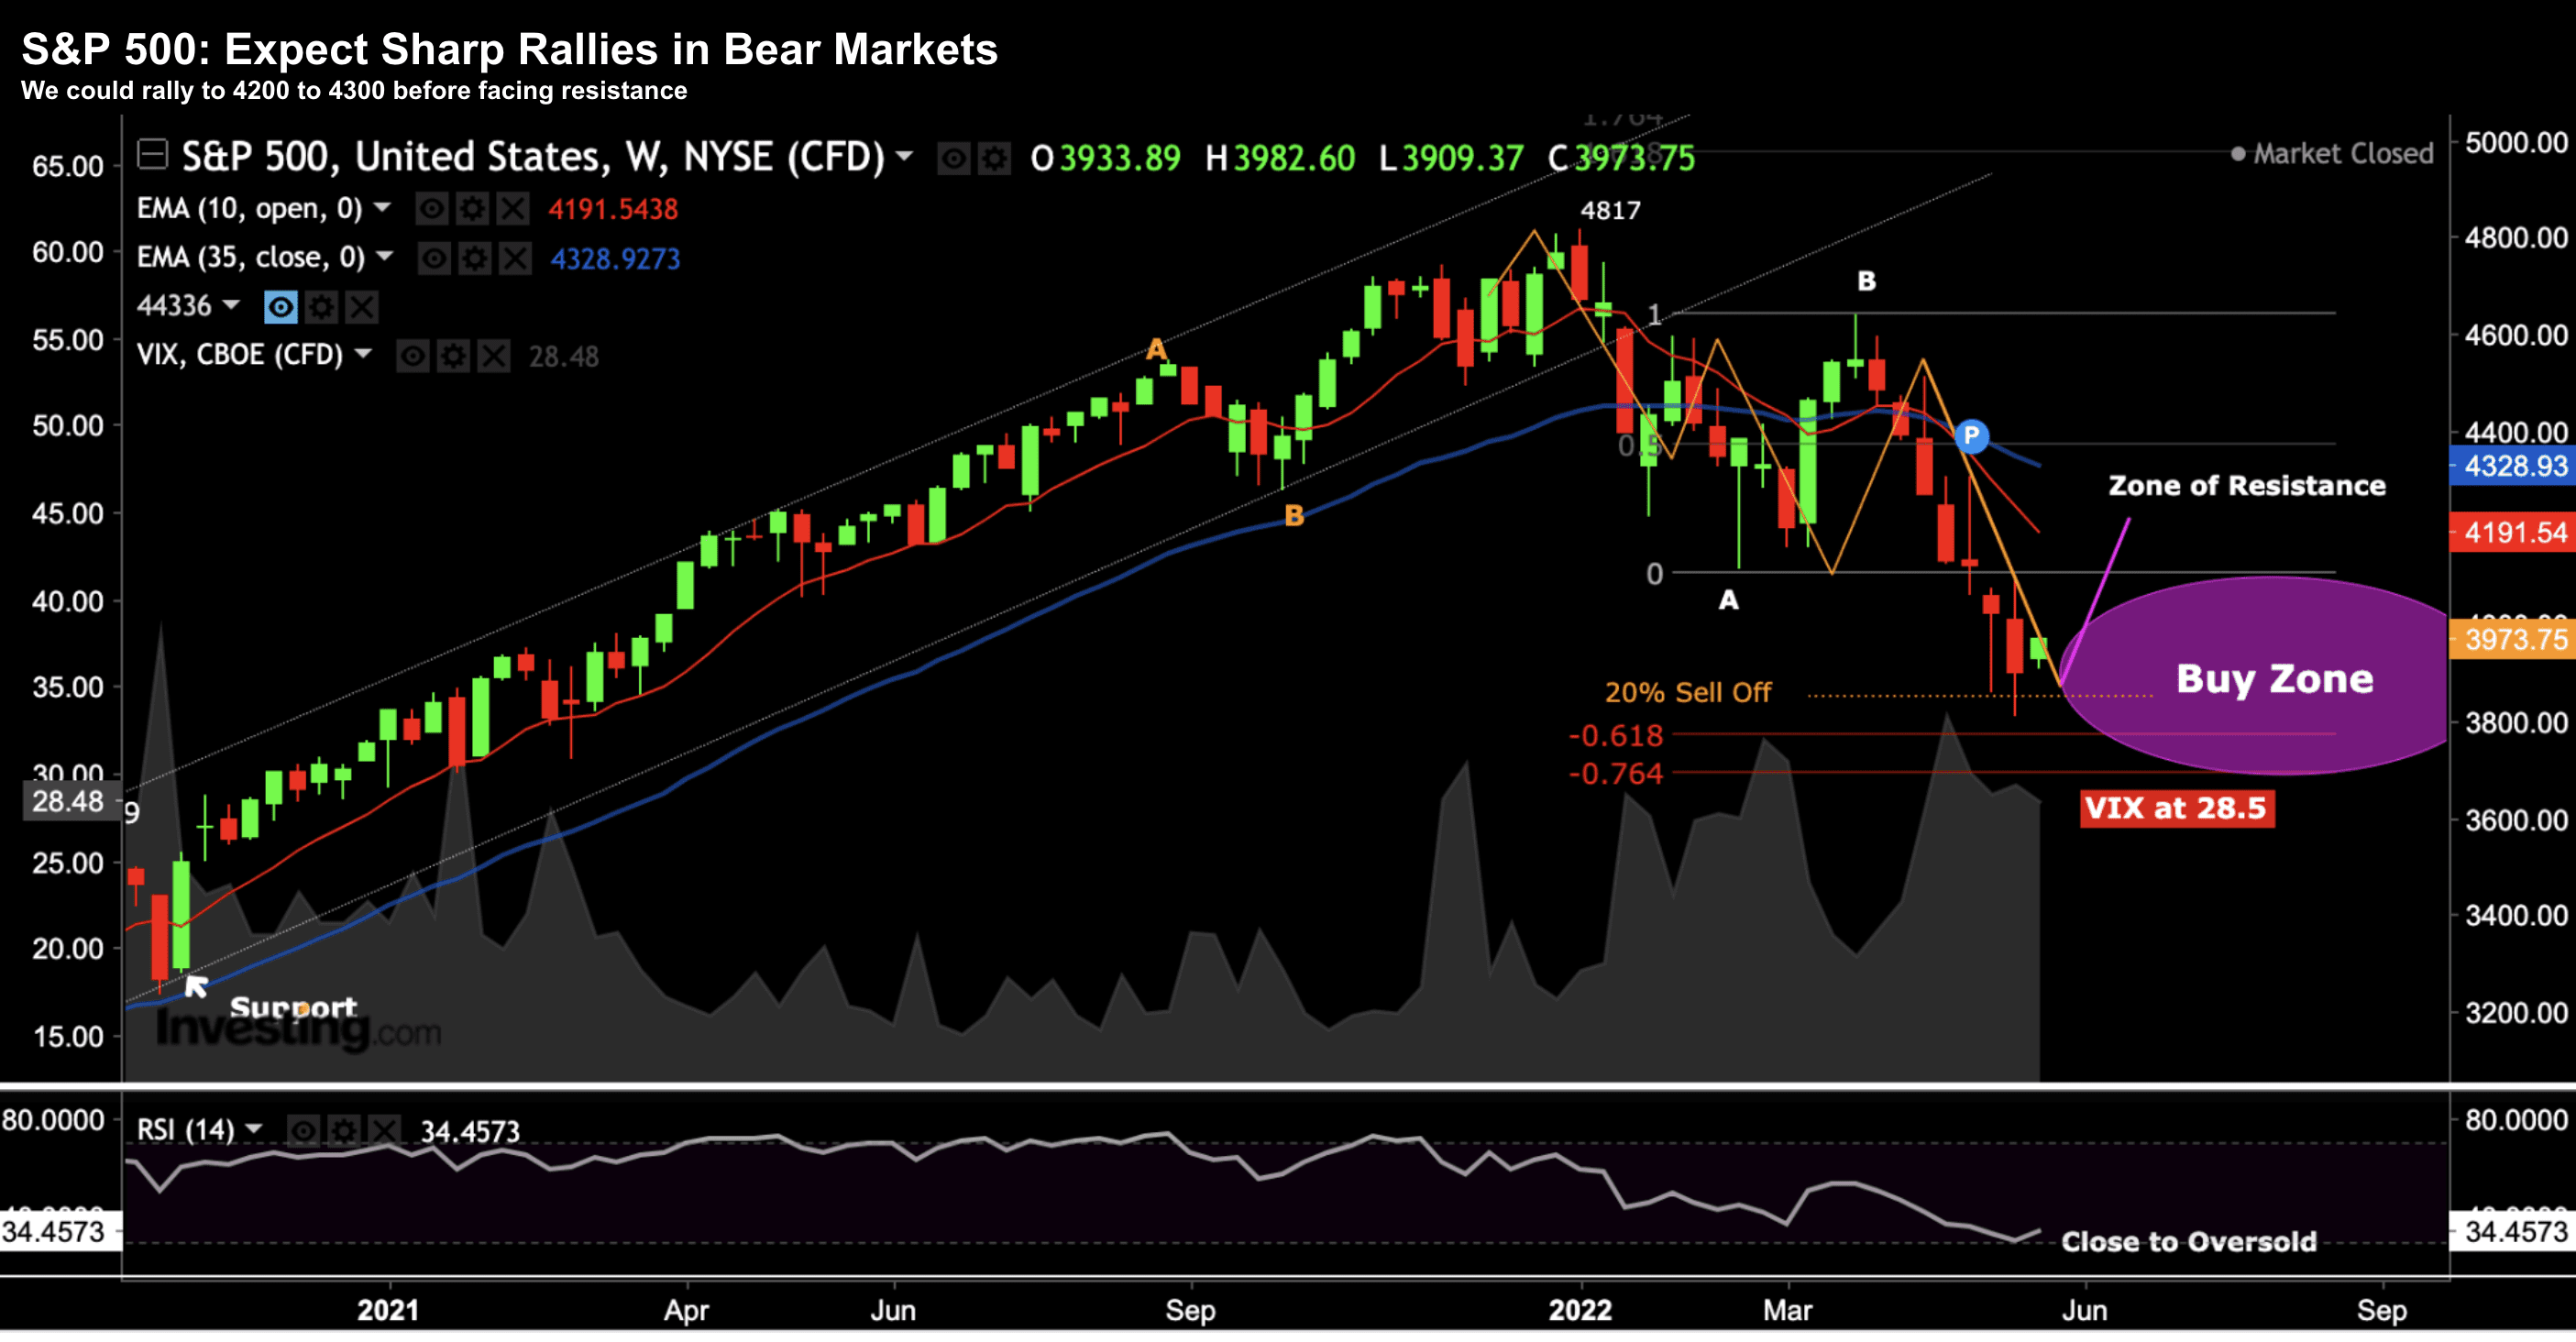
S&P 500 – May 24 2022
For what it"s worth — I"m not attempting to "trade" these short-term bounces.
That"s not how I approach things.
As I like to say – "you need the hands of a surgeon" – and that"s not me.
If anything, I will use any near-term strength to adjust (reduce) my portfolio opposite more speculative positions.
However, what I"m looking to do is target quality over the longer-term – especially with the index trading below 3900.
How Do You Approach this Market?
So what do you do here?
This market is about as difficult as we"ve seen since 2008.
And I hazard a guess that very few portfolios are positive so far in 2022… with the market down almost 20%
For example, my own portfolio is down ~6% year-to-date (~11% better than the market) – dragged lower by long-term positions in Google, Microsoft, Apple, Amazon and Meta.
But given the three "pullback" scenarios outlined above – do you:
- Buy the ~20% pullback with your "ears pinned back"?
- Nibble at quality names (i.e. strong positive cash flows, robust balance sheets, record of consistent profits)? or
- Sit it out all together; remain overweight cash on the basis that 30%+ retracement is coming?
The answer (if there is one) is entirely a function of your own lens and risk tolerance.
Your approach will most likely differ to mine.
Personally, I"m not buying this market with "gusto". However, nor am I overweight cash.
Further to recent missives – I"ve been adding to quality (specifically big cap tech) – however maintaining a reasonable (~35%) cash position.
But you need to be careful on what "quality" (or risk reward) means.
For example, broadly speaking I think:
- Big tech looks attractive from a long-term view;
- Bank stocks appear undervalued if we don"t head into a recession;
- Small caps are higher risk but also attractive if we come out of this growth scare; and
- Retailers / consumer sensitive names still have to come down further as consumer demand falls (more on this in my conclusion)
All of this will be driven by two things: (a) inflation expectations; and (b) resultant monetary policy.
For example, will the Fed be able to tighten as they intended without causing a hard landing?
Or will they repeat the 2018 script and pivot (assuming peak inflation gives them that opportunity)?
And this is what the market is trying to figure out.
Putting it All Together
Before I close, I want to share a couple of data points which hit the tape today.
First, Jamie Dimon"s comments today at their investor summit.
Dimon told us the consumer remains in great shape; where higher rates are significant helping their net interest margins.
Good news for shareholders – as their stock ripped 6% higher.
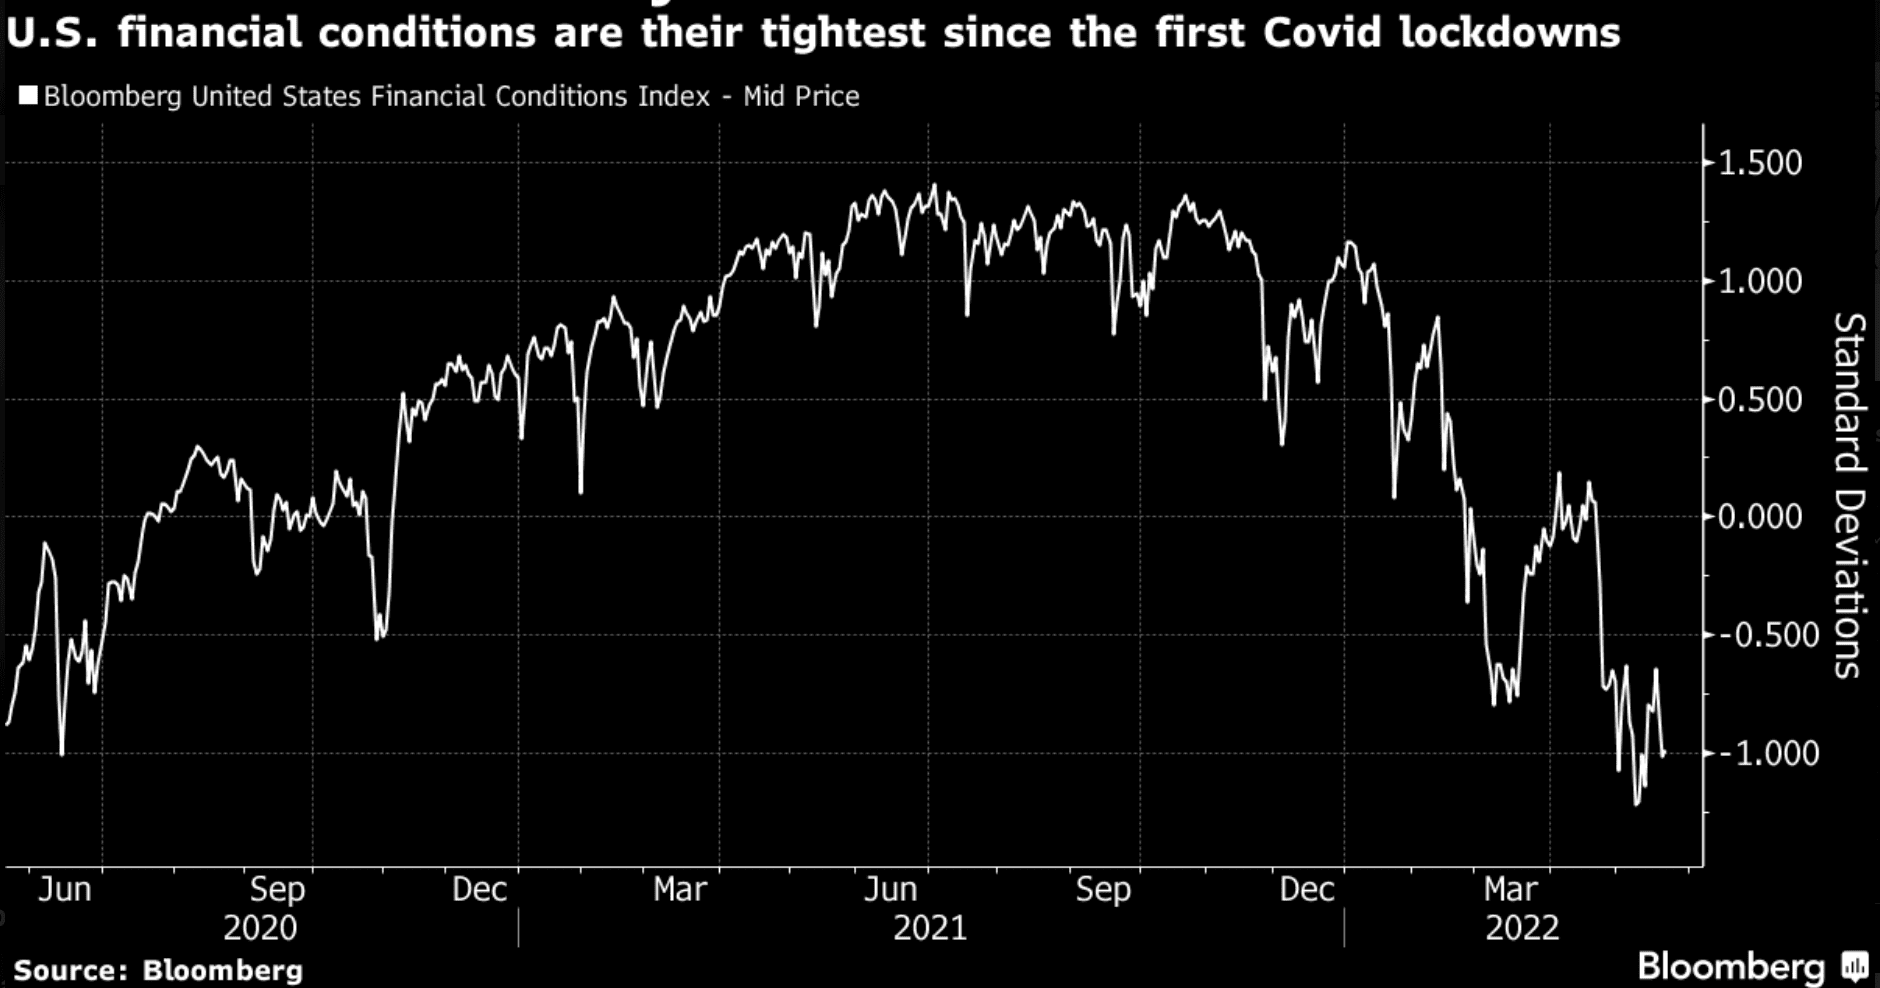
Now whilst it"s true the banking sector is in a far healthier state than it was in the lead up to the recession of 2008 – we are seeing financial conditions tighten sharply (see this Bloomberg chart shows).
However, the other (less noted) "macro" data point came from SNAP"s CEO Evan Spiegel.
As context, approximately one month ago Spiegel was talking up SNAPs revenue growth forecasts for online advertising.
The stock rallied sharply.
Now just one month later he pivoted and revised down both revenue and earnings expectations – sending the stock about 25% lower.
SNAP traded around $83 in Q4 last year; however tomorrow it"s expected to trade ~$16 (i.e. 81% lower).
With respect to Spiegal"s comments – we heard similar sentiment from both Target and Walmart last week. That is, things are turning on a dime.
So what"s this all mean?
My quick take is both consumer confidence and demand is starting to wane.
And I think this should be a big red flag in terms of next quarters earnings.
Estimates are likely to come down.
As I said last week, thank to $10 Trillion in ultra-easy monetary policy combined with (excessive) government spend – we essentially pulled demand forward by at least a year.
Stocks are now starting to connect a few of these dots.
But there"s more work to do.