Yields Consolidate as Stocks Exhale
- Bond yields ease to end the week
- A look at the S&P 500 using a monthly timeframe
- And a new trade on LLY (Eli Lilly) this week
And we exhale… for now.
Stocks caught a small bid Friday as bargain hunters started to sniff around.
That"s expected after a few days of selling.
Yesterday I suggested that yields would likely consolidate after a furious run – and this is what we saw.
The 10-year bond yield pulled back to 1.46% – down 9 basis points from yesterday"s 1.55%.
This was a sense of relief to many… with some stocks catching a bid after several weeks of selling.
But it was small-caps which saw the biggest gains – rising some 1.7% – as news of Merck"s COVID oral treatment drug fueled the re-opening trade.
Regardless, October is just starting… and nothing has changed in terms of the macro picture.
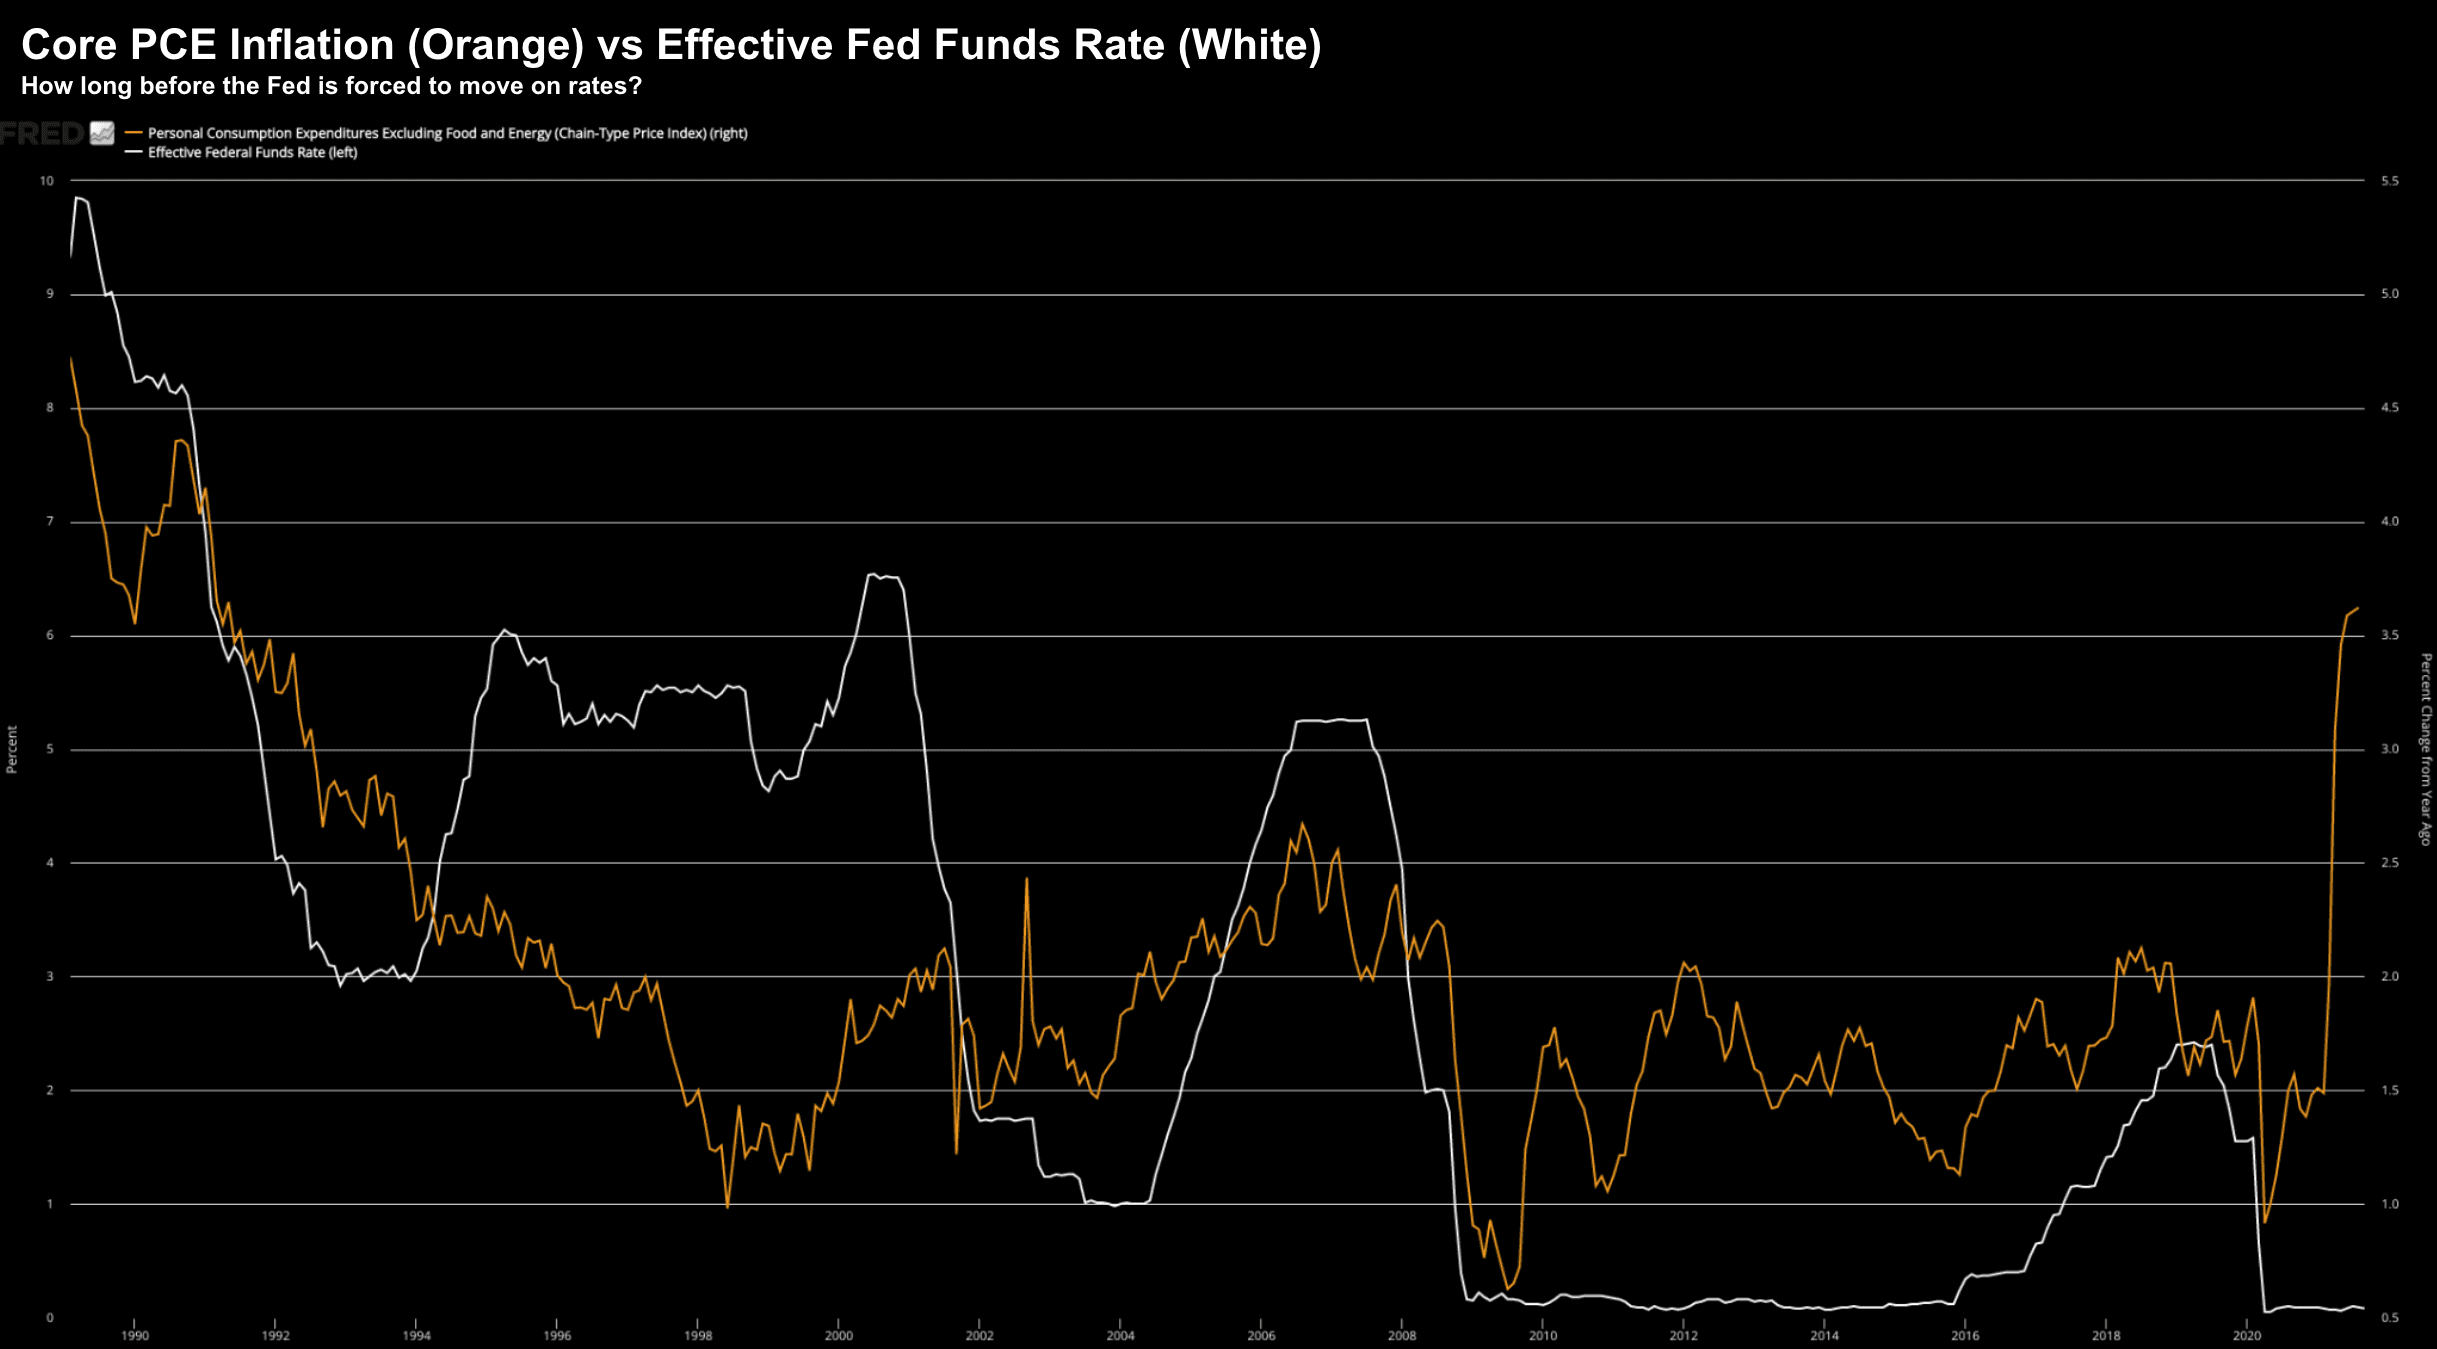
Fed"s Inflation Gauge Jumps
Today we learnt that inflation ran at a fresh 30-year high in August as supply chain disruptions continue to drive price pressures.
As an aside, my partner was complaining that the cost of her organic peanut butter (which doesn"t contain palm oil) rose ~20% month on month.
Typically her preferred Santa Cruz peanut butter is ~US$4.00… it"s now $4.96 on Amazon.
I said to her it won"t be just peanut butter… watch coffee jump at least 20% in the coming months… with Vietnam the second largest producer in the world.
That will make her happy!
Ahhh good thing inflation is only "transitory" right?!
Well maybe some things…
The Fed"s preferred inflation gauge – core personal consumption expenditures (Core PCE) price index – which excludes food and energy costs increased 0.3% for the month and was up 3.6% from a year ago.
The monthly gain was slightly higher than the 0.2% Dow Jones estimate and the annual forecast of 3.5%.
That"s the highest since May 1991 and reflective of inflationary pressures that Fed Chair Powell described as "frustrating."
October 01 2021
The rise in inflation came as personal income increased 0.2% for the month, in line with estimates but indicative that real income is falling as inflation rises.
Spending accelerated 0.8%, slightly above the 0.7% forecast.
But here"s your potential inflation kicker:
Personal savings totaled $1.71 trillion, running at a 9.4% rate.
How long before this money hits the economy… where more money is chasing the same (or fewer) goods?
CNBC reported that the ISM Manufacturing index for September registered a 61.1 reading, representing the percentage of companies seeing expansion.
However, the survey also showed prices rising, with 81.2% of respondents reporting increases against 79.4% in August.
"Supply chain concerns are growing beyond electronics and chips into most other commodities. Lead times are extending, shipping lanes are slowing, and we will not see an end to this in 2021," said one respondent in the electrical equipment, appliances and components industry
Which begs another (growth) question:
What will this do to Q4 holiday sales – the busiest time of year for most retailers?
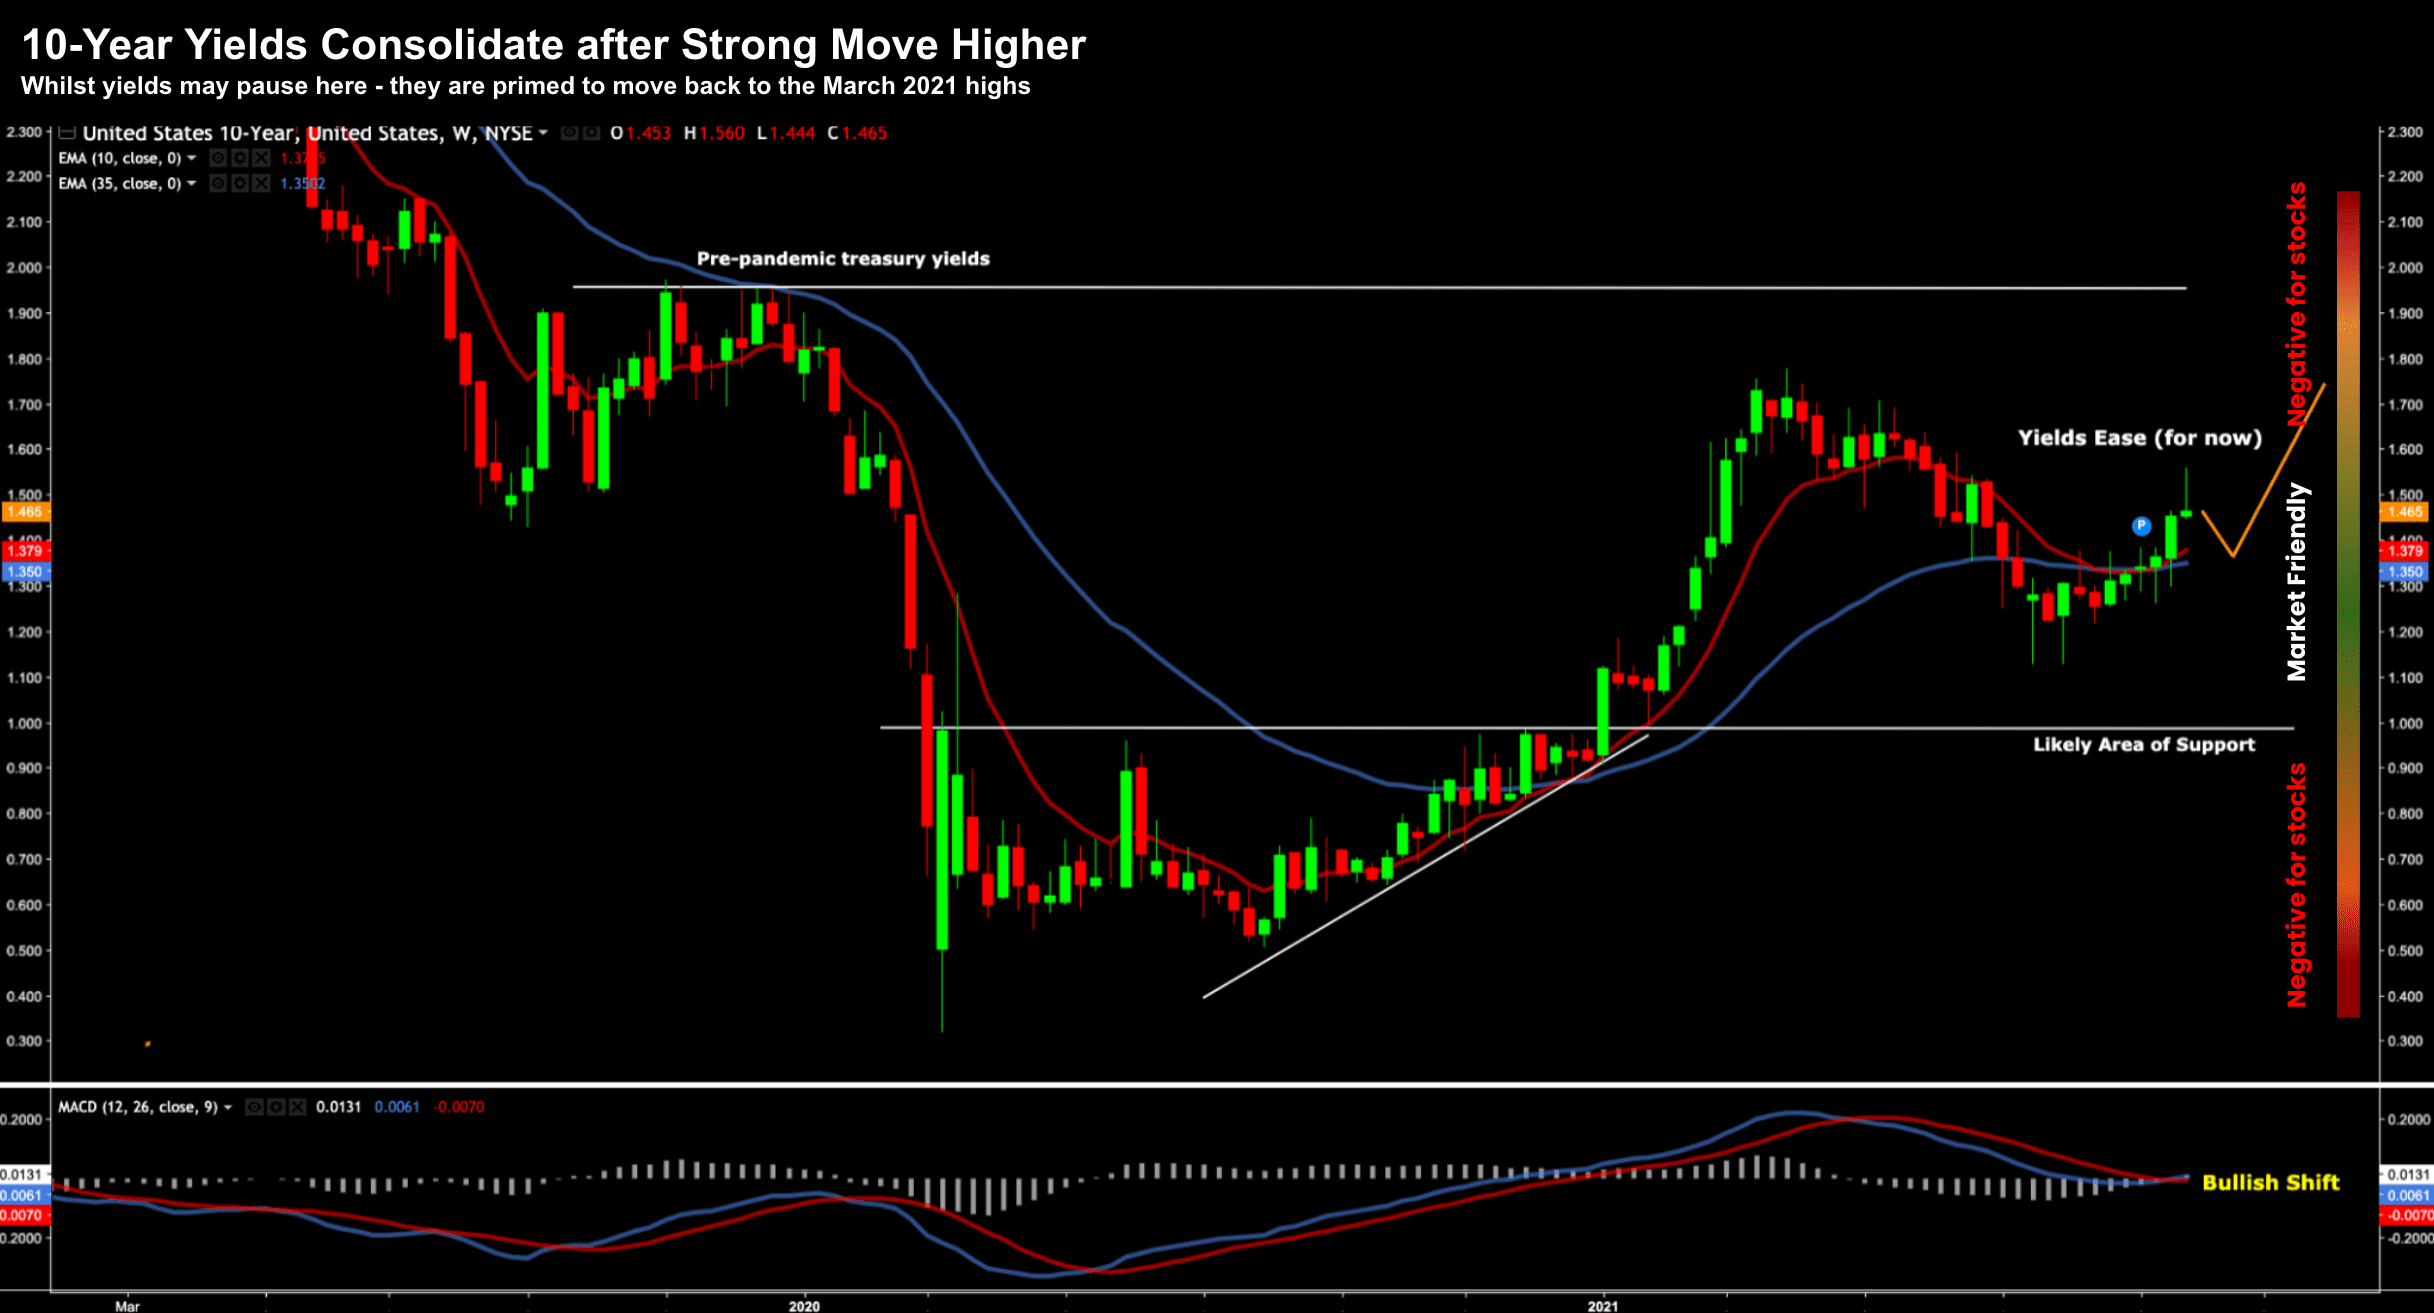
Bond Yields Pause as Stocks Exhale
Let"s quickly check in with US 10-year bond yields – as I expect them to consolidate around the 1.50% zone before moving higher.
October 01 2021
Here we see the long tail on the most recent candle… as yields jumped higher but pulled back.
I think this remains a relatively market-friendly zone for the 10-year — but I think we are header higher in the months ahead (especially given what we see with monthly inflation prints)
And pending the speed of that increase – it could have a negative impact on equities.
Which brings me to the S&P 500….
Yesterday I shared the weekly chart – and today"s activity didn"t change anything on that front.
As I say, the S&P 500 was marginally higher.
However tonight I wanted to share some (much needed) perspective with the monthly chart:
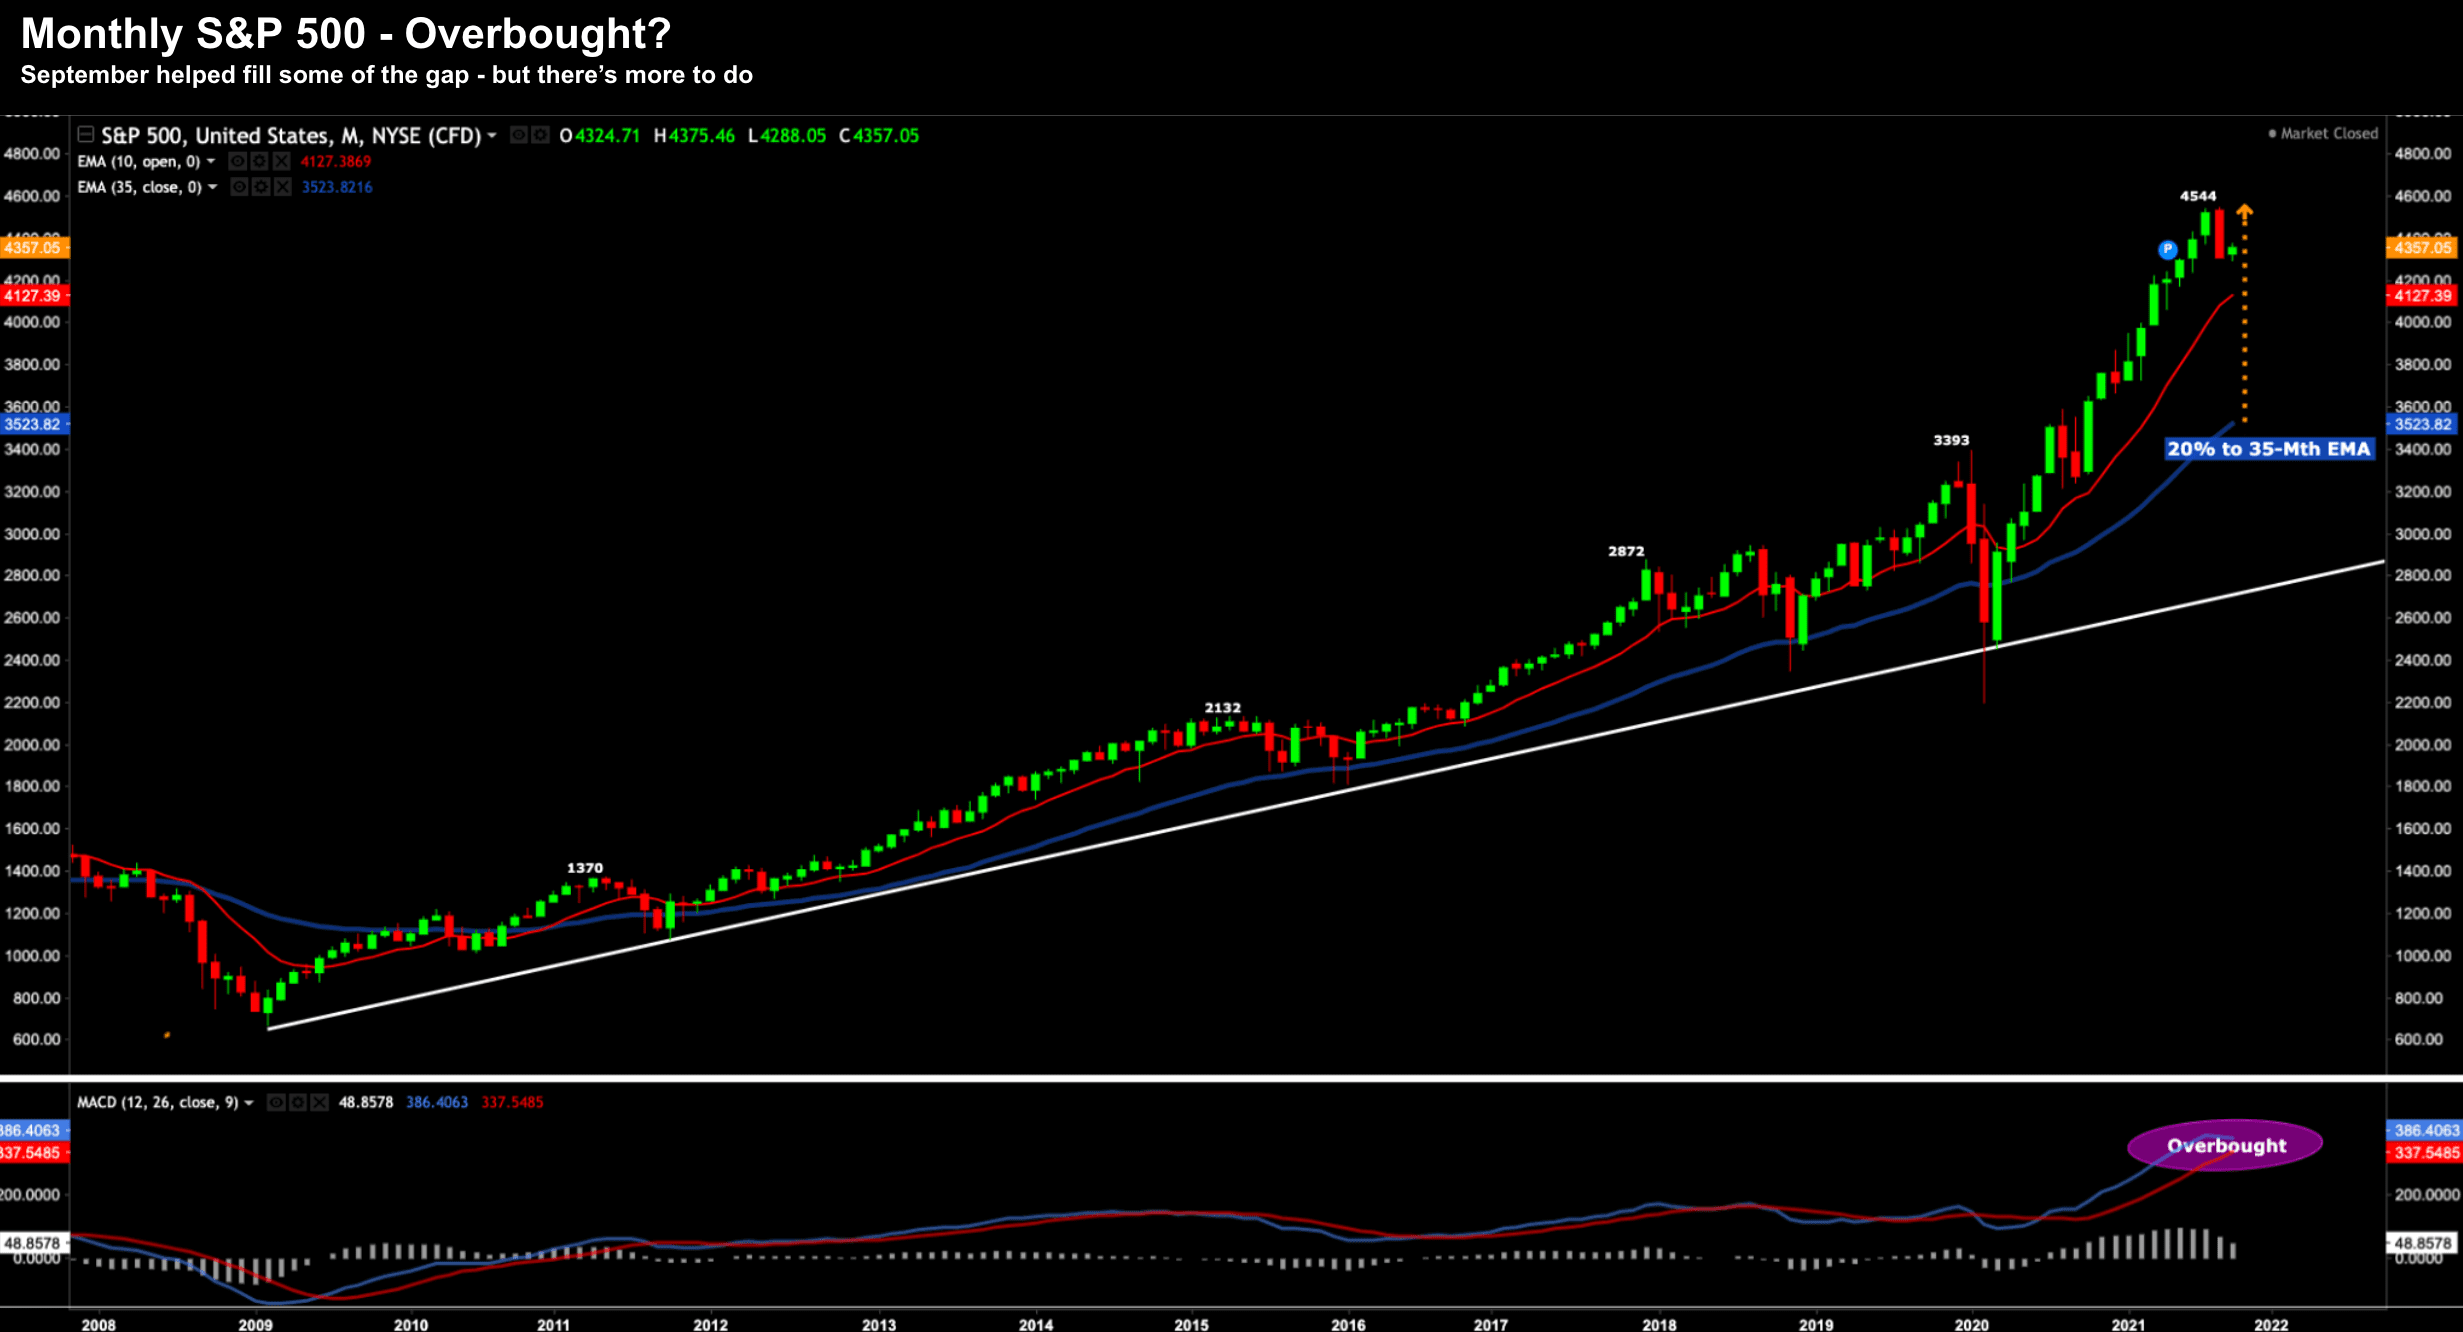
October 01 2021
At the start of September – I shared this chart sketching in the delta to the 35-Mth EMA (i.e. a 20% delta to the high)
September helped reduce that margin – with the largest monthly decline since March 2020
Using this perspective – you can see why I think there is more ahead.
I think our first step is the 10-month EMA (red line).
That is around 4136 (i.e. in the middle of my targeted 4100 to 4200 zone on the weekly chart)
However, keep an eye on the monthly-MACD in the lower window
Should the blue line move back below the red (it hasn"t yet) – you can be reasonably certain a solid correction is on the way.
For example, take a look at previous monthly crosses in 2007, 2011, 2015, October 2018 and more recently February 2020 (just prior to the crash in March).
My best guess – we see this roll in the coming months – with the market set to trade somewhere between the 10-month and 35-month EMAs.
And that will be your next long-term investment opportunity.
Putting it All Together…
I think traders should expect more days like this week.
There will be furious selling days and others where bargain hunters sniff around.
But step back beyond the daily noise… and look at the weekly and monthly charts.
Are we making new highs in these timeframes? Or lower highs?
What do we see with momentum indicators?
I don"t pay a great deal of attention to daily charts for two reasons:
(a) it"s a lot of noise; and
(b) I don"t trade on a daily basis.
Heck, there are some months when I may not place a trade at all.
For what it"s worth, I did place one new trade this week and it"s a stock I have been watching closely.
I sold January $190 Puts on Eli Lilly (LLY) when it traded around $220 (i.e. at its 35-week EMA) for around an ~8% annualized return.
The stock is down from its $275 high where it traded in August.
It"s a stock I would love to pick up at $190 if it presents (I don"t think it will)… but happy collecting ~8% on my capital if it doesn"t materialize.
With that… enjoy the weekend.