Why Markets Crash; and Why It Spells Opportunity
- Central banks exaggerate the boom and bust cycle
- Examining the "E" in PE; and Free Cash Flow Yields to find value
- Timeless investing lessons for a "19-year" old
To frame this missive, let"s start with stock market history:
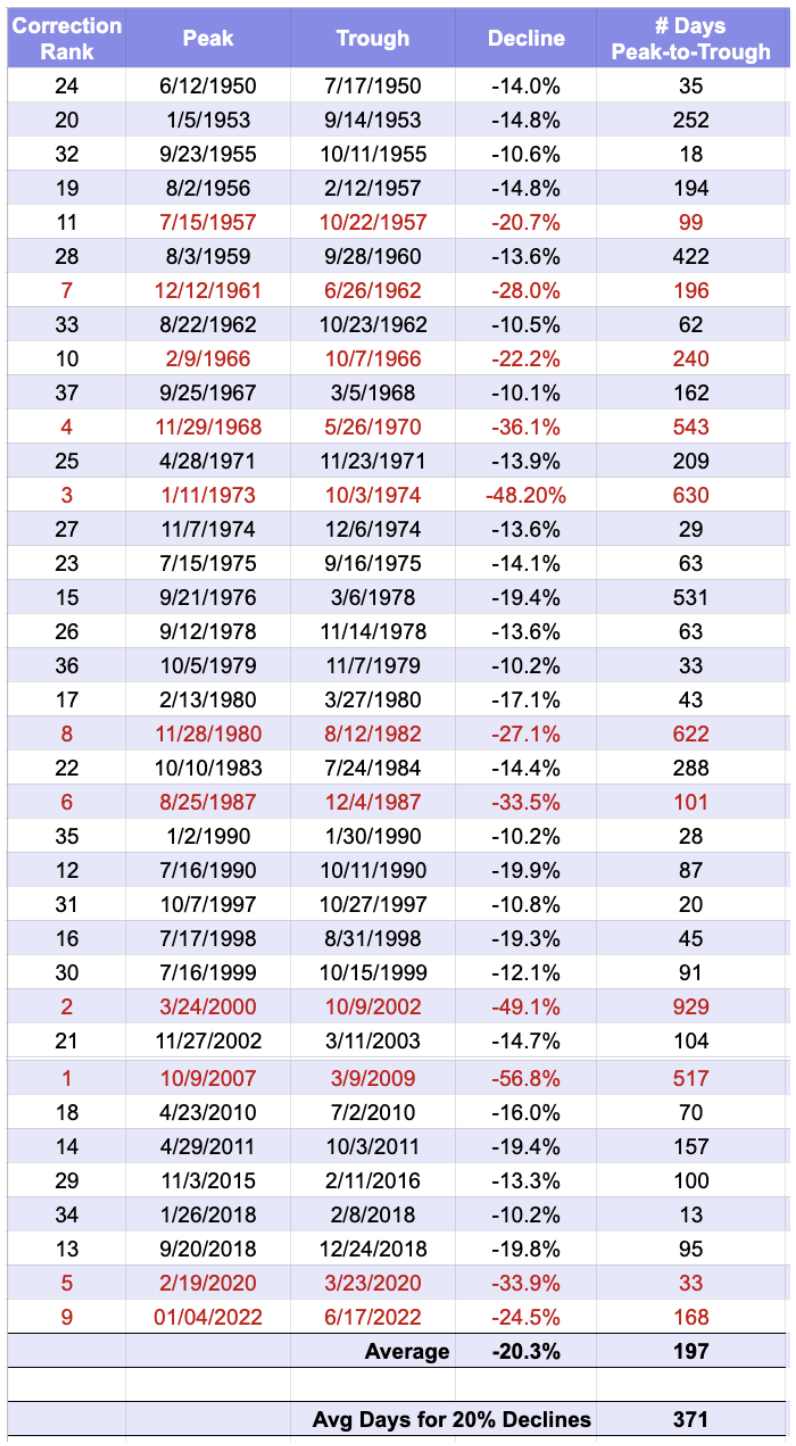
Since 1950 the S&P 500 has experienced 37 corrections of at least 10%.
Of those 37 corrections – the stock market has "crashed" more than 20% 11 times (including the correction of 2022).
And finally, the average decline of all 37 corrections is 20.3%; with the average peak-to-decline lasting 197 days.
Over the past 25 years – I"ve traded through 13 of these drawdowns (i.e, 35% of the 37)
This kind of volatility only helps to improve you as a trader and/or investor (as I will explain further in the post).
Drawdowns are part of the journey.
2022 marks the 11th downturn greater than 20%.
And if we were to end the year today – the current peak-to-trough decline of 24.5% would mark the 9th largest correction of the past seventy-two years.
That"s not insignificant.
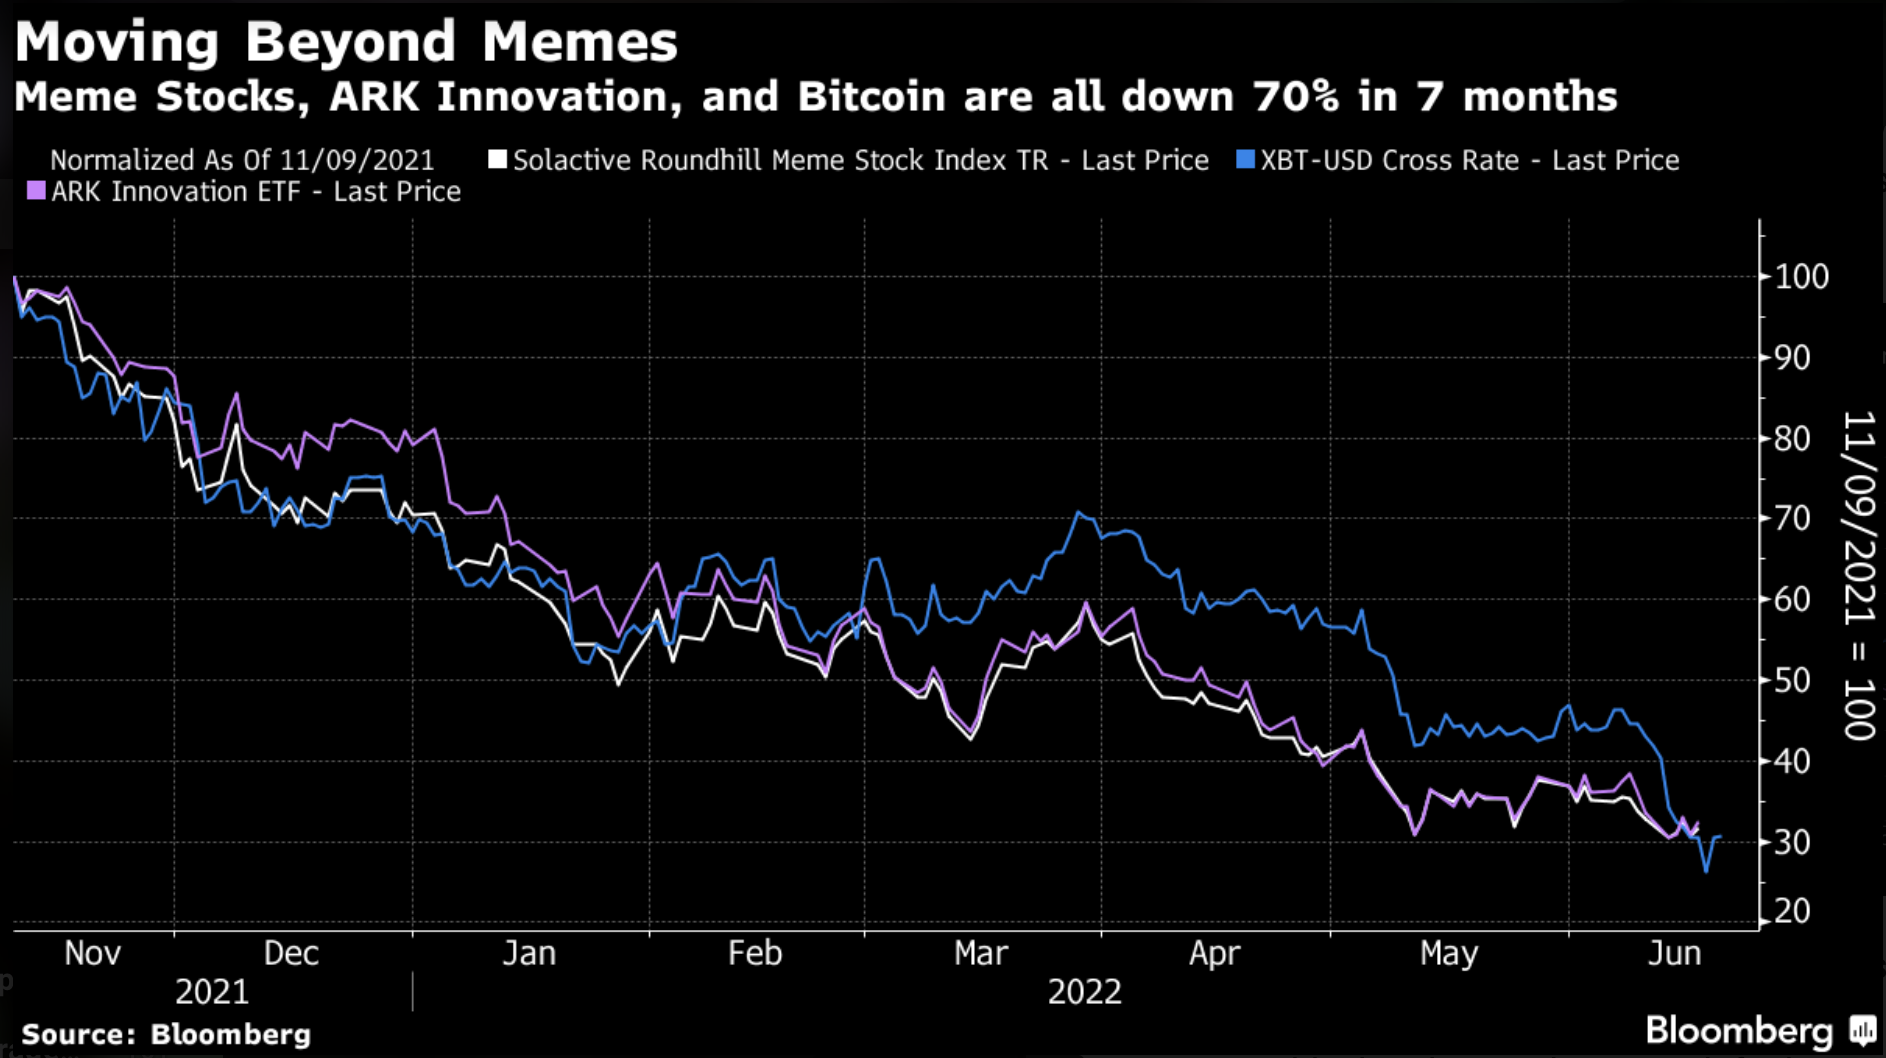
And it"s cost plenty of experienced fund managers at least 50% of their portfolios (e.g. Cathie Wood, Chase Coleman, Brad Gerstner and Gabe Plotkin to name a few)
"Chase Coleman"s growth-focused flagship fund at Tiger Global tumbled 15% last month, pushing its 2022 route to 44% and wiping out nearly all of its gains since 2019, according to Bloomberg News. Its biggest holdings as of the end of 2021 included JD.com, Microsoft and Sea Ltd, which are all down double digits this year"
At 168 calendar days into the 2022 drawdown – there"s likely more to go.
However, declines are never straight down. For example bear market rallies are typically extremely sharp (and I suspect we are due for one soon).
Further to recent missive(s) – the good news is I think we"re approaching an attractive long-term opportunity (for those who have the available capital).
As I"ve demonstrated in past missives – buying when panic is greatest has netted returns in excess of 12% per year for years to come.
Experienced traders will recognize this. What"s more, they capitalize on it.
Hopefully this missive will help you to:
- understand why asset prices expand (and contract);
- how to identify when this happens (i..e, helping you to de-risk ahead of drawdowns); and perhaps most important
- knowing the right time to capitalize on longer-term attractive risk/reward opportunities.
The game of asset speculation is not for the faint of heart. However, given time, experience, and the application of knowledge – it can be extremely profitable.
Let"s start by explaining (in simple terms) what led to the ~24% correction this year.
The Origin of all Asset Bubbles
So what causes markets to crash?
For example, is it no more complicated that basic human emotions of fear and greed?
That"s certainly part of it.
Is it the so-called algorithms triggering waves of selling at predefined stops? Or perhaps margin calls on those who trade with excessive leverage – being forced to sell?
I am sure all of those things are in there…
But if you ask me – the primary source of today"s excessive volatility (and drawdown) is attributable to the actions of central banks (and what we see with bond yields).
And here I"m not just talking to the US Federal Reserve.
These actions have been repeated by central banks such as the Reserve Bank of Australia, the European Central Bank, Bank of Japan, Bank of England and so on.
Globally there has been a coordinated interventionist approach to achieve two objectives:
- artificially suppress interest rates for many years; and
- flood markets with liquidity (i.e., money supply)
These two actions have the effect of expanding (and distorting) how we price risk (i.e., debt).
And with debt incorrectly priced – this has a direct impact on the face value of risk assets (i.e. bonds, stocks and houses).
Now this formula works wonderfully when asset prices are rising.
However, it feels orders of magnitude worse when asset values revert (especially if those assets were bought with leverage)
Debt is a double-edged sword.
For over a decade, central banks have artificially held interest rates lower through a process known as "quantitative easing" (QE).
Put simply, central banks print money to buy assets such as government debt (treasury bonds), mortgage debt and in the case of the pandemic – corporate debt.
Consider the actions of the US Federal Reserve…
The Fed injected approximately US $9 trillion into their economy over the past ~20 years.
As this chart shows – almost 50% of the expansion was from current Fed Chair Jay Powell.
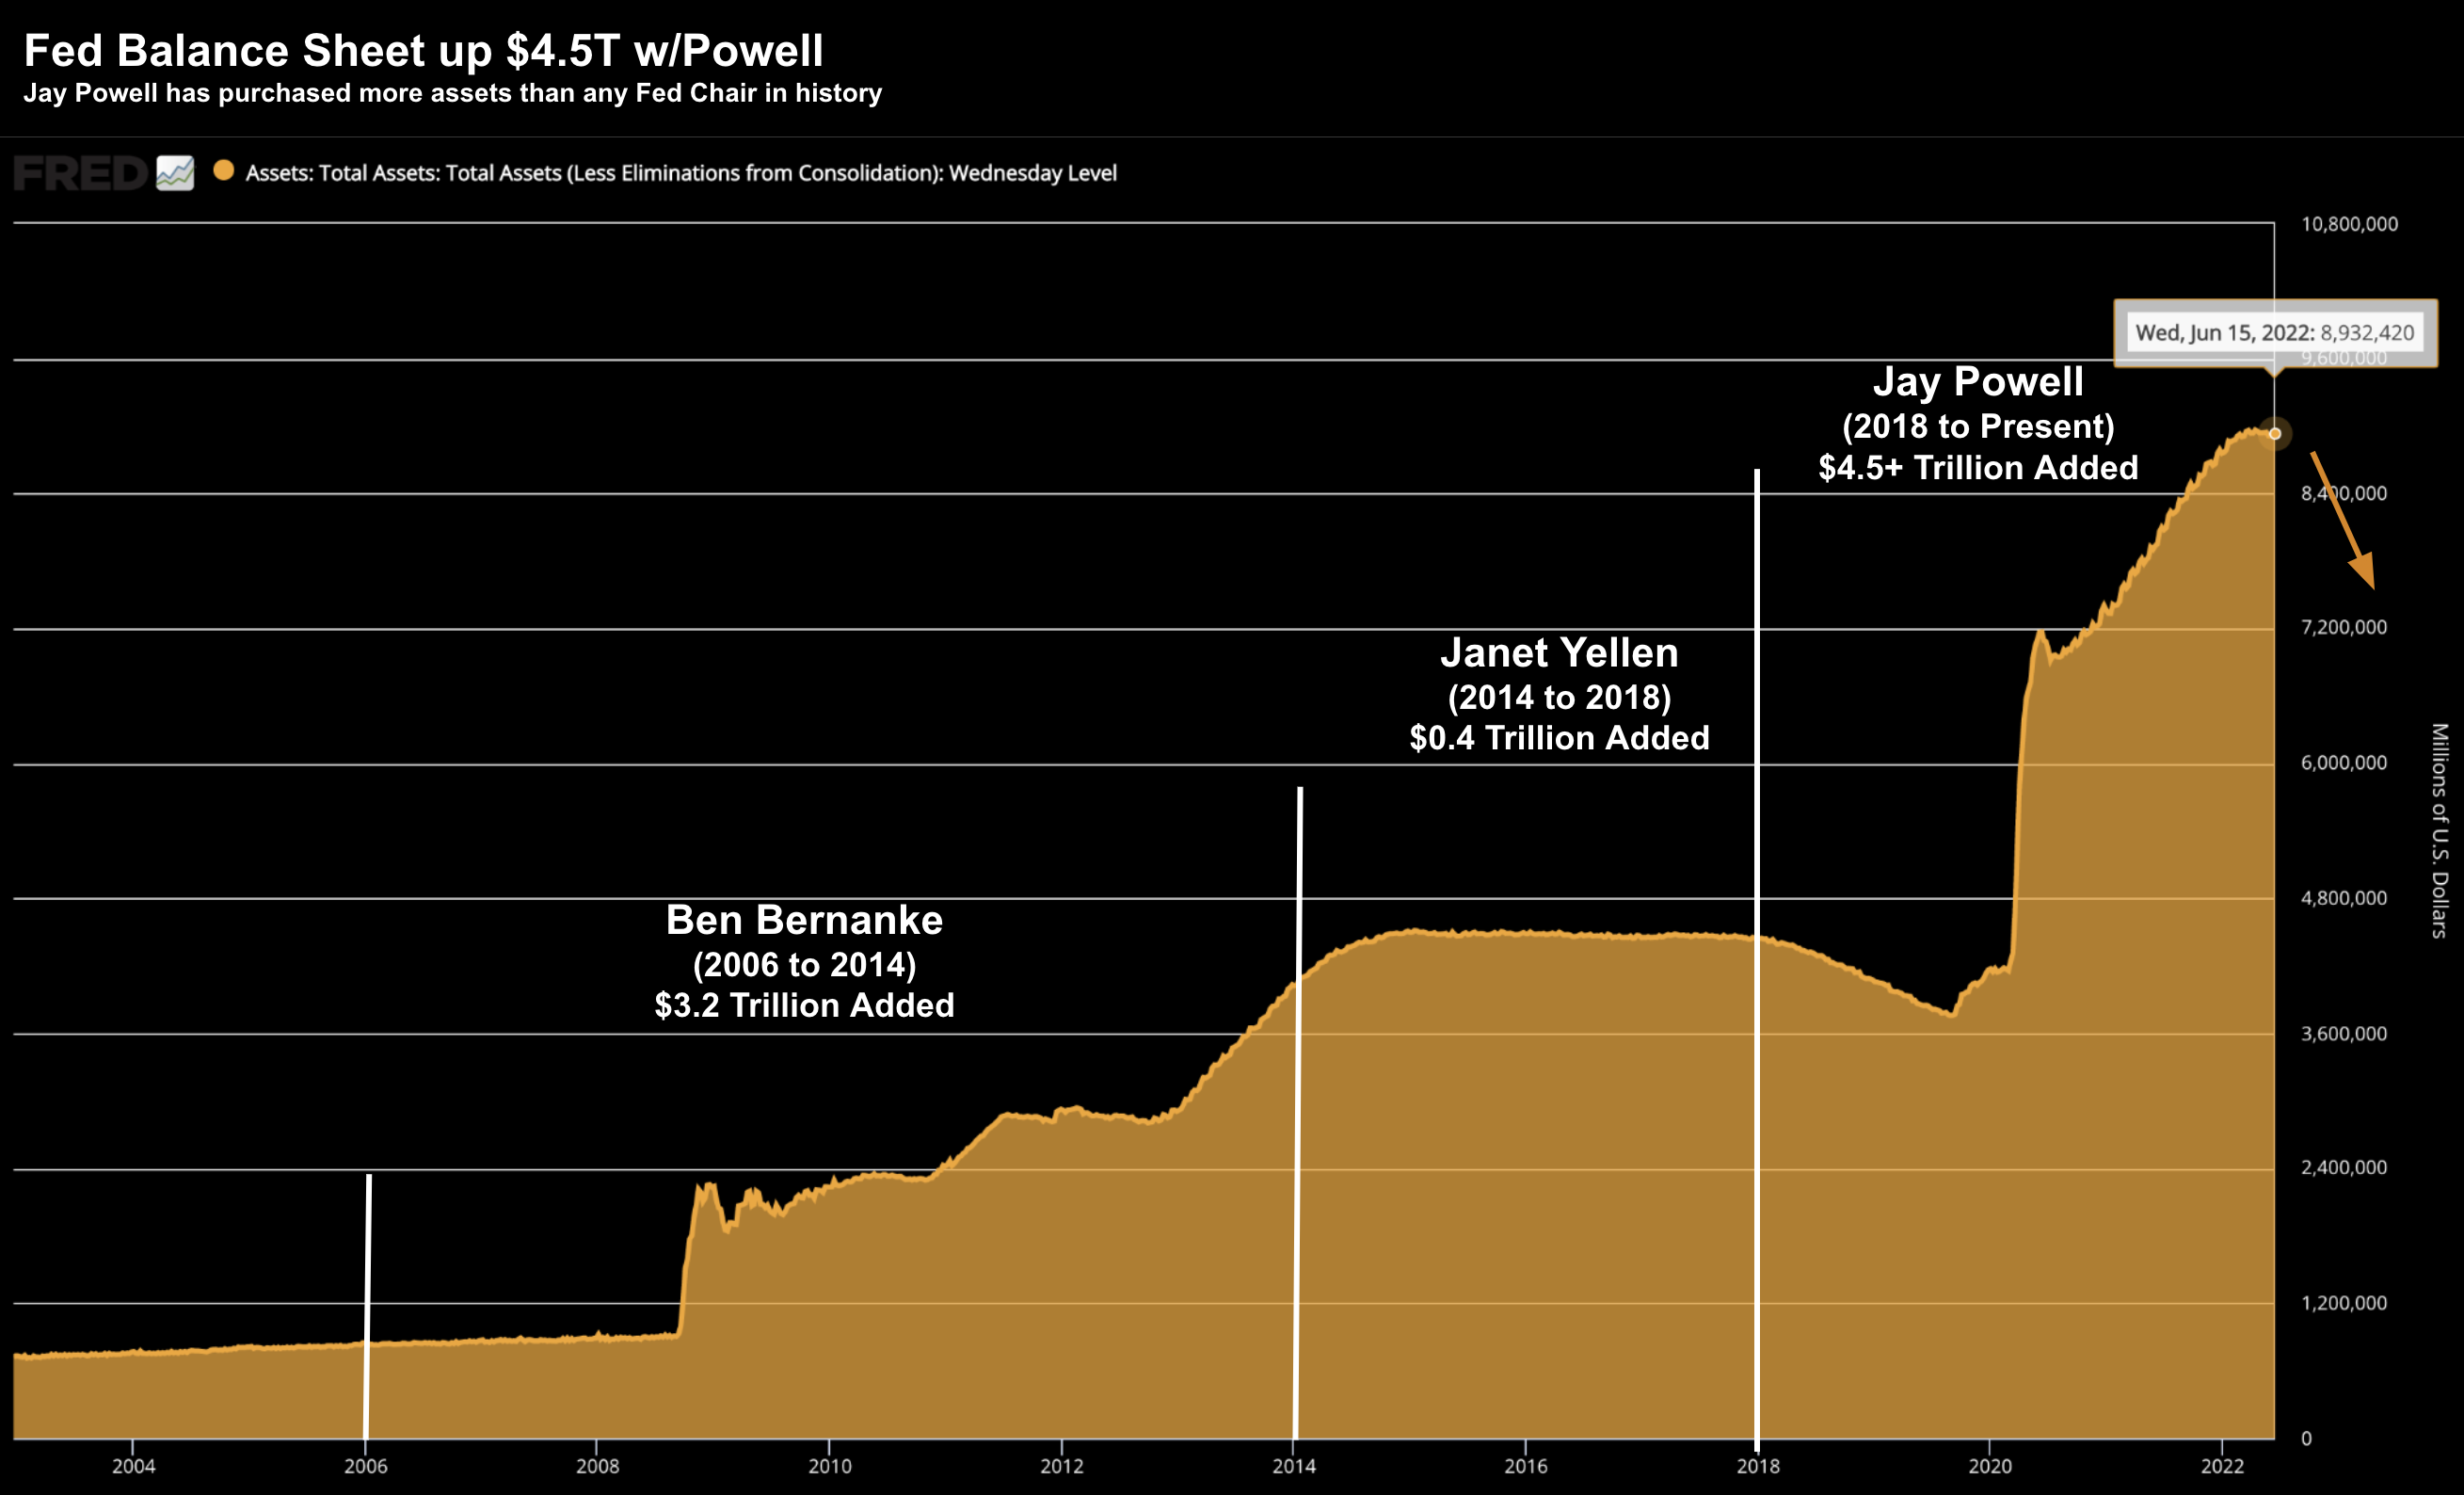
Now when you consider US GDP is only around $20 Trillion – adding $9 Trillion is going to have a material impact.
And in this case, it has distorted the price of everything.
However, as the likes of "Cathie Wood" et al have begun to realise… what goes straight up… typically comes straight down.
Whilst the distortion in asset prices is now becoming obvious (with housing likely to follow) – perhaps the largest distortion is what we"ve seen with the price of debt (evidenced by long-term trend with US 10-Year Treasury yield)
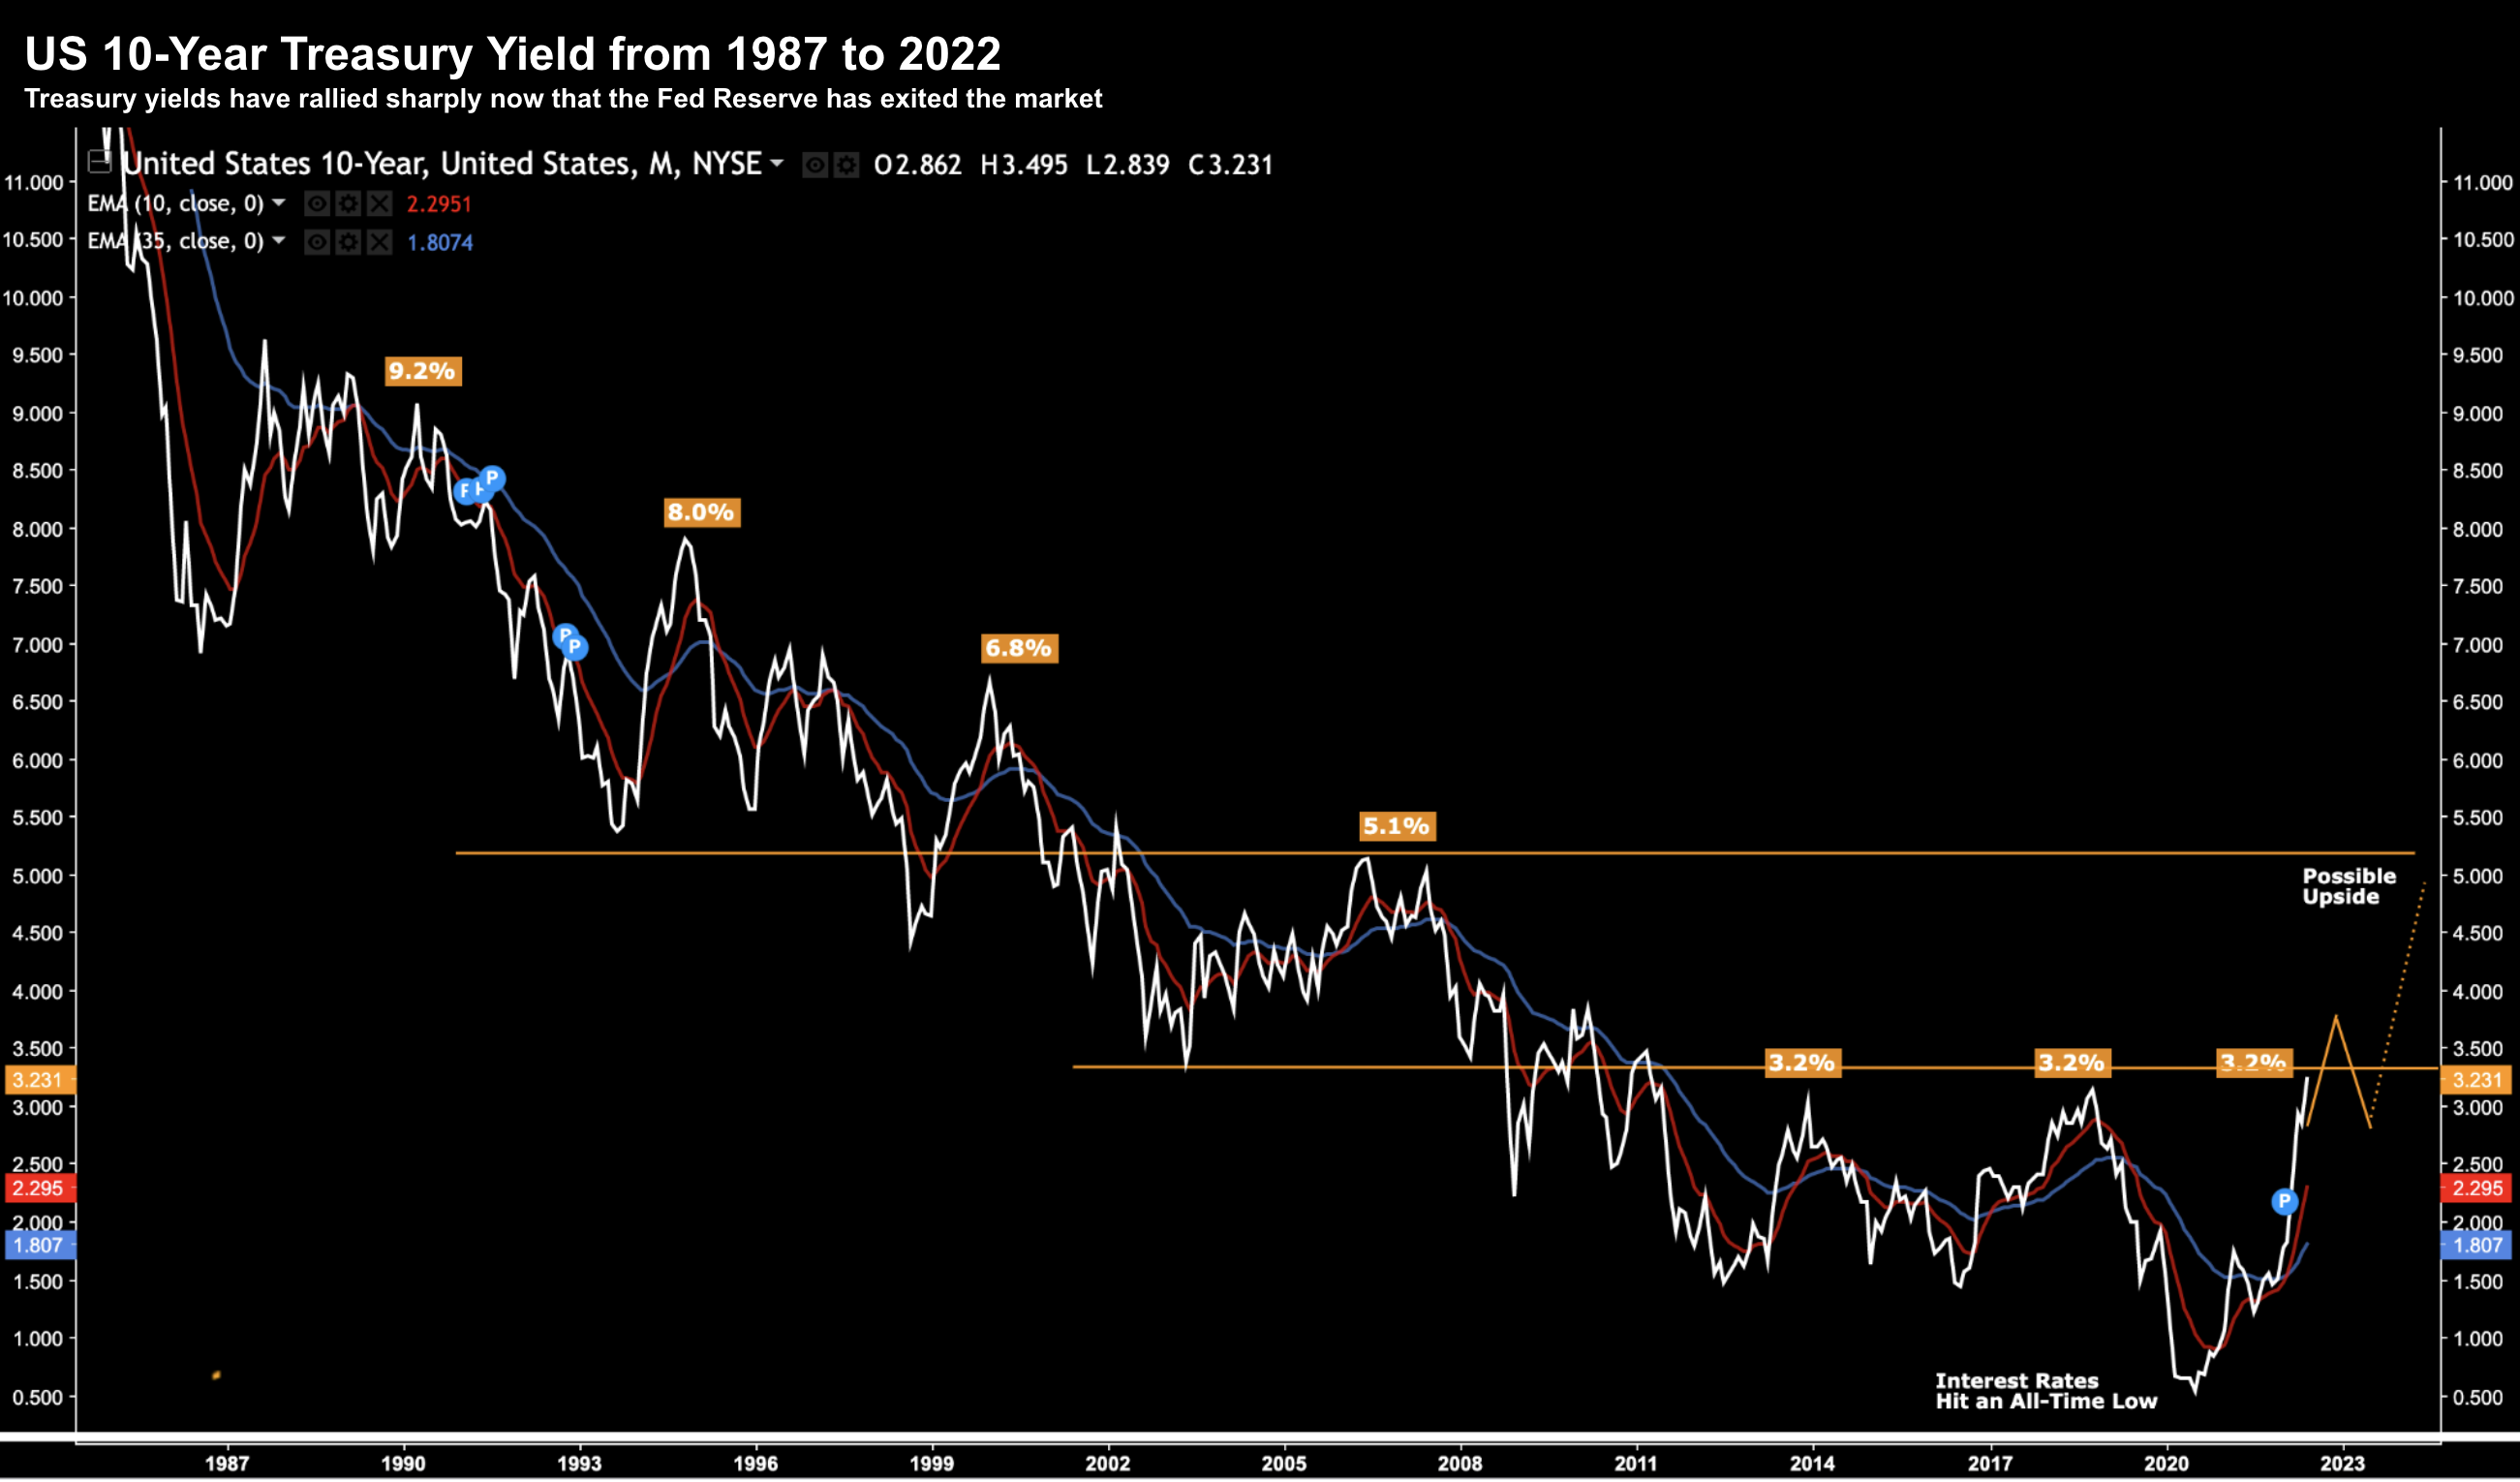
For decades the price of debt has continued to trade lower… with the yield on the US 10-Year Treasury hitting an all-time low of 0.50% last year.
However, what"s more important is how yields trade in real terms.
This is where the nominal yield (shown above) is adjusted for inflation.
For example, with the US 10-year at 3.2% today less the consumer price inflation (CPI) of 8.6% – this constitutes a negative yield of -5.4%
Negative yields are highly inflationary.
What"s more, negative yields force investors further up the "risk curve" in order to get a return on their capital (known as "TINA" – There Is No Alternative)
Globally, there is something like US $16 trillion worth of negative yielding debt (where global GDP is estimated to be around $102T)
That is a frightening sum.
Again, this works if interest rates remain artificially low.
However, if interest rates are allowed to rise… it presents central banks with a combustible mix.
Which brings me to the second chapter of this story… the return of the bond vigilantes and inflation.
The Return of Bond Vigilantes…
Up until last year, central banks were still targeting an inflation rate of 2%.
For example, as at November 2021, with inflation CPI running above 6%, the Fed Reserve maintained:
(a) nominal rates at zero; with
(b) asset sheet expansion.
Their firmly-held belief through 2021 was that any inflationary pressure was likely "transitory".
And any adverse impacts opposite $4.5 Trillion added to their balance sheet would mostly be non-consequential.
Late last year the Fed reluctantly admitted their mistake.
Janet Yellen – now Treasury Secretary to Biden – offered a shallow apology.
Turns out it wasn"t possible to continue with negative real rates (along with balance sheet expansion) for 18 months only to have "transitory" inflation.
Unfortunately consumers are now paying the price in two-ways:
(a) risks assets (stocks and houses) are being crushed with higher rates; and
(b) they"re forced to pay more for all goods and services (e.g., rent, food and energy)
With respect to higher interest rates – the Fed are now effectively saying "good luck".
For example, the average US 30-year fixed loan is now pushing 6% (from below 3% just one year ago).
Yes… the Fed has "left the building".
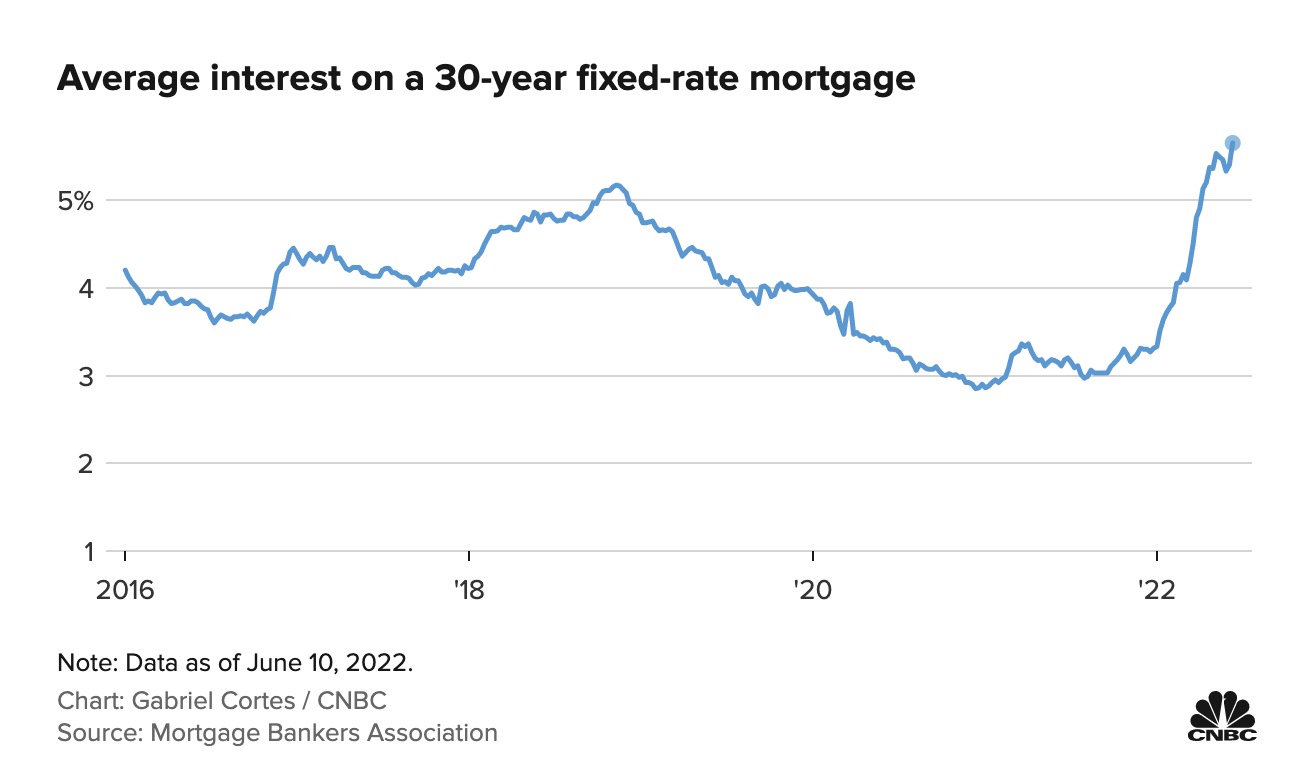
Here"s Bankrate.com (June 20th)
Mortgage rates plunged early in the pandemic and scraped record lows — below 3 percent — at the start of 2021.
The days of sub-3 percent mortgage interest on the 30-year fixed are behind us, and rates rose past 5 percent in 2022.
"Low interest rates were the medicine for economic recovery following the financial crisis, but it was a slow recovery so rates never went up very far," says Greg McBride, CFA, Bankrate chief financial analyst.
"The rebound in the economy, and especially inflation, in the late pandemic stages has been very pronounced, and we now have a backdrop of mortgage rates rising at the fastest pace in decades."
Artificially low rates are indeed medicine. However, they are not considered medicine if anchored there for several years.
Medicine turns from being helpful to something more akin to an opioid crisis.
Due to a combination of reckless fiscal and monetary policy – we are seeing the (much awaited) return of the bond vigilantes.
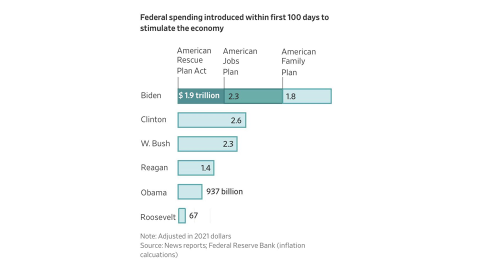
For example, with respect to fiscal policy (cue Janet Yellen) — the current administration spent an incredible $3.5 Trillion in their first 100 days in power.
This would have been closer to $5 Trillion if the "Build Back Better" plan was not blocked (making the inflation problem far more acute).
The problem for Biden is market forces are now aggressively ratcheting up the real cost of borrowing money.
Again, these are bond vigilantes selling large amounts of debt opposite years of reckless monetary and fiscal policy (in turn sending yields higher)
As a complete aside China cut its holding of US debt to the lowest level in 12 years.
"China trimmed its holdings of US Treasury bonds for a fourth straight month in March by more than $15.2 billion, taking the total holdings to the lowest level since June 2010, in what experts said was a move to reduce losses as Treasury bond prices slid and help diversify China"s foreign exchange holdings in the long run"
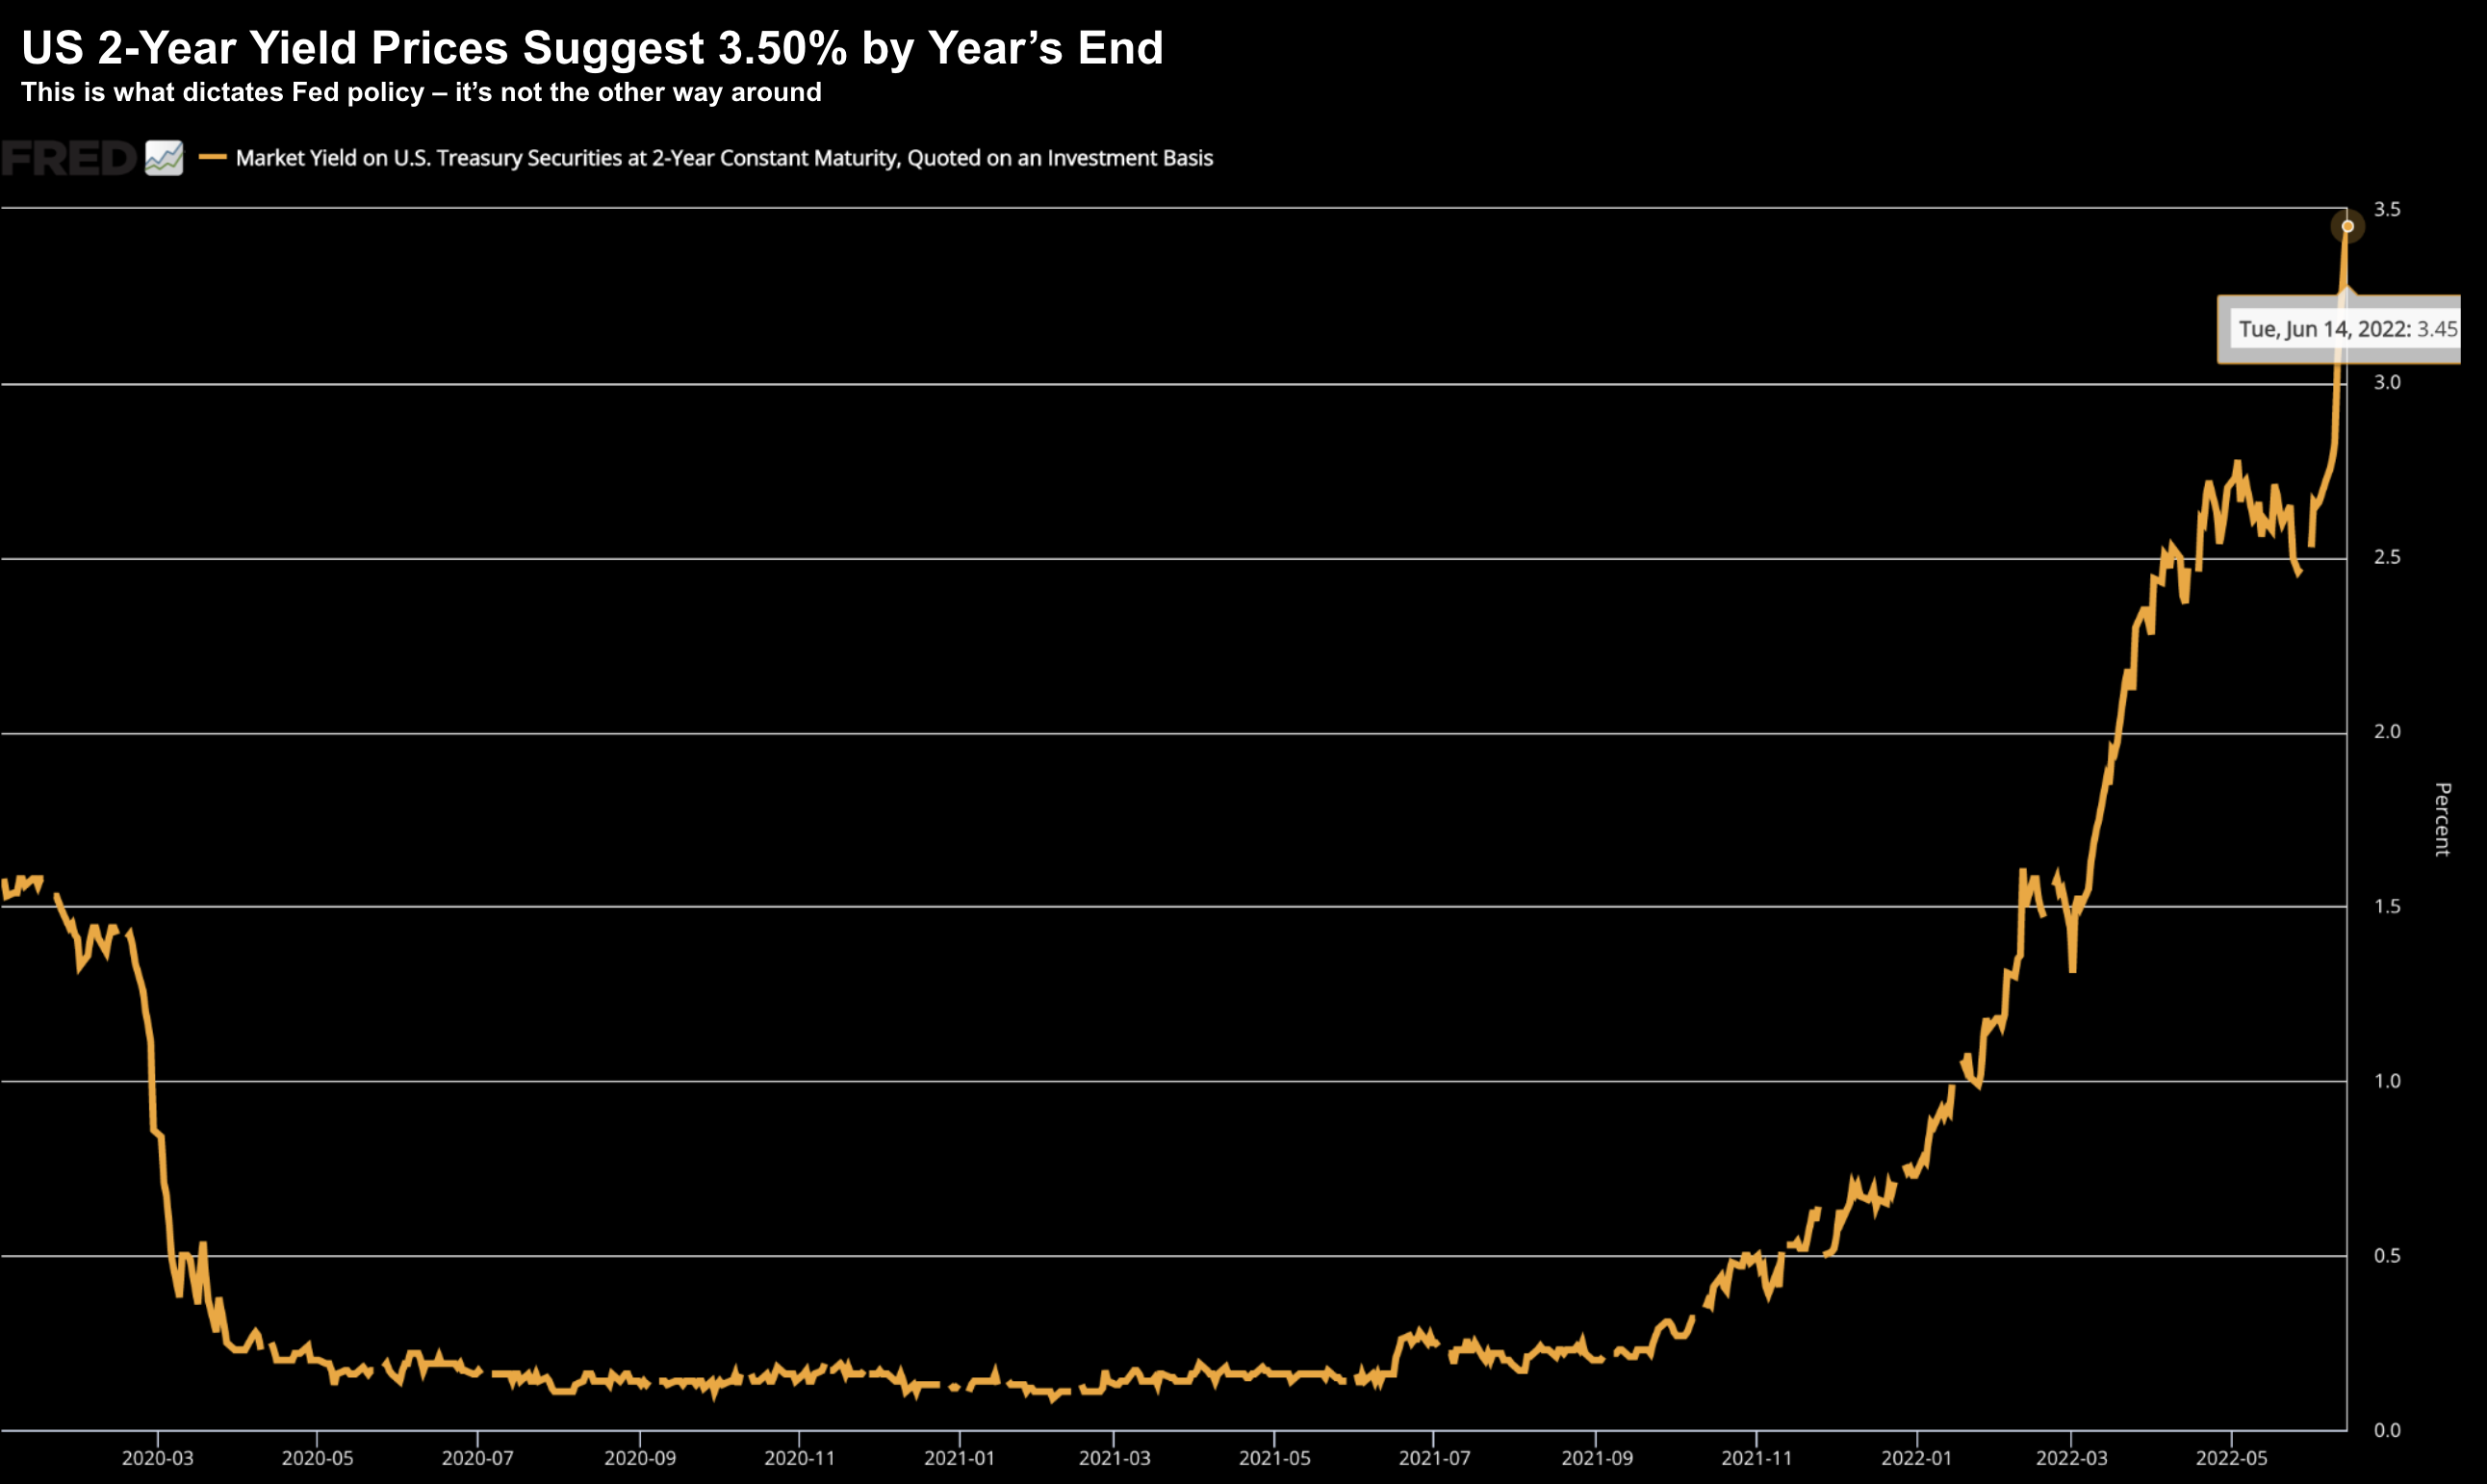
Perhaps the pain is most acute with the US 2-Year Treasury yield.
As I explained in recent posts, this tells me the Fed will likely invoke a nominal rate of 3.50% by year"s end… possibly higher.
And what"s that likely to do to the housing market?
I don"t imagine it"s positive.
Put together, this is what has given rise to the 20%+ drawdown (and volatility) in equity markets.
And until we the bond markets find their new equilibrium (and we are not there yet) – it"s unlikely equities will settle down.
This is why we are here today.
Through a combination of artificially low rates for too long (coupled with QE) – in addition to excessive levels of government spending – the price of everything went up.
However that trade is now in reverse as the market faces the full force of higher bond yields
But it"s not all bad news…
In the short-term, it will likely mean acute pain for those who have:
- committed large amounts of capital at higher prices; or
- borrowed money above their means
However, for those who have the means, the correction of 2022 will likely represent a once-in-a-decade type opportunity to capitalize on outsized market returns for the long-term.
Assessing the Opportunity
To be clear, I don"t think we have seen the bottom for 2022 .
But we are certainly a lot closer…
My best guess (and it"s only a guess) is we are maybe 10-15% within making a bottom.
What follows is my logic opposite:
- Earnings and Price-to-Earnings Ratios
- Total Market Free Cash Flow Yields; and
- Technical areas as likely support
#1. Earnings / Forward PE"s
At the time of writing, the S&P 500 trades ~16x forward price-to-earnings (PE).
The 100-year historical PE average is in the realm of 15.5x.
However, over the past 40 years, the average PE for the market has been closer to 19x (largely due to suppressed interest rates and QE)
When the S&P 500 peaked at 4817 earlier this year – it traded with a ~21x forward PE.
Some may argue that is a whopping 35% premium to the 100-year market average. However, in the modern-era of lower rates – it was perhaps closer to a 15-20% premium.
Irrespective, the difficult challenge facing investors today is two-fold:
(a) what is the appropriate earnings multiple? and
(b) what is the expected "E" in P/E – given the various (global) headwinds?
Various analysts will have different opinions on these two questions.
For example, I"ve read analysts seeing the "E" as low as $190 for the S&P 500 over the next two quarters – which represents a reduction of ~20% on today"s expectations.
Similarly, I"ve seen estimates as high as $240 per share given:
- anticipated $1 Trillion of planned share buy-backs; and
- operationally "lean" companies post-COVID.
For what it"s worth, Factset"s current estimates suggest Q2 earnings in the realm of ~$240 per share; where
- Q2 earnings are likely to show annualized growth of ~4.3%.
- Based on June 15th close (3790) – the forward PE was 15.8x (implying EPS $239.81)
By way of example only – if we revise down earnings in the realm of 10% – this would see EPS closer to $215 per share.
Assuming a forward PE of 15.5x – that puts the market at 3,332 (which would be a strong discount to modern-era average PE multiple of 19x)
From mine, if we"re to see the S&P 500 trade in the realm of 3200 to 3500 – this would represent a more compelling long-term risk reward.
2. S&P 500 Free Cash Flow Yield
My favourite financial health metric is free cash flow (FCF)
From mine, earnings are typically pro-forma. In other words, they are subject to certain projections and/or presumptions. Put simply, they can be manipulated.
However, free cash flow is financial truth.
You cannot pro-forma cash flow.
From mine, no other metric sheds light on the true financial health of a company.
Now, what"s helpful to understand in terms of a stock"s value is its FCF expressed as yield.
For example, take Google (GOOG) – which is my largest portfolio holding.
Google"s current market capitalization (at $2,143) is $1.42 Trillion. And according to Yahoo!Finance, their annualized free cash flow is $68.985B
Expressed as an FCF Yield – that is 4.86% (above average)
$68.985B / $1.42 Trillion = 4.86%
Now for reference purposes only – below is a table showing the FCF Yield for the Top 12 companies on the S&P 500 by market capitalization (far right hand column) — something I maintain for all 500 S&P companies.
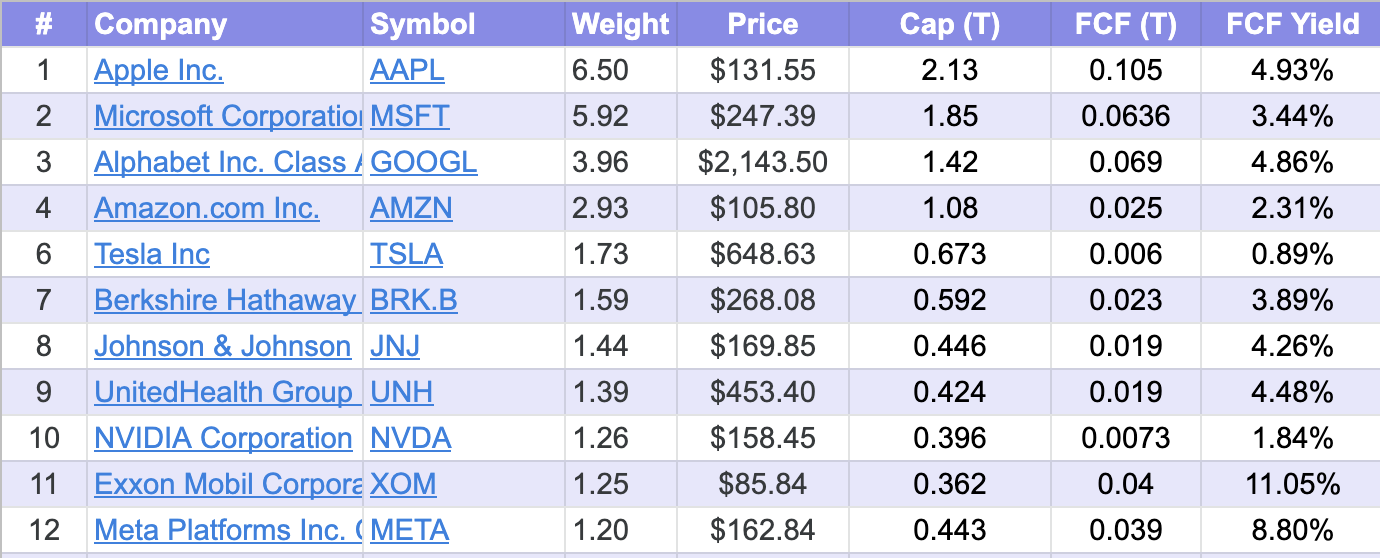
* Current to Jun 20 2022
Now what happens if we take this approach to the S&P 500 as a whole?
The current upper FCF Yield on the S&P 500 today is ~$1.5 Trillion.
Expressed as a percentage of market cap it"s ~4.5%
If we assume the S&P 500 falls another 10% (~3,372) – this will represent FCF Yield of ~5.0%
By way of comparison, in 2008 when stocks fell over 50%, the market"s FCF Yield was ~5.9%
That was the lowest point at which participants were willing to sell stock.
Now if you bought the Index with an FCF Yield of 5.9% in 2008 – your total CAGR from 2008 to today would be in the realm of 13%+ (i.e., a whopping 3% higher than the market"s long-term return)
In summary, today"s FCF Yield on the S&P 500 at 4.5% (with a price of 3674) is starting to get attractive.
However, I think once we get closer to a FCF Yield of 5.0%, this represents exceptional long-term value.
#3. Technical Setup
From a strictly fundamental lens (forward earnings ratios and FCF) – if we see the S&P 500 trade in the zone of 3200 to 3500 represents an attractive long-term investment.
That"s not to say the market could trade lower – it could.
For example, it"s near impossible to handicap all the inputs against how far earnings could fall (the "E"); and what forward multiple is most applicable opposite rising interest rates.
However, we can look to historical benchmarks for guidance.
The third (and final) lens I like to apply is a technical one.
In other words, irrespective of metrics such as forecast earnings, expected ratios and cash flow yields, what does price action tell us?
This should not be overlooked.
Before I begin, it"s worth noting the chart warned us in Q4 of 2021 that the market was dangerously extended.
For example, you didn"t need to understand things like "PE ratios" or "FCF Yields" to identify the risks.
I shared this monthly chart Nov 26th warning of the downside risks ahead in the first half of 2022 (flagging a zone of 3400 to 3800 as an area of support):
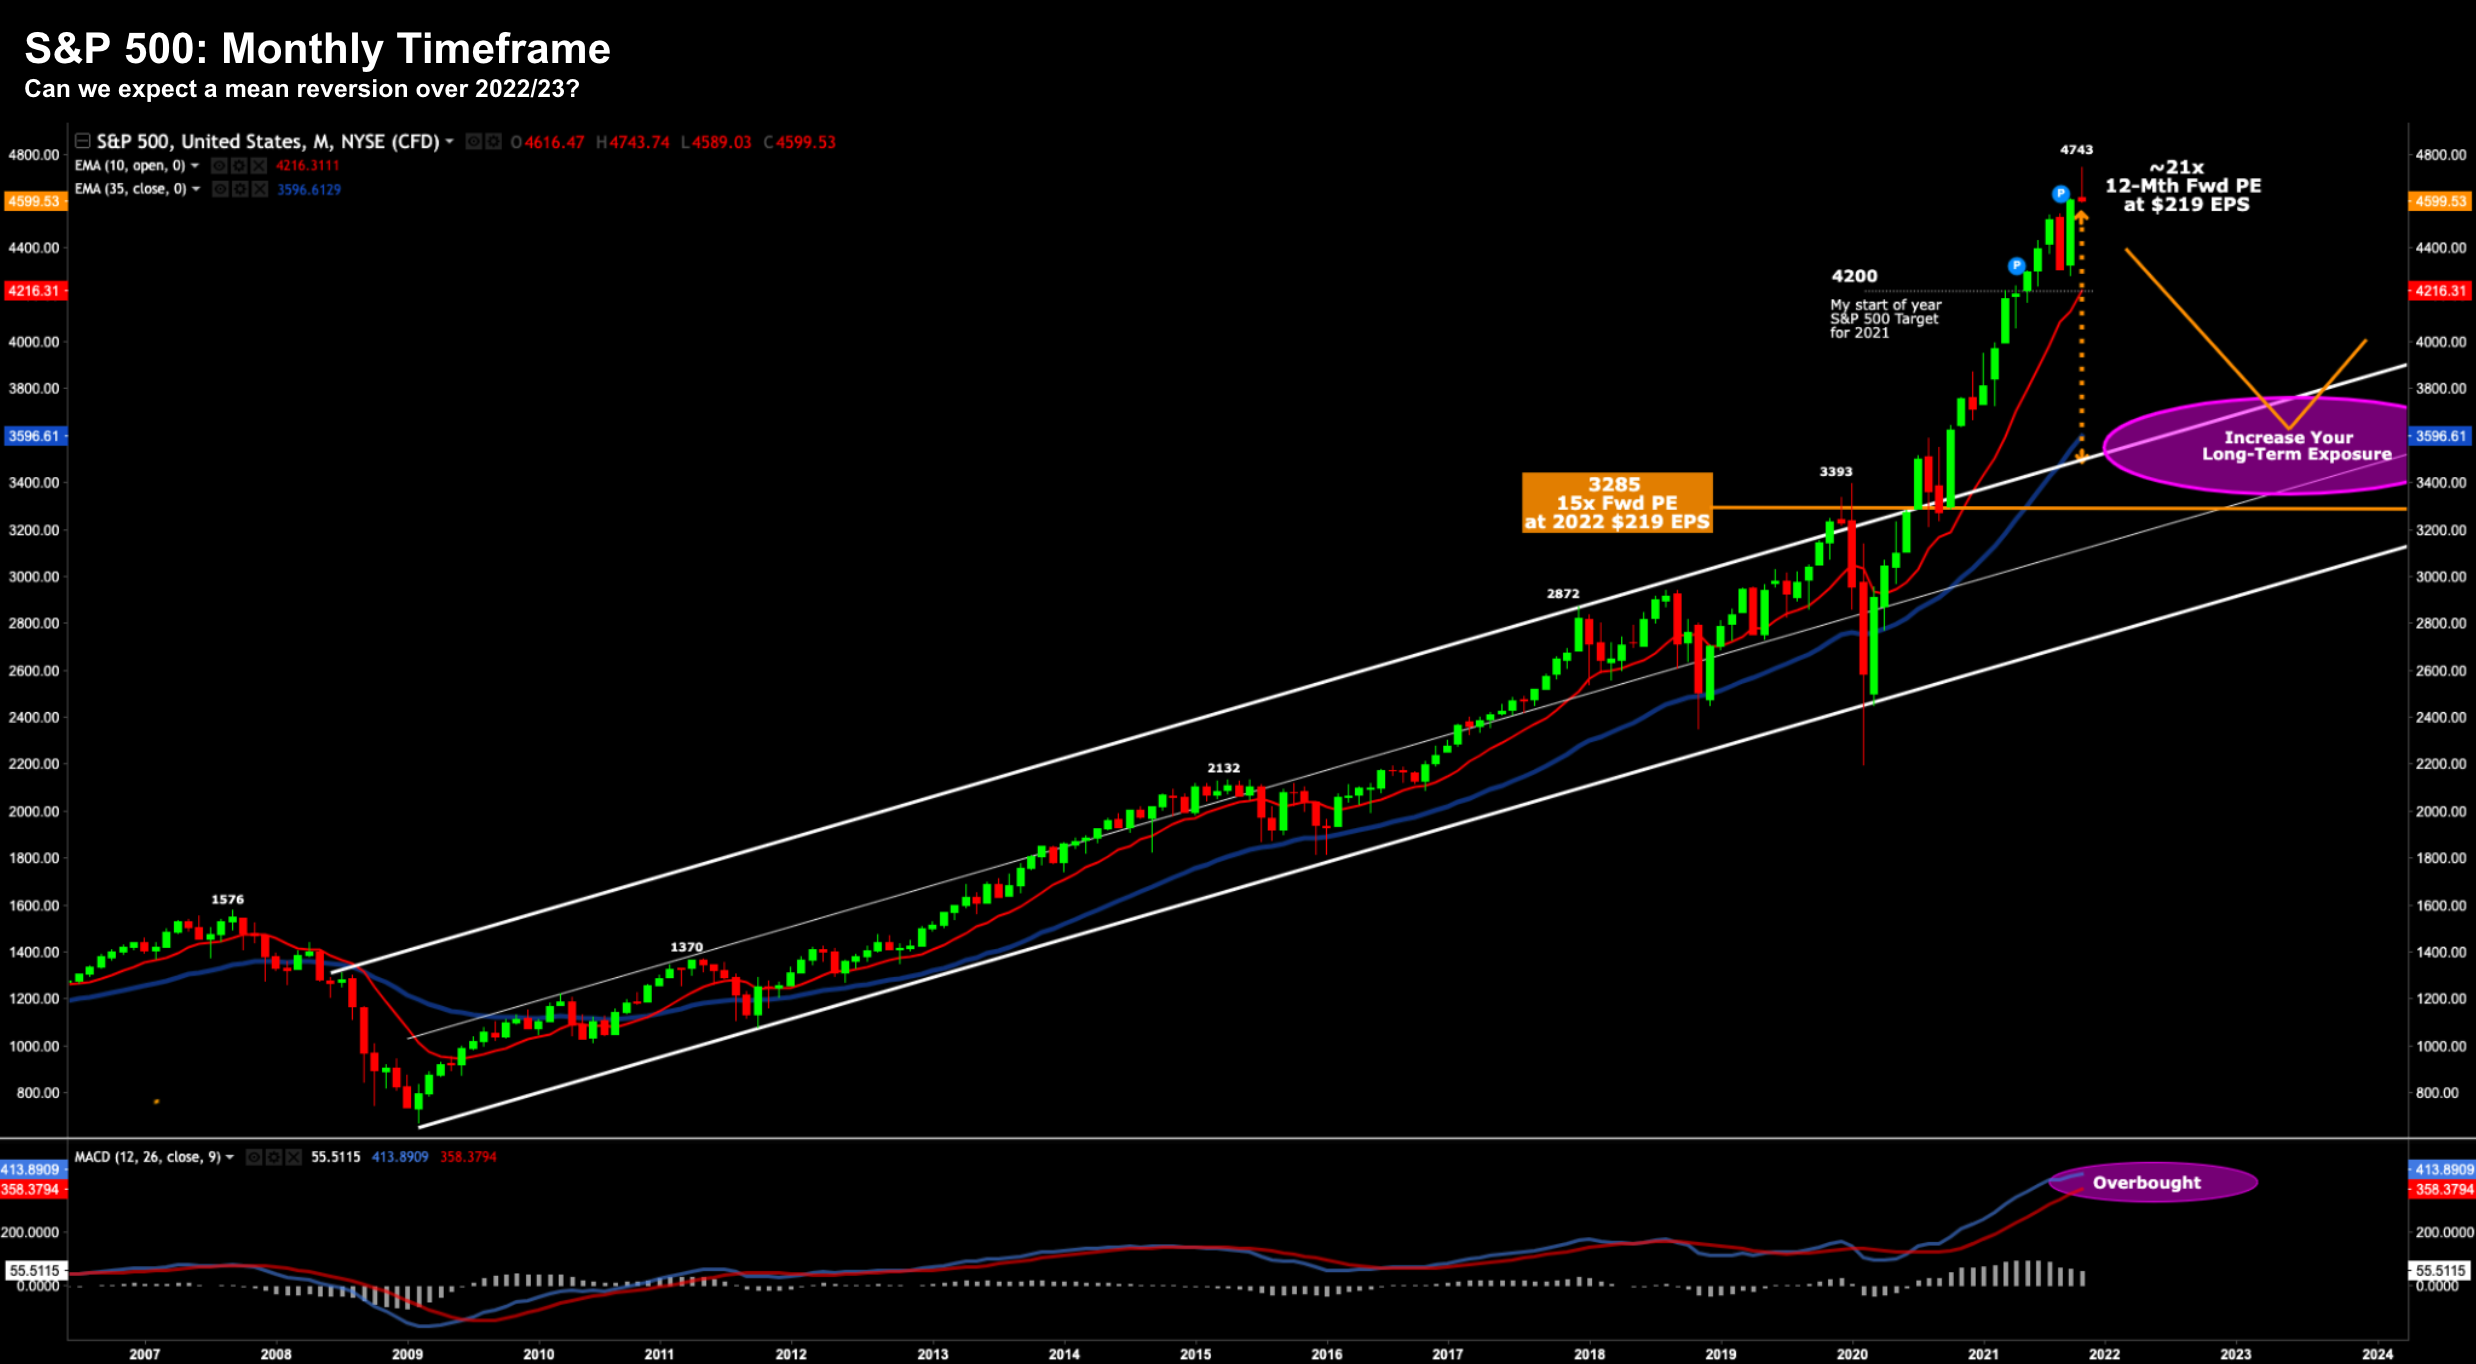
November 26 2021
As it happens, things have "traded per the script" (and my decision to reduce my exposure paid dividends)
Zooming in using the weekly chart – I"ve flagged the two zones which look compelling:
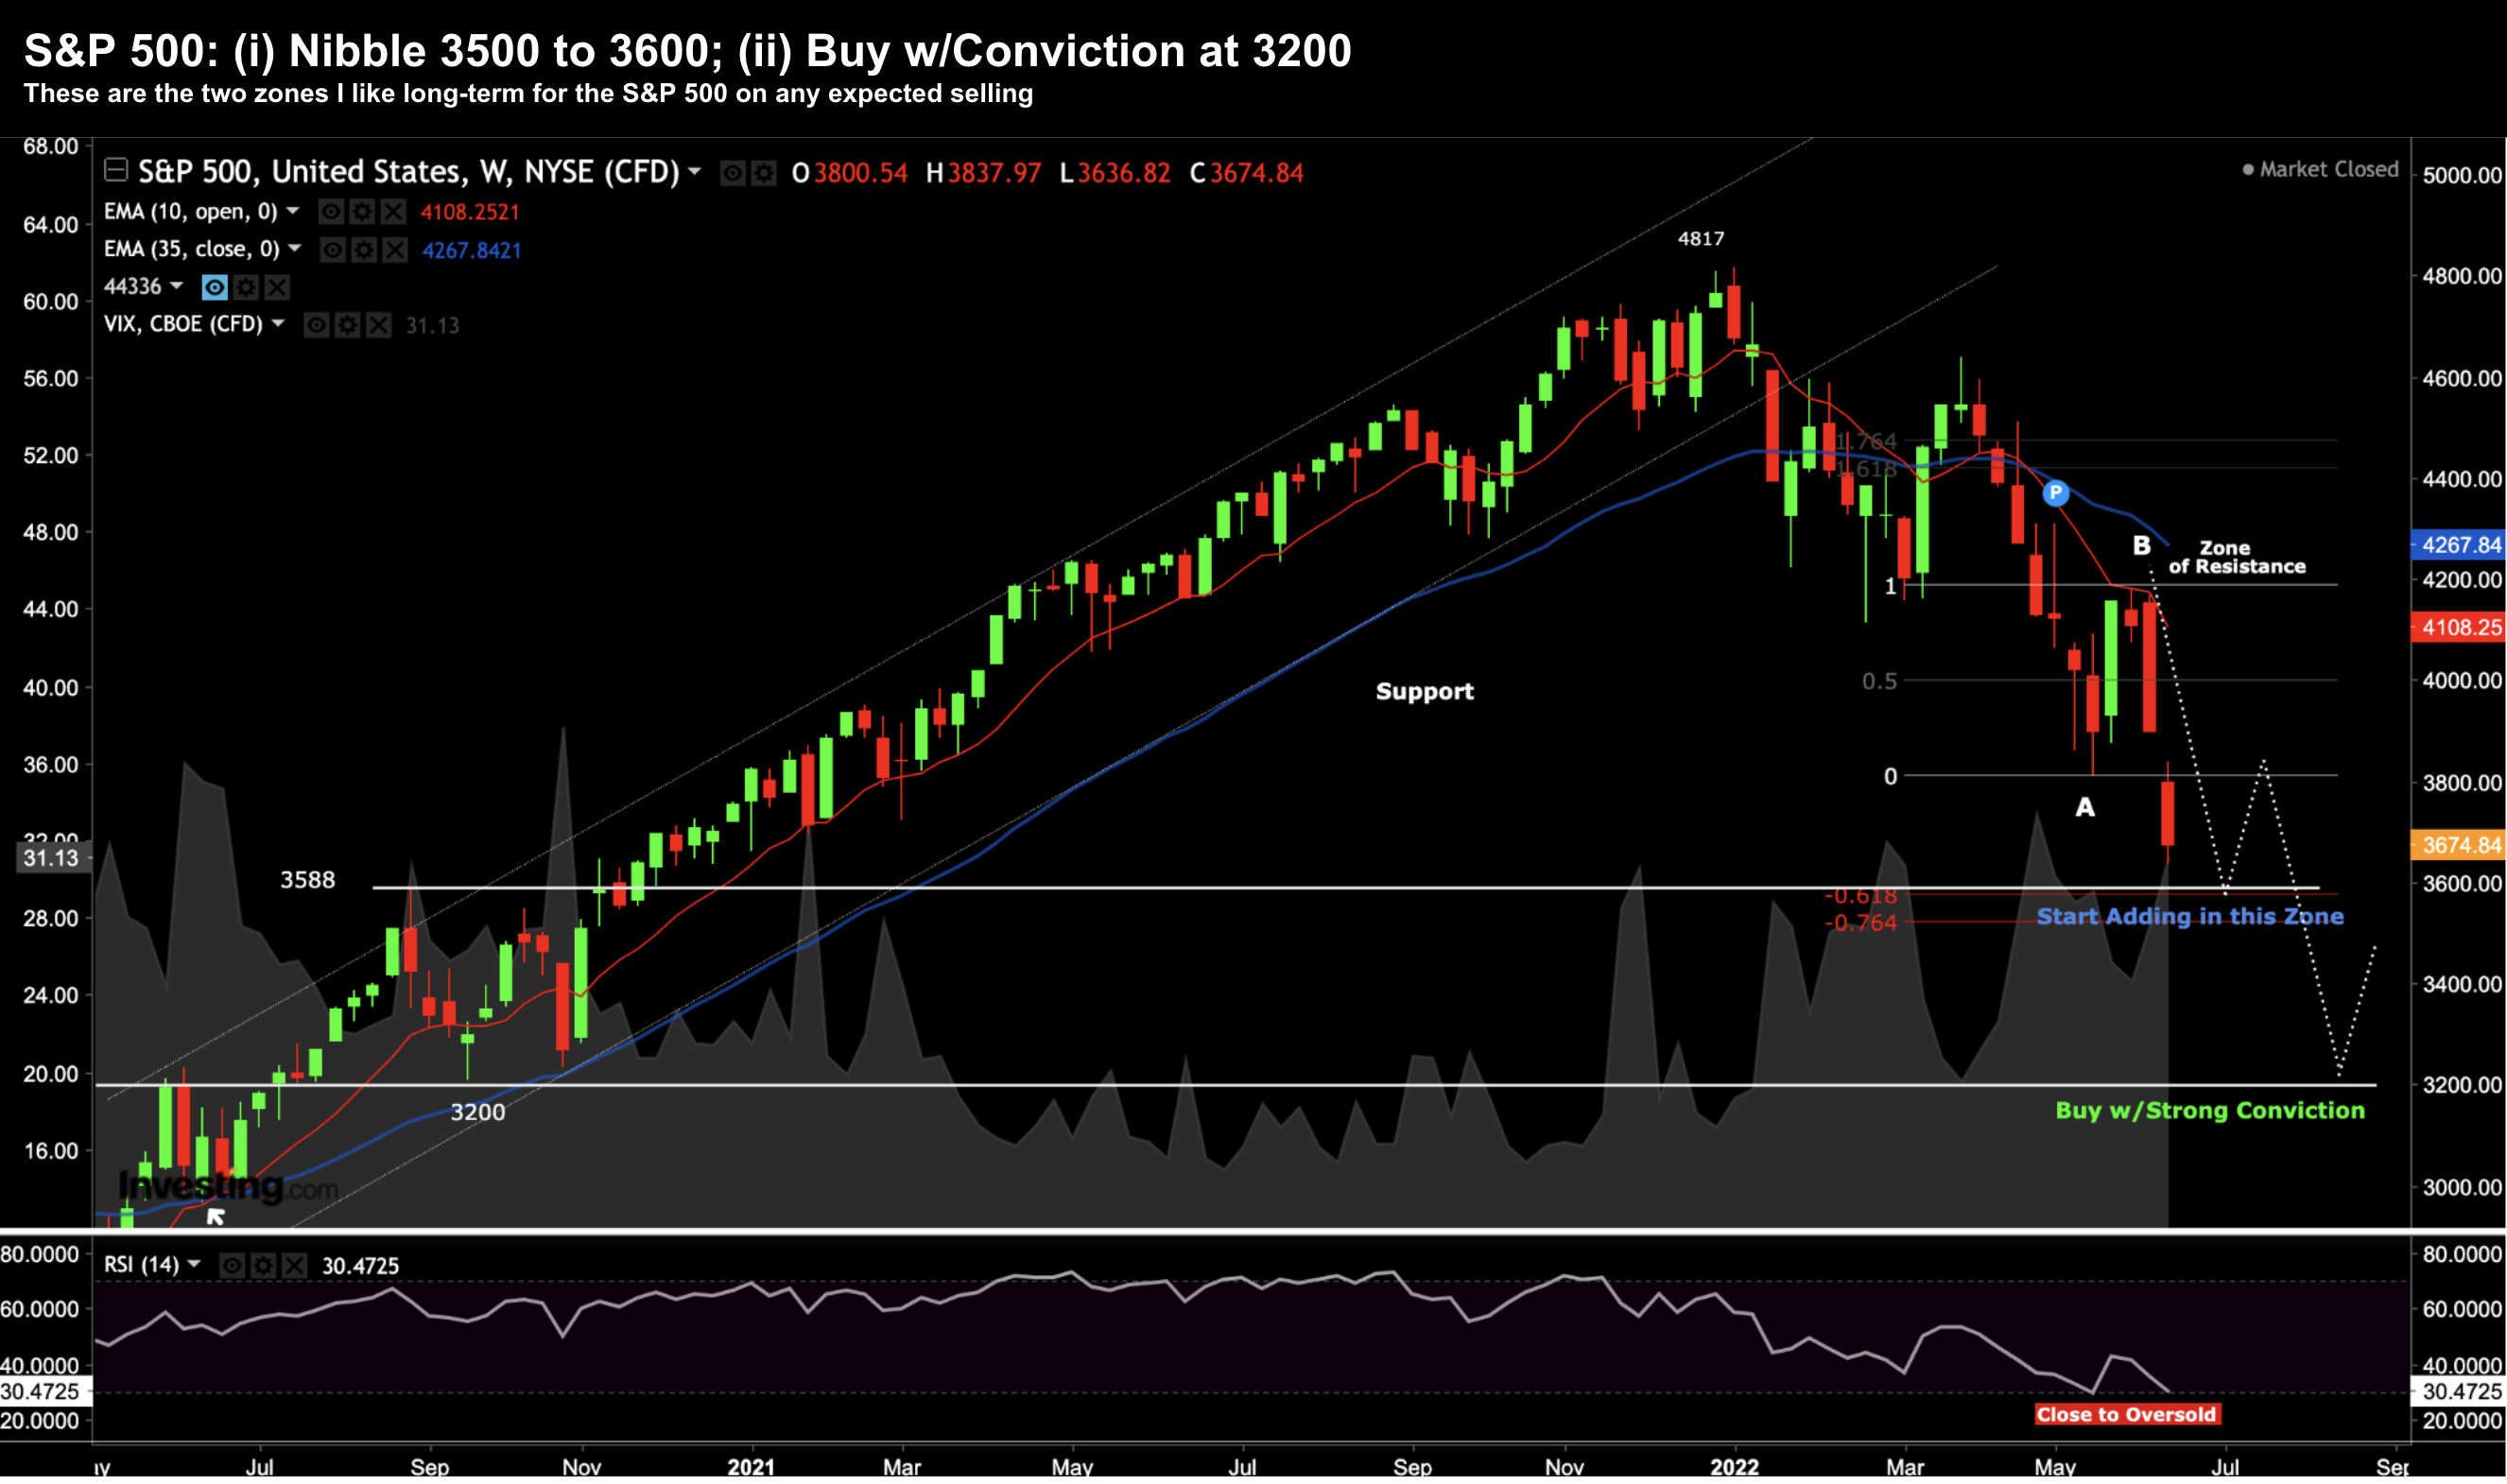
The first is a zone around 3600 (very close to where we at the time of writing)
Throughout late 2020, this zone was an area of resistance before it broke higher late 2020.
As market technicians will tell you – areas of previous resistance are often new areas of support.
In addition, the area of 3600 is also 61.8% to 76.4% outside the most recent 10% retracement labeled A-B. In my experience, a price will often find near-term support in this zone.
I think it"s okay for investors to start "nibbling" here (which I have done).
The second zone I"m targeting overlaps with the fundamental picture; i.e. around 3200
3200 has acted as both resistance and support in 2020.
To that end, if we find 3600 breaks (and there"s a strong probability it will) – I think it will be a quick trip down to 3200.
And if we are lucky enough to realize anything in the realm of 3200 – I will be buying the Index with strong conviction with a minimum 3-year lens.
To be crystal clear – I have every expectation that the market could trade lower than 3200. Technically we remain in a strong bearish trend (i.e. expect lower prices).
However, I also don"t pretend to know where the bottom will be.
As such, I believe the potential upside reward here meaningfully outweighs the downside risks if taking a 3-year view.
Putting it All Together
Stock market crashes in excess of 20% are not uncommon.
This will be the 11th such "crash" over the past 72 years.
It"s also the 37th time where markets have corrected at least 10% (i.e., 51% of the time)
What we are working through now is multiple contraction – where asset prices are adjusted to reflect a significantly higher cost of capital.
Put another way, future cash flows are being discounted opposite higher rates.
The difference this time is the Fed must let this go and cannot interview in the near-term with lower rates or additional liquidity.
Sharply higher inflation has them boxed into a corner.
Unfortunately distorting the price of debt for far too long has seen various businesses (and assets) attract speculative capital they otherwise would not (e.g. "Cathie Wood" stocks come to mind).
The more unfortunate consequence is on "Main Street".
For example, artificially lower rates meant coaxing unsuspecting home buyers taking on excessive levels of mortgage debt (and perhaps other credit) they otherwise could not afford.
What"s more, they paid distorted prices.
Asset prices will now correct (as we have already seen with stocks) – however the borrower is still faced with the onerous debt obligation.
Sadly this script repeats time and time again.
Central banks will continue to exaggerate the boom and bust cycle via (excessive) interventionist policies for too long.
The warning signs were there to see… both fundamentally and technically.
For those who have the means – they will be afforded a rare long-term buying opportunity.
Be sure to take full advantage.
One final note (and a short-story):
Last week I sat down with my 19-year old niece explaining some of these principles. As context, she is going to University (studying business) whilst working part-time.
Over the past 4 years, she has saved $30,000 (impressive for a 19-year old!) She is interested in finance, money management and wants to know how to make her money work better for her.
To illustrate the power of compound interest over time – I put together a simple spreadsheet with 4 columns.
I demonstrated the returns over 30 years across: (i) inflation at 3% per annum; (ii) property at 7% per annum; (iii) S&P 500 averaging 10.5% returns; and (iv) returns of 12.5% if buying the Index at a discounted valuation.
She was shocked at the difference. Over 30 years, her $19,000 will be worth:
- $46,117 inflation adjusted at 3.0% per annum;
- $144,632 if invested in property at 7.0% per annum;
- $379,858 if invested in the S&P 500 at its average 10.5% pa; and
- $650,622 if investing in the S&P 500 at 12.5% pa
Needless to say she was excited to put her money to work.
Investors today – with the S&P 500 set to trade at levels below 3500 – will have chance to realize as much as 12.5% CAGR (compound annual growth rate) for years to come.
Feel free to share these "macro" market lessons with anyone you might think will benefit… especially if it"s a young person at the start of their financial journey.