And The New Year Begins… Slowly
Words: 1,296 Time: 7 Minutes
- Santa delivers a fat lump of coal
- S&P 500 has lost all momentum
- Are markets expecting further USD strength?
The trading year for 2025 is under way…
Markets have worked their way through the so-called Santa Clause Rally.
For those less familiar – this refers to a period of trading between the last five trading days of December and the first two trading days of January.
Here"s some useless trivia for your next dinner party….
- The Santa Claus rally was first defined in the 1972 Stock Trader"s Almanac by Yale Hirsch.
- Historically, the S&P 500, the Dow Jones Industrial Average (DJIA), and the Nasdaq Composite have risen about 80% of the time during the Santa Claus rally period.
- The average returns for the S&P 500, the Dow, and the Nasdaq Composite over the period have been 1.3%, 1.4%, and 1.8%, respectively over these 5 trading days.
- Some traders (not me) use this as an early indicator of what may happen in the new year. As one of Yale Hirsch"s famous lines states: "If Santa Claus should fail to call, bears may come to Broad and Wall."
So what happened this year… "the bears came to Broad and Wall"
Santa delivered a fat lump of coal.
Boooo! And I thought we were on his "nice" list?
Obviously not.
As I say, I pay zero attention to things like "Santa rallies" or "Sell in May and Go Away"… and any number other (random) Wall Street sayings.
However, what I do pay attention to are valuations (first and foremost) and from there – what momentum tells us (i.e., the emotions of traders).
Let"s start the year with a look at the weekly chart….
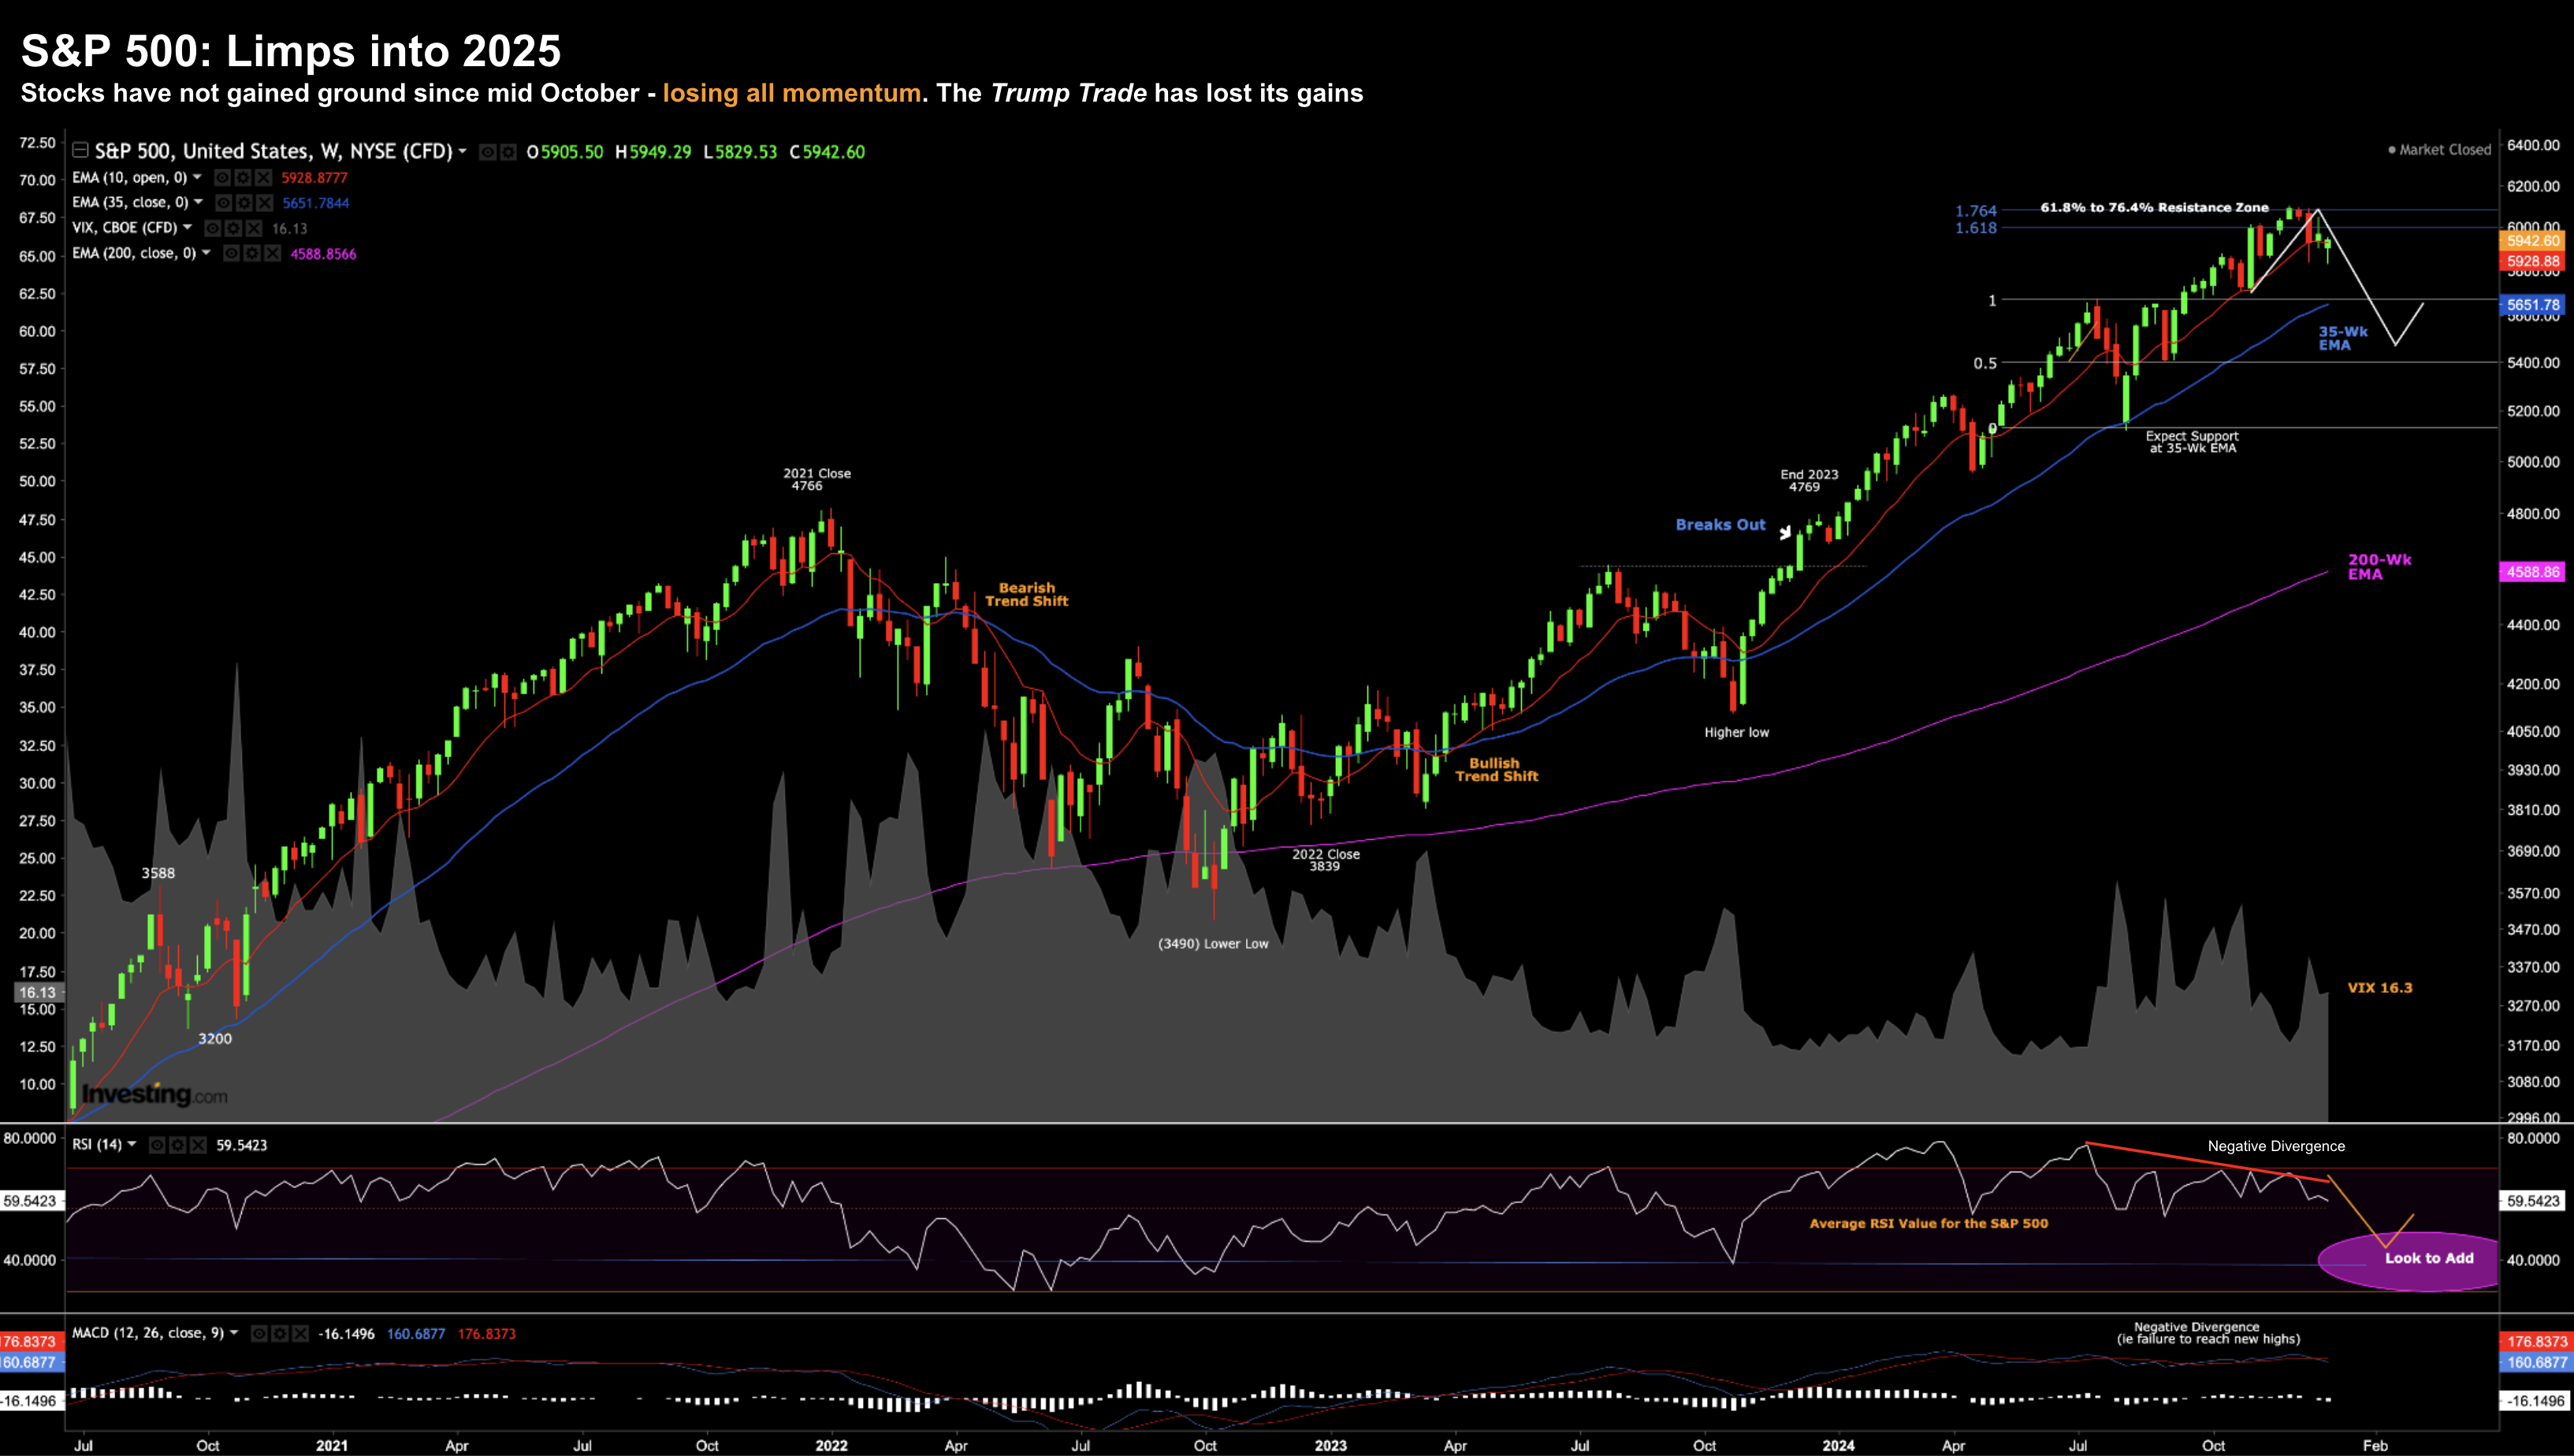
S&P 500 Limps into 2025
Perhaps two things stand out to me as he start the new year:
- The S&P 500 has not added to its gains since mid-October; and
- It"s also erased almost all of the Trump Trade from early November
But this should come as no surprise to regular readers.
For example, after we completed the retracement from July (where the S&P 500 traded 5119) – I offered a Fibonacci target of around 6,000 to 6,100
This is 61.8% to 76.4% outside the July pullback (labelled as a "resistance zone").
January 4 2025
I didn"t know stocks would reverse in this zone (I don"t claim to be Nostradamas) – however it"s often a zone of overhead resistance.
In this case, things traded per the script.
The high point was 6099 (second week of December) — but since then it"s been down.
From a technical lens only – I penciled in a move down towards the 35-week EMA zone (blue line). At the time of writing, that zone is around 5600 or about 6% lower than today.
Again, this is a zone.
For example, it might end up being "5% lower to 10% lower".
Makes no difference… it"s arbitrary.
The idea is not to be too cute. The more important point is that there"s risk to the downside.
Again, we spend our time looking down (not up).
However, the time to "look up" is when the market has shed "20% to 30%"… that"s when we get really excited.
That"s when quality goes on sale.
Repeating one of favorite investing (and life) philosophies: "we"re better to be approximately right than precisely wrong"
Adding meaningful exposure ~6,000 runs the risk of being precisely wrong. And so far (since October) – reducing your risk has been approximately right.
But we will see if that continues.
One last technical observation:
The strong divergence with the Relative Strength Index (middle window) is cause for concern. I"ve been calling this from late August when it made a lower high.
This divergence tells me the market has lost momentum (where the new highs are not to be trusted)
My best guess is the weekly RSI works its way down to the 40-45 zone (which would coincide with a move to the 35-week EMA zone) – and assuming valuations are reasonable – I would start adding to high quality stocks (see this post as to what metrics you should target (or what to avoid!)).
Speaking of quality – earnings are around the corner.
This will give us a glimpse as to who is delivering strong cash flow and return on capital (and who isn"t)
It"s (Almost) Earnings Season
Over the next four weeks – we will start to hear from corporate America.
Expectations for very strong earnings growth are high for 2025 – with some expecting average growth of 15%.
If that eventuated – it would be well above average.
According to Factset (Jan 3rd):
- 106 S&P 500 (21%) companies have issued quarterly EPS guidance for Q4.
- 71 have issued negative EPS guidance; and 35 have issued positive EPS guidance.
- The number of companies issuing negative EPS guidance is above the 5-year average of 56 and above the 10-year average of 62.
- This quarter also marks the fifth time in the past eight quarters that more than 70 S&P 500 companies have issued negative EPS guidance.
This is something to be mindful of when the market is expecting double digit earnings growth this year.
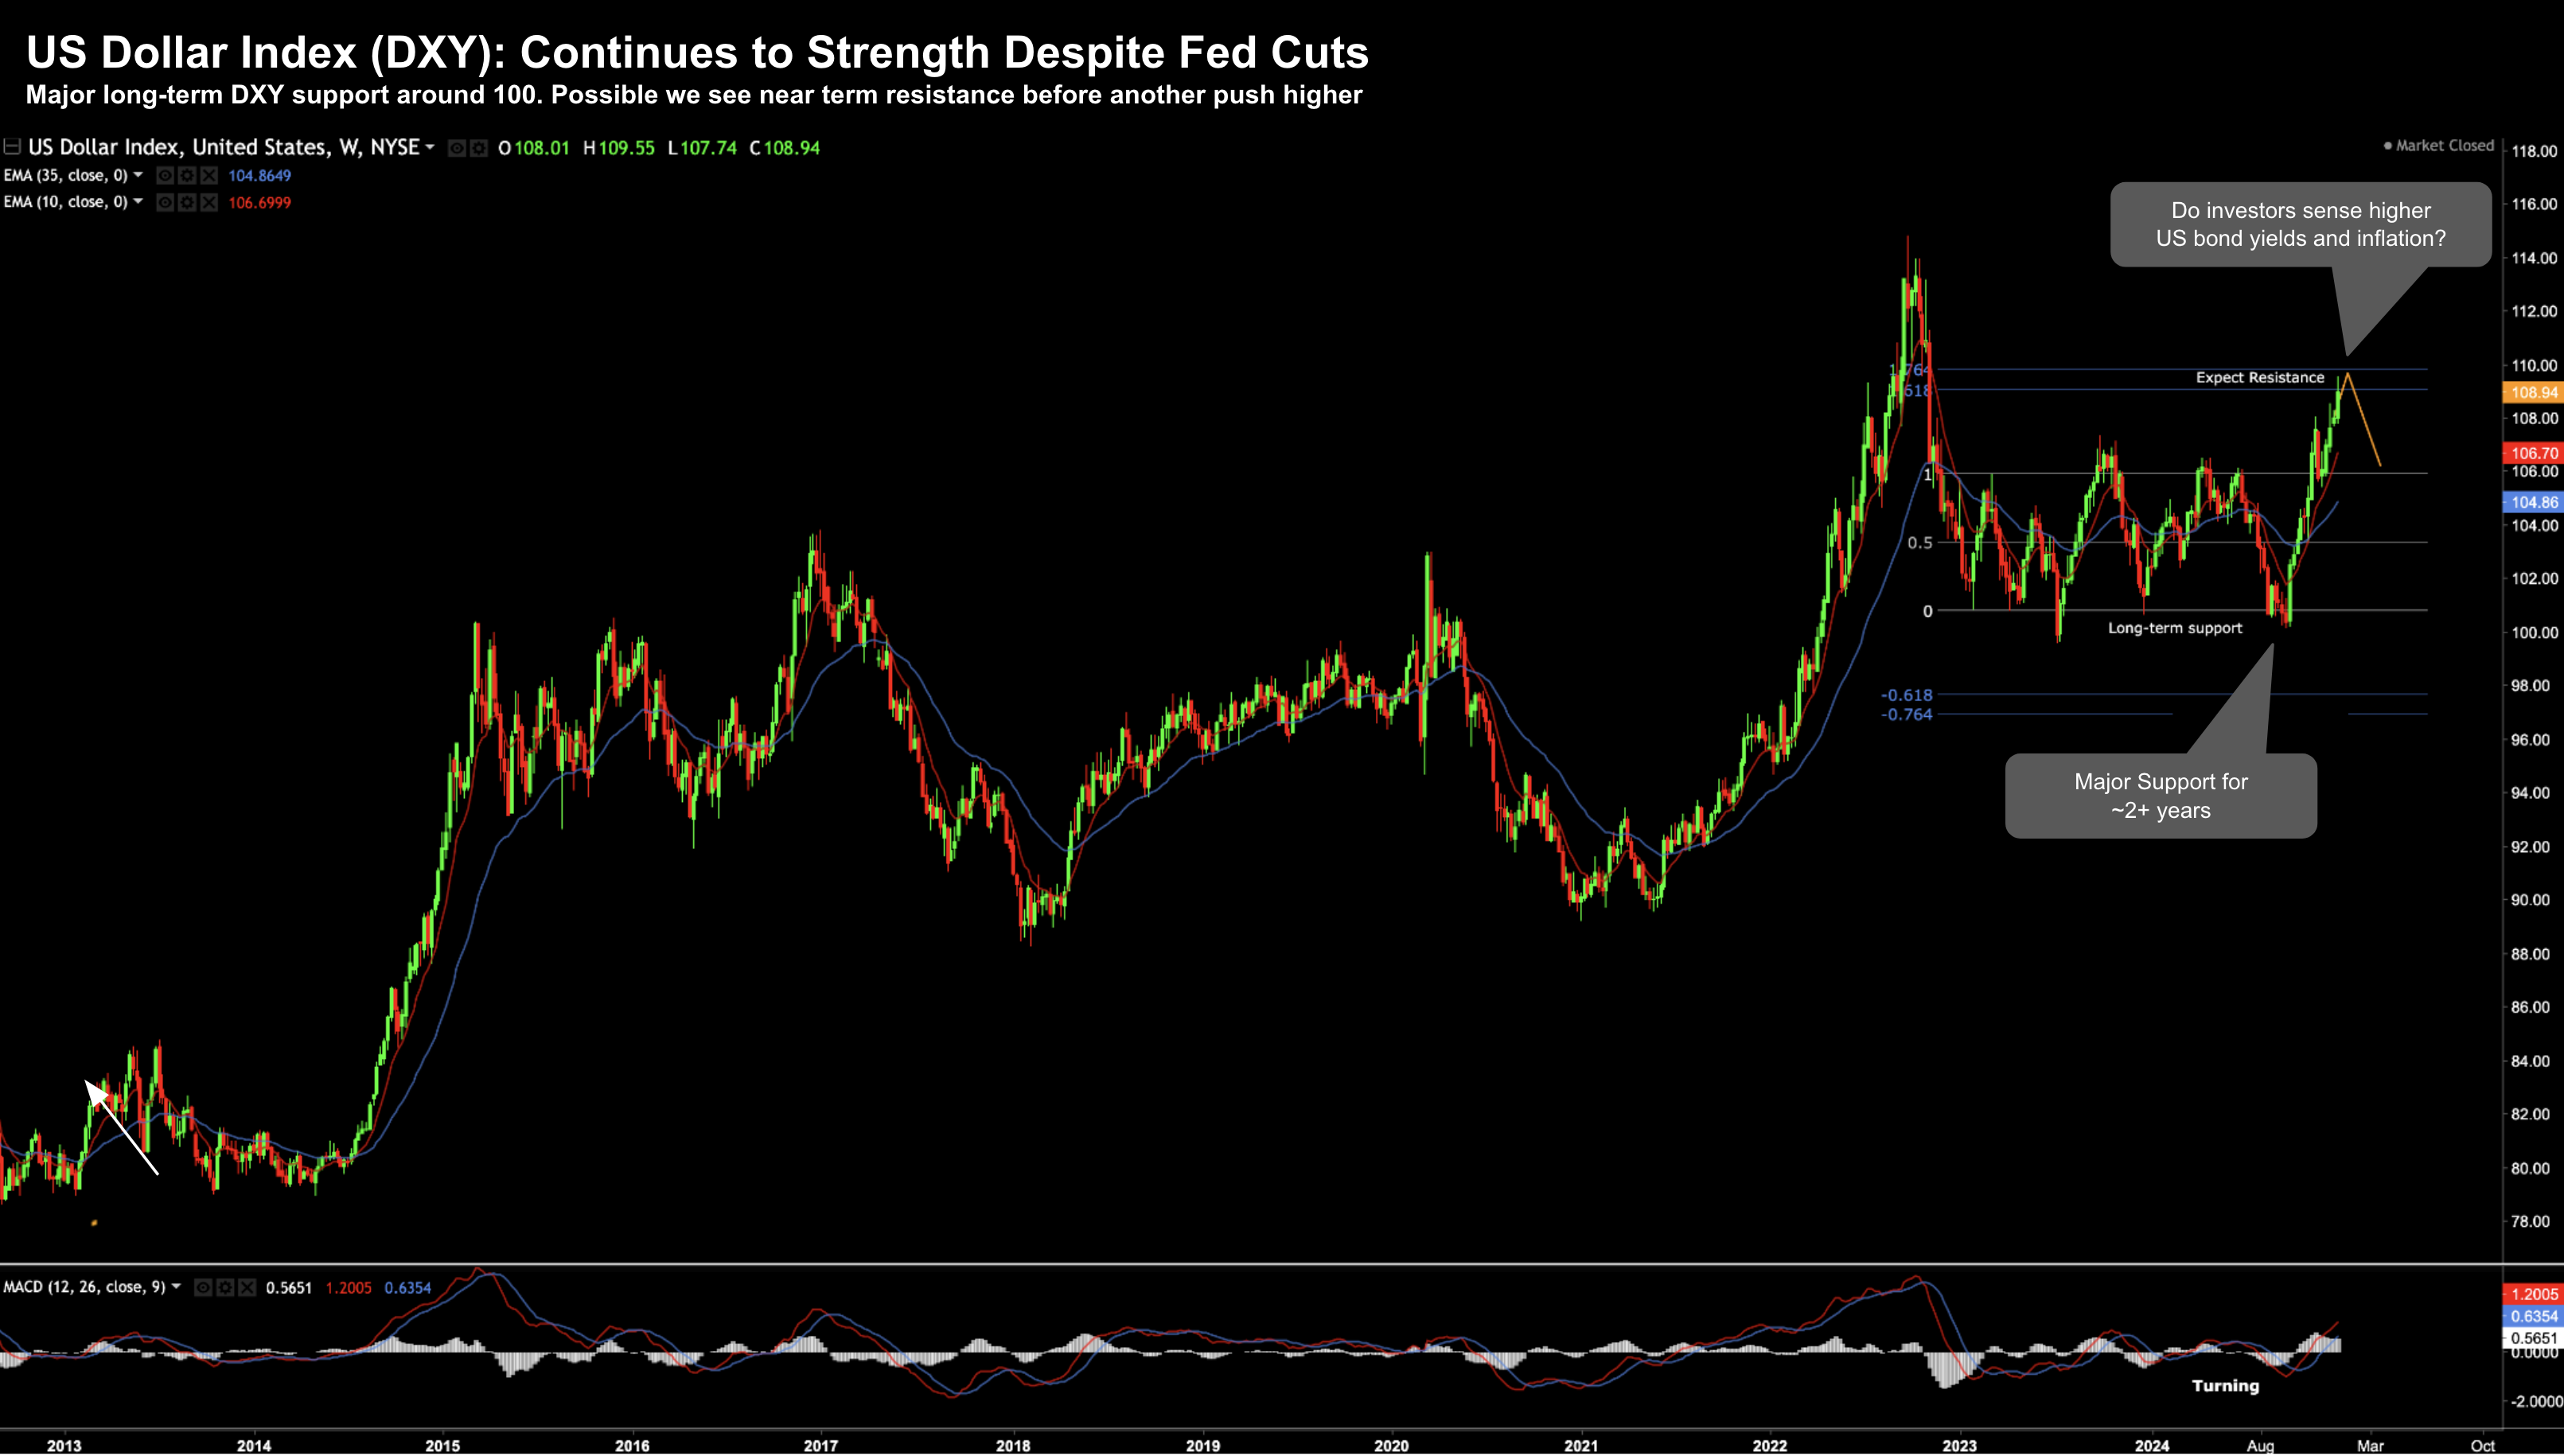
But what I think is one of the key (fundamental) risks to earnings growth will be sustained strength in the US dollar.
Here is the weekly chart:
January 4 2025
The move higher in the USD the past few weeks has been furious.
Its near vertical ascent is not unlike we saw during 2022…. and we know what happened to stocks that year.
Here"s why I think this matters:
- ~45% of the S&P 500 revenue is "non-US"; and
- ~55% of the S&P 500"s technology sector revenue is also non-US
With respect to the much-loved Mag 7 stocks (which are ~35% of the S&P 500 weight) – they comprised almost all of the S&P 500 earnings growth last quarter (with the other 493 stocks providing just 0.1%)
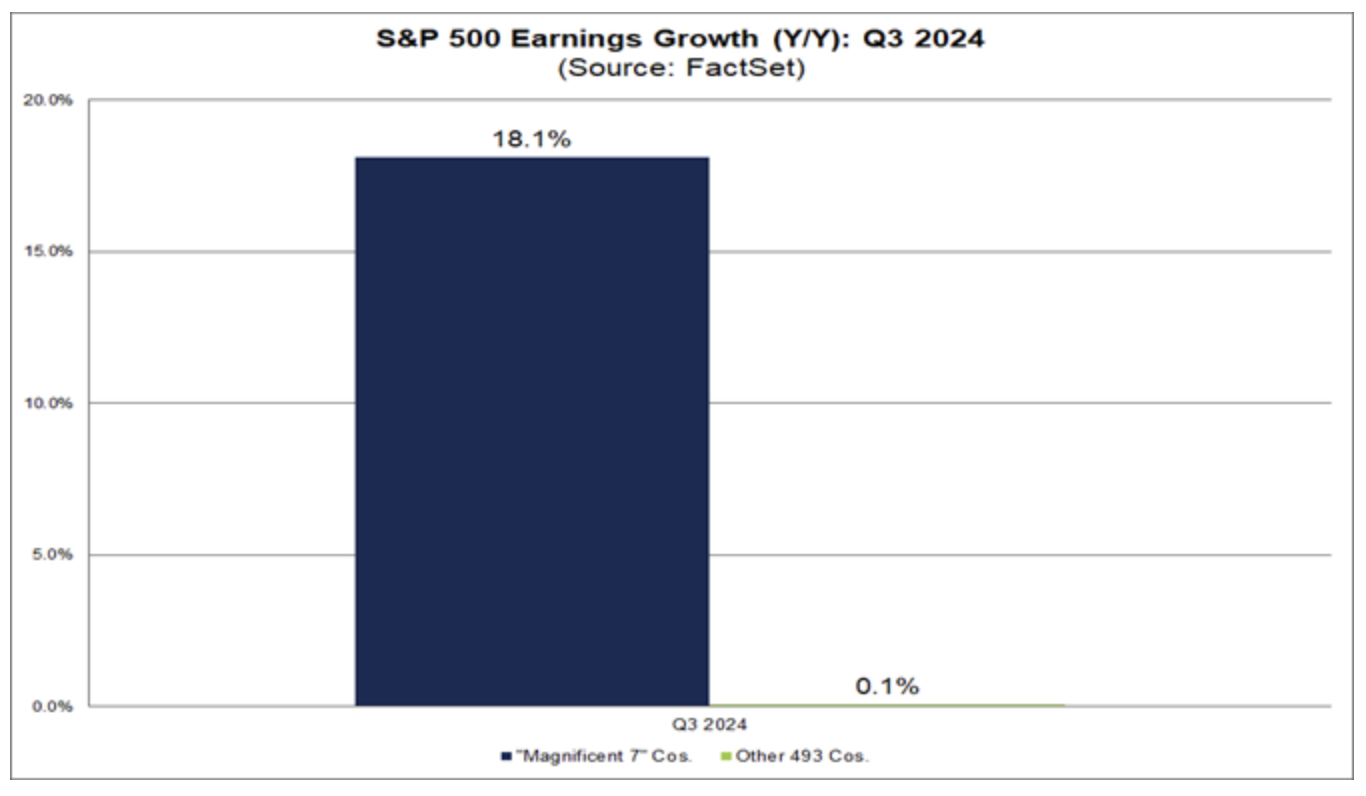
That"s frightening as its a lot of concentrated risk (not that the market cares).
Here"s three reasons why strength in the USD could continue to put pressure on earnings:
- Economic growth differentials: The U.S. economy is projected to grow by 2.7% in 2024 – well ahead of most other economies. This is driven by superior productivity growth and higher business investment. And with inflation likely to remain between 2% and 3% – this will cause the Fed to slow any rate cuts
- Bond yield differentials: The increasing divergence in global growth has led to a greater disparity in central bank policies worldwide (I talked more about this here). As a result, the gap between (rising) U.S. 10-year bond yields and those of its key trading partners has widened to its highest level since 1994. The wider these differentials – the more this will drive up the USD.
- Policy changes: Trump is inwardly focused which will boost domestic manufacturing in the short-term (but a negative longer-term). He is also likely to increase tariffs (another negative – see this post "A Zero Sum Game" whilst deregulating certain industries. This could spur business growth in the short-term and sustain higher interest rates, supporting the US dollar.
And whilst technically we"re likely to see the US ease a little over the next few months (nothing rises or falls in a straight line – in this case its overbought) – I expect sustained pressure for the reasons above.
If my theory is correct (and it may not be) – a stronger dollar will only hamper (lofty) earnings growth expectations for 2025.
Putting it All Together…
Technically it appears the S&P 500 could lose some ground in the first quarter.
However, timing is always very difficult to predict and 3-months is a very short window. It might be 6+ months – I don"t know.
It doesn"t matter as we are not traders.
That said, a pullback of 10% to 15% would be a healthy development.
In terms of valuations – markets are fully extended.
For example, should we see the US 10-year yield rise thoughout 2025 (which I expect); and the US dollar see sustained strength – we should be mindful of how this impact both valuations and earnings growth.
Today the bulls don"t see either as a large risk; i.e., happy to value the market at 22x forward earnings (where the VIX remains low).
So let"s see how these (bullish) 2025 targets turn out…
Most folks still lean to one side of the boat.