Buckle Up Buttercup…
Words: 1,705 Time: 8 Minutes
- VIX touches 29 – but no signs of panic yet
- Trump says there will be some "disruption"
- QQQ – areas which look attractive
Fasten your seatbelts – things could get bumpy.
I will share charts for both the S&P 500 and popular tech ETF QQQ shortly.
TLDR – I see more downside to come.
So why the sudden drop?
Look no further than what we heard from the Commander-in-Chief.
Trump amplified the seeds of worry over the weekend with this interview with "Sunday Morning Futures" (Fox News)
In short, he said he was willing to work through a bit of disruption – as it will lead to longer-term gains. I quote:
"There is a period of transition, because what we"re doing is very big. We"re bringing wealth back to America. That"s a big thing… it takes a little time, but I think it should be great for us."
Asked whether he thinks a recession is imminent, Trump said, "I hate to predict things like that. Look, we"re going to have disruption, but we"re OK with that."
So how does one interpret "disruption"?
Is it a small 3-6 month bump in the road? Or the possibility of more than two quarters of economic contraction?
The way markets behaved today – it"s more of the latter.
And whilst a recession was not on anyone"s bingo card last month — those probabilities are increasing.
Three reasons I think growth will slow:
- Curtailing of fiscal spend (not a bad thing if it"s wasteful) – which will weigh on GDP;
- Slowing of consumer spending (Commerce Department released data showing consumers in January slashed their spending by 0.2 percent from December, the most since February 2021); and
- Business pausing private investment as they find it difficult to commit to long-term plans given the unknowns around tariffs and regulation.
These are all headwinds to the Trump growth agenda.
I walked through these here – in a post titled "Ready for a Growth Scare"
To that end, I think it"s negative sentiment that poses a greater risk to the economy vs prices rising as a result of tariffs.
For example, this week we get two data points:
- Consumer Price Inflation; and
- University of Michigan Sentiment Survey
I think the latter is more important…. but that"s not what most people are talking about.
But what if we get a really hot inflation print?
Well that just makes it tougher for the Fed should there be heightened growth risks.
For now, the market is treating Trump"s language as a case of shoot first and ask questions later.
S&P 500 Edges Lower
Our "fear index" (the VIX) nudged up as high as 29 today.
Over the weekend – I explained why readers should keep their eyes peeled for a move to ~35.
That generally means you are closer to panic selling… a washout.
But we"re not quite there yet.
Let me offer some perspective…
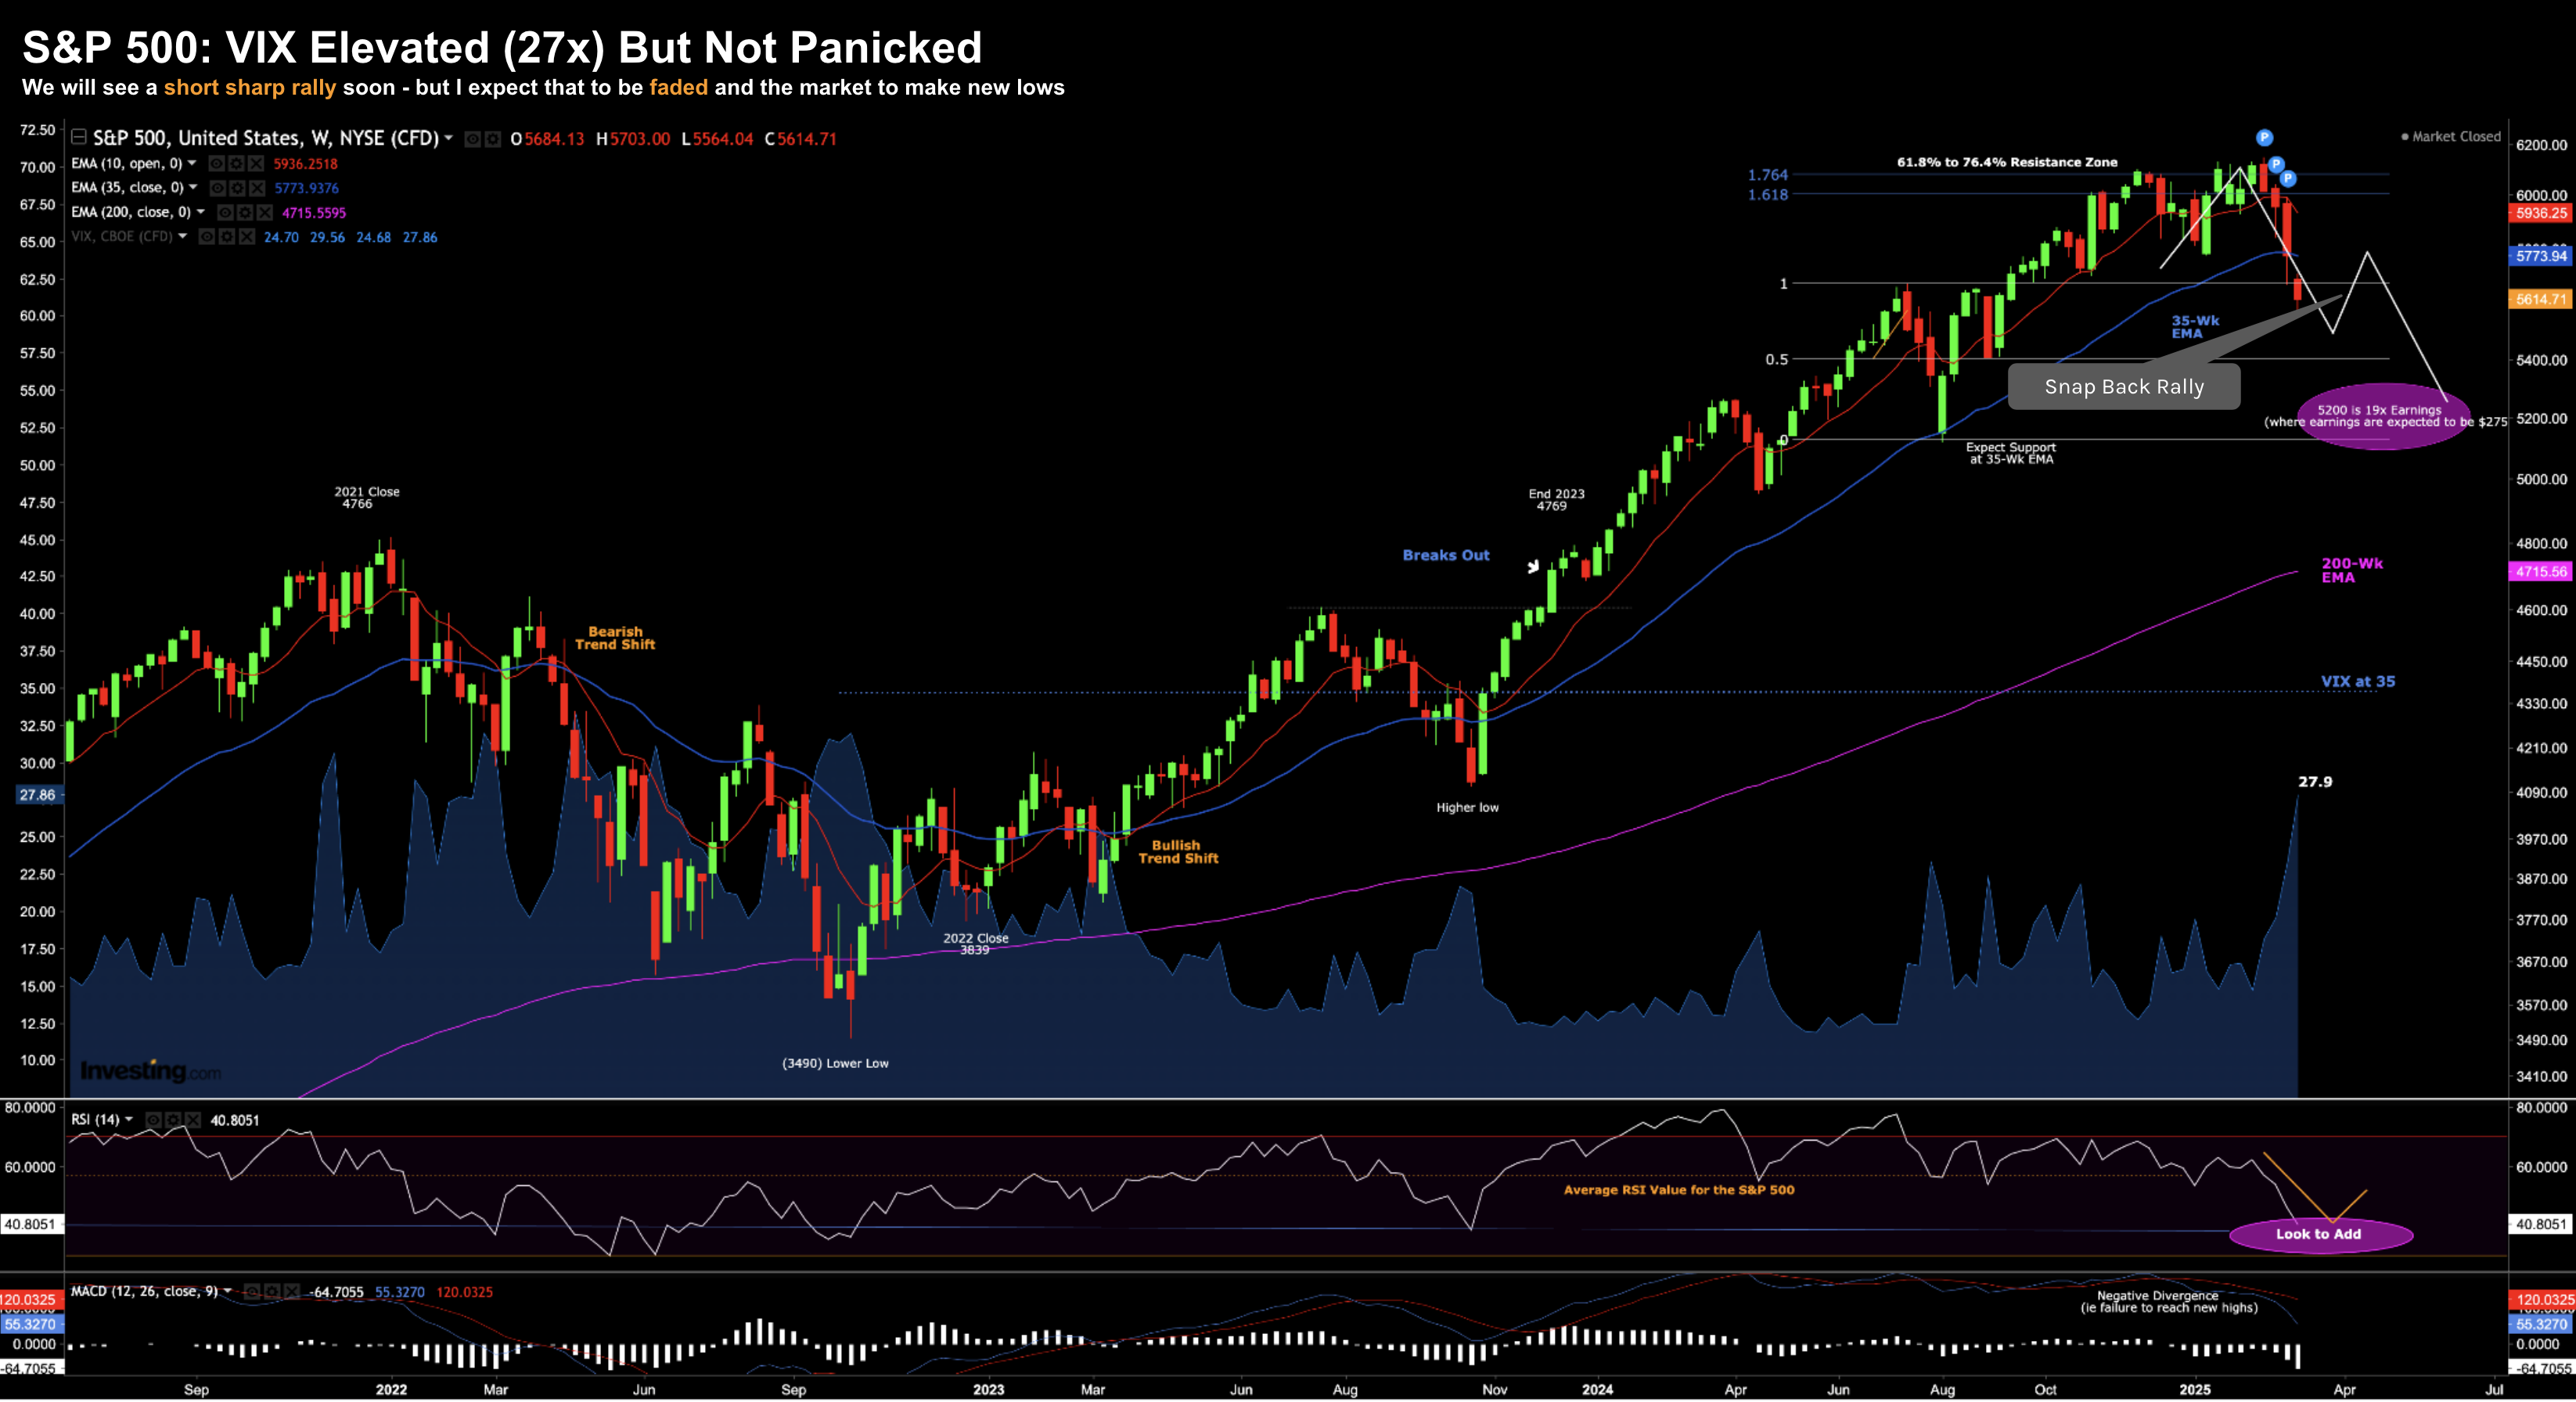
At the close of trade today – the S&P 500 finished 5614.
Early February the Index traded as high as 6147; i.e. around ~8% off its all-time high.
Given how far we have come in such a very short space of time – this isn"t a big deal (more on this in my conclusion).
Consider the following:
- Start of 2024 – S&P 500 was 4754 – 18% higher over 15 months
- Start of 2023 – S&P 500 was 3853 – 47% higher over 27 months
And those gains are post the selling of the past few days.
The weekly chart below just shows how little we"ve corrected given the gains of the past two years:

March 10 2025
Coming into 2025 I felt that markets were "priced for perfection" – with a forward PE of ~22x (where earnings are assumed to be around $275 per share)
Here"s the problem with that:
This leaves very little room for things to go wrong.
And when we get an intended "disruption" from the President — perfection is gone.
But in any case – with long-term yields offering around 4.50% at the time – investors were receiving zero risk premium for betting on stocks.
History has shown time and time again that"s generally a poor bet.
It told me the risks were to the downside – especially in overpriced tech names.
For example, why would anyone pay 35x for Apple or Microsoft?
When I sold all my Apple shares at $254 – it was a tough decision. It"s a very high quality stock.
However, I knew I was receiving more than generous prices for my exit in tech – as I could not justify the multiples being asked.
And now I"m starting to sharpen my pencil…
Was Today a Washout?
I received a host of texts and emails from friends asking if I"m buying.
The answer was no – not yet.
With respect to a "washout" – some of the cues I need to see are there – but not all.
For example, one cue is what we see with over-hyped momentum names – they are getting crushed.
Names which include (certainly not limited to) Crowdstrike, Coinbase, Applovin, Reddit, Palantir are going straight down.
I have very little interest in these names…
Speculative names priced mostly on revenue growth (and very little else) generally fall just as fast as they rise.
That"s proven to be the case.
Palantir for example was trading 100x its sales revenue when it was $100 per share.
Who would pay that?
But in terms of a flush – what I would like to see is treasuries yields plunge; i.e., money rushing to safety.
They"re not reacting much – which tells me the market is not that panicked.
However, one of the more pleasing things to see is some of the "quality generals" have come off their highs.
Here I"m talking about the likes of Amazon, Apple, Google, Meta, Nvidia and Microsoft.
I"m deliberately excluding Tesla (for a number of quality reasons – beyond the scope of this post)
Let"s take a look at the popular ETF QQQ
QQQs – More Selling Ahead?
The most widely held stocks in the market are the Mag 7
Up until recently they were 33% of the S&P 500"s market capitalization (i.e., dangerously concentrated)
This is why I warned against simply "buying the Index" – it was essentially a bet on tech (or 7 stocks).
Naturally – when the "generals" start to fall 10%+ – it gets people"s attention (hence the volume of email I receive)
Let"s take a look using the weekly chart

March 10 2025
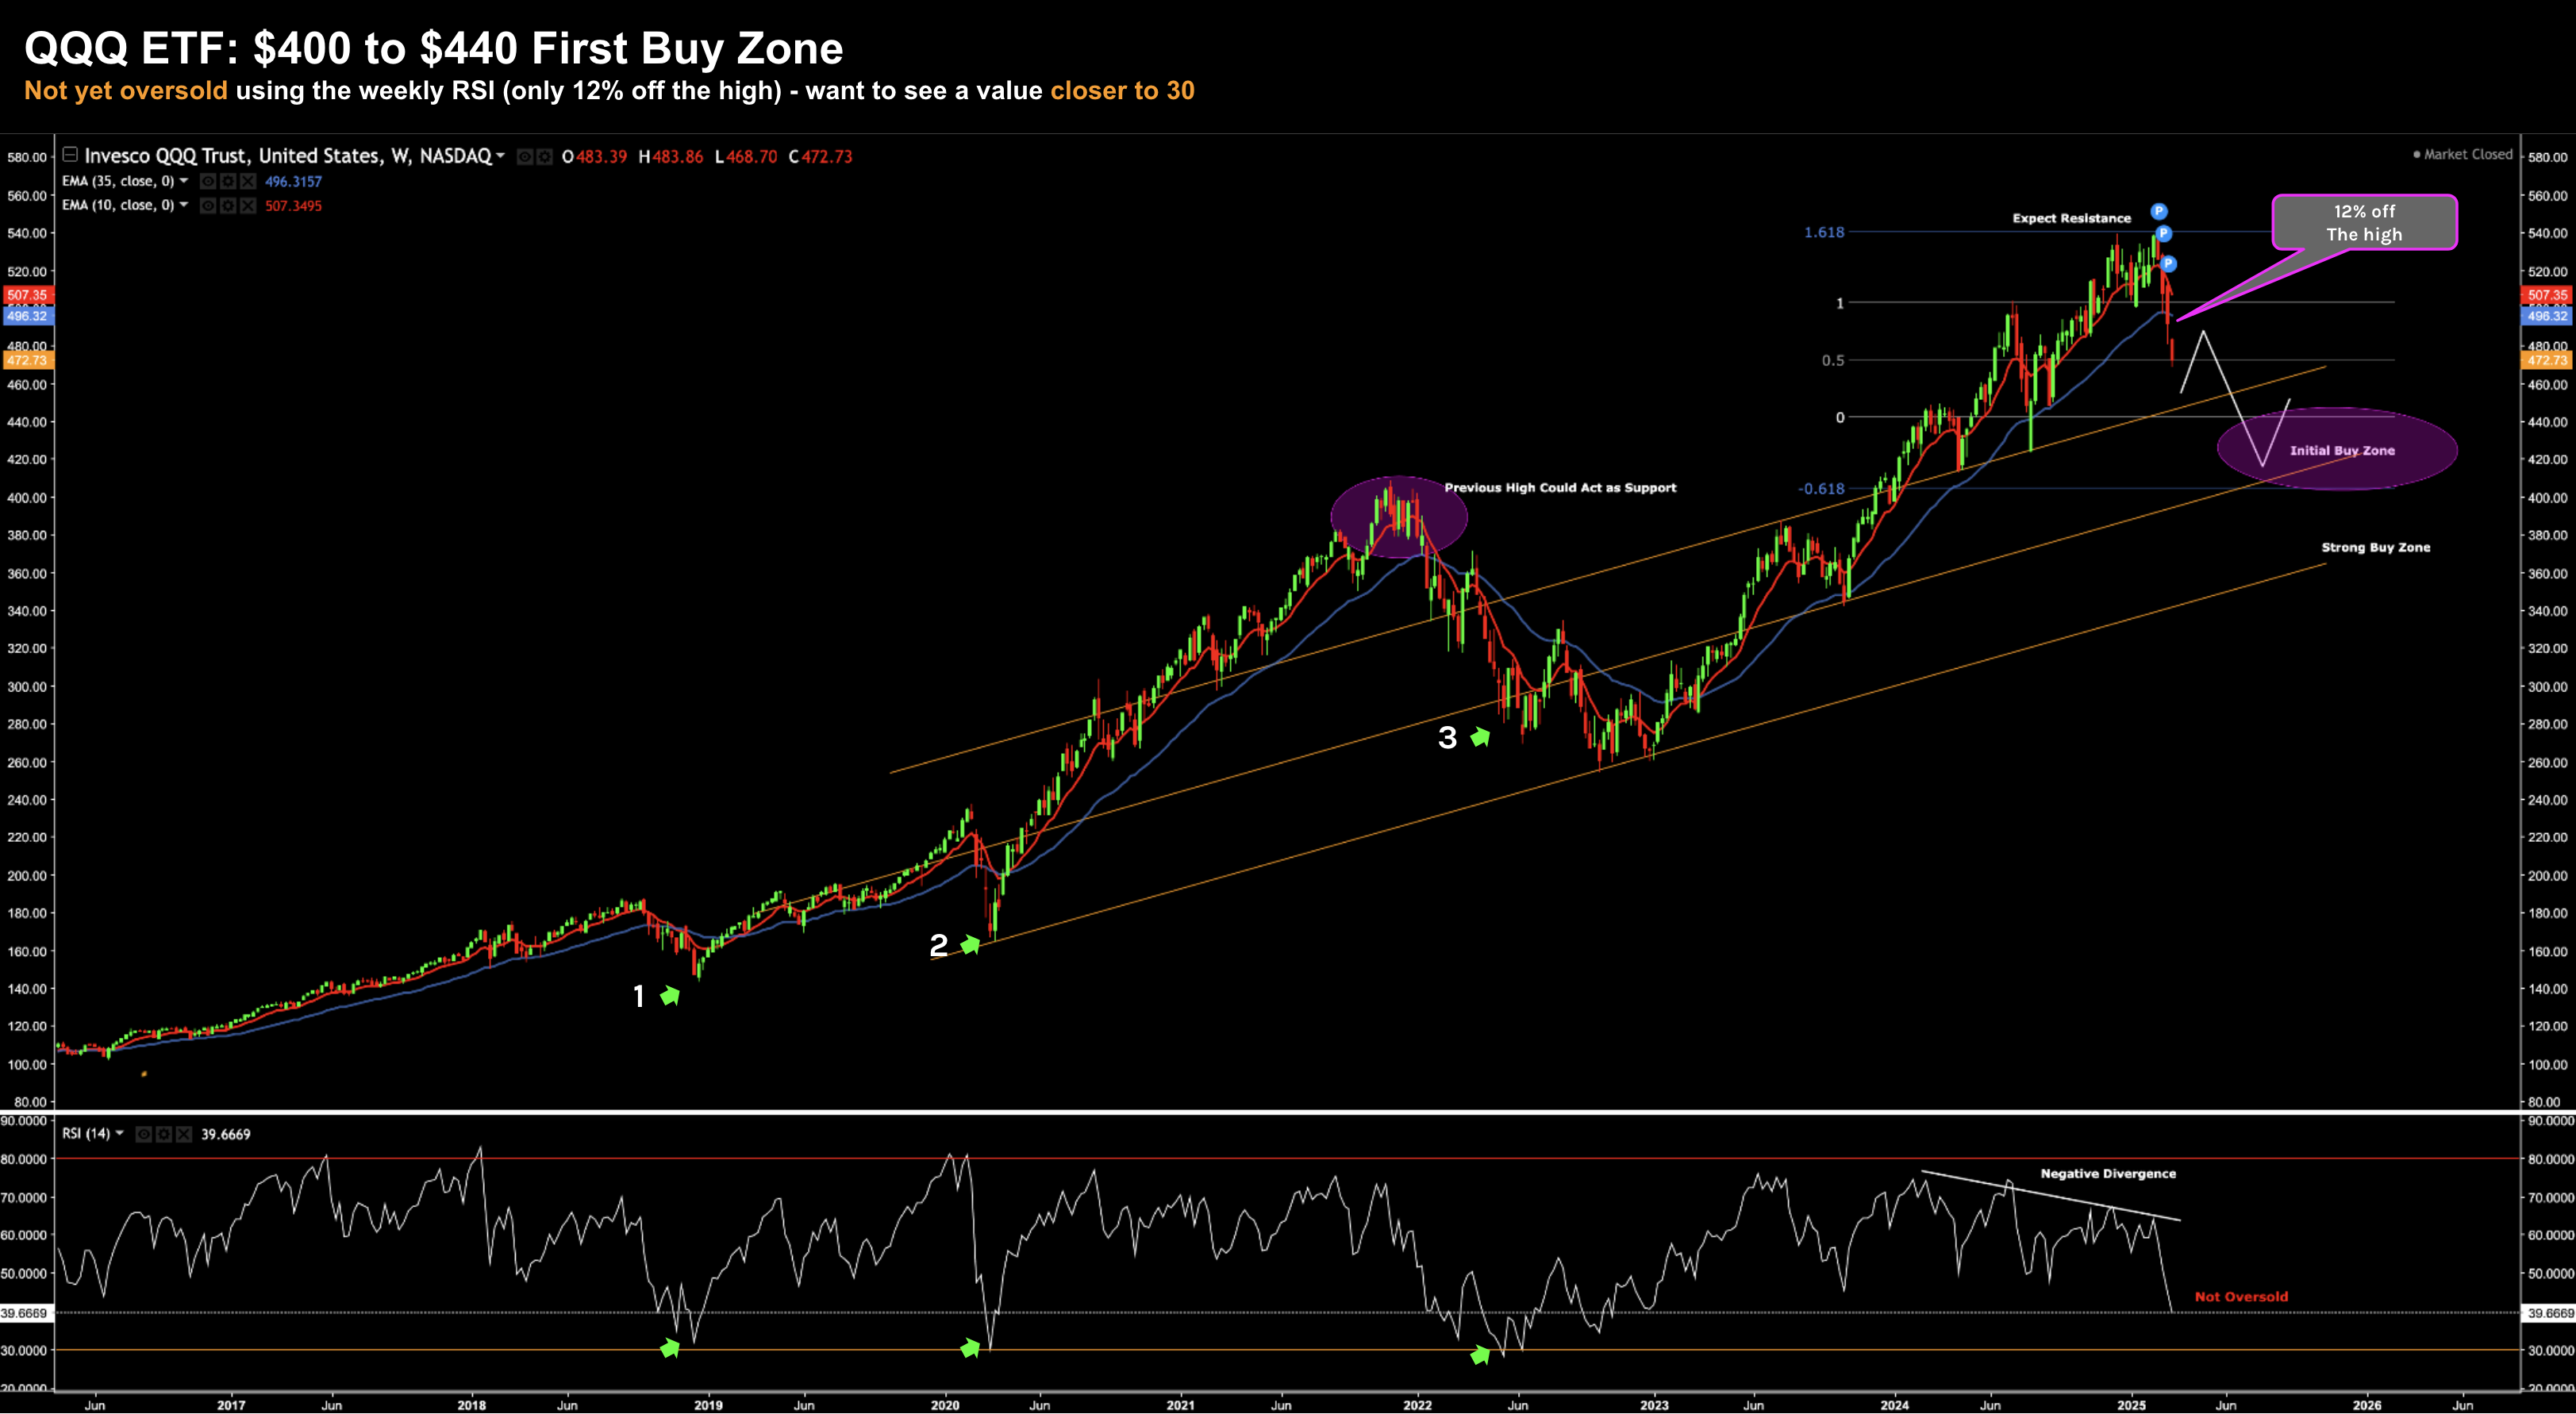
First thing to highlight is the ETF is just 12% off its all-time high.
That"s not unusual.
What makes it feel painful (for some people) is it"s been a while since we"ve had this kind of retracement.
Four things to highlight:
- Weekly RSI – It"s currently 39 – which is not oversold. What I like to see is a value below 30 (orange line – lower window). I"ve highlighted 3 other occasions we have seen this (green arrows) – each were great long-term entries (and reasonably close to the eventual bottom).
- Trend Channel – I"ve sketched in two trend channels. The upper channel is defined by the recent lows in 2024 and resistance in 2023. This could act as a reasonable initial entry point in terms of risk reward. The lower trend channel – defined by the lows in 2020 and 2023 is a compelling area to get long. If we see that – it will coincide with a weekly RSI well below 30.
- RSI Negative Divergence – here we see how the RSI continued to make lower lows as the price went higher. When I see this – I"m not convinced of the price action. It tells me the buyers are not committed.
- Previous 2021 Highs – the highs made in 2021 (purple ellipse) could be an area of support in the near term. This would coincide with the upper trend channel buy zone.
Put together – I think there"s more downside to come for the QQQs.
Now timing the market is very difficult to do. We can"t pick bottoms and we may not get to the areas identified on my chart.
Therefore, you may want to establish a third of your ideal position size around today"s level.
And from there, if we see the price move lower to the upper trend channel – buy your next third (i.e., $400 to $440)
And should we trade down to the lower trend channel – e.g., a price b/w $380 and $400 – take your final third position.
If your view is to buy and hold this ETF over the next 3-4 years – this trade could work out very well
To be clear, it doesn"t mean the price could not head lower – it could.
There"s nothing to say we don"t retest the lows of 2022. I think it"s unlikely given the earnings growth in large-cap tech – but it"s possible.
However, if buying the zones I"ve flagged (averaging down) – your probabilities of profitability are good over the long-term.
Putting it All Together
One last chart for additional perspective….
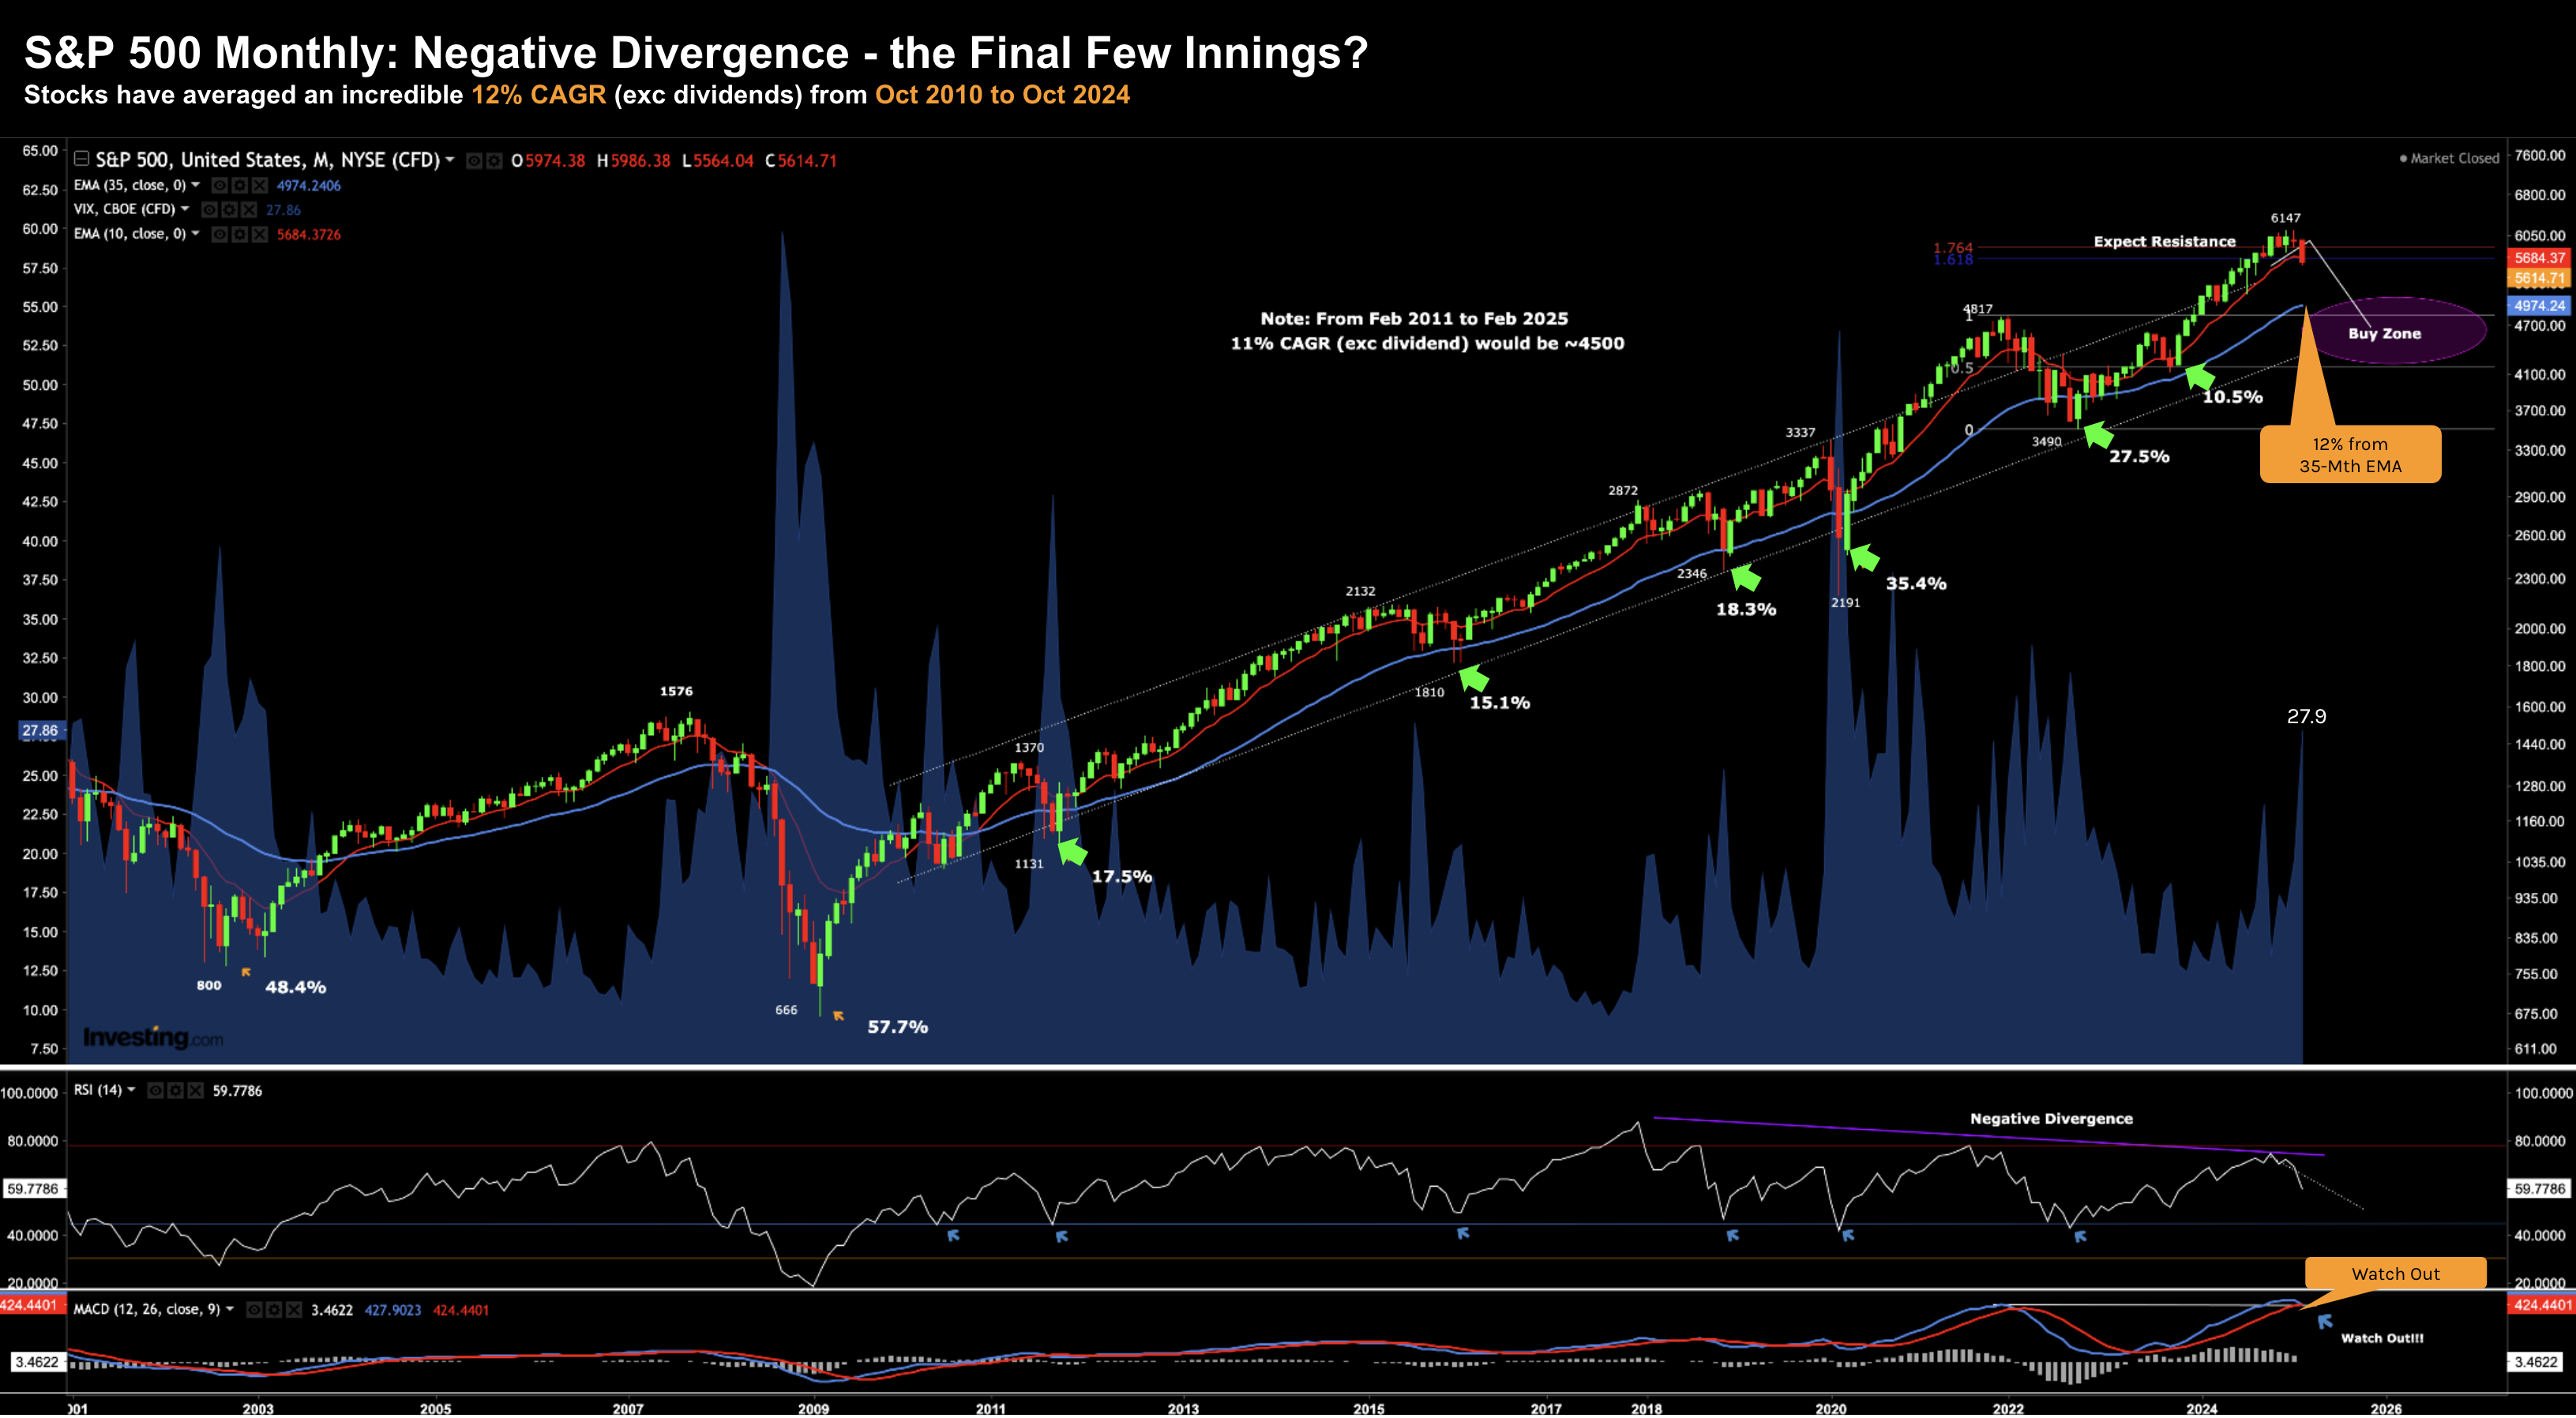
When evaluating the S&P 500 – it"s important to also examine the monthly timeframe.
It helps get rid of the noise and puts things into perspective.
This is something which is often lost on traders (and investors) who are only looking at daily charts (which are mostly useless)
And this is why I think there could be more downside:

March 10 2025
Three things:
1/ Long Term Trend Channel
- Observe the long-term trend channel from 2009 – where the 35-month EMA (blue) naturally follows this channel.
- Highlighted with green arrows are the 6 times the market has tested the bottom of the channel (around the 35-mth EMA)
- We are still 12% above this level – which gives us a sense of what could be ahead…
2/ Strong Negative Divergence
- Here we see the series of lower highs with momentum despite higher highs
- This is generally a sign of lower prices ahead
3/ Monthly MACD Cross
- The last time this turned negative was February 2022
- The market went on to shed about 19% that year.
As I wrote at the end of February – we could be in the "final few innings" of this epic bull run from 2009
To be clear:
The path down won"t be a straight line… expect many periods of sharp buying.
In fact, I think we will see that soon...
However, with a bearish tape, typically any strength is used as an opportunity to sell
Keep your pencils sharp as I think better prices are still ahead.
