Category Cycles

The Fourth Shift: The AI ‘Honey Pot’ and Late-Cycle Dynamics Demand Strong Cash Position

3-Years Since ChatGPT Launched… What’s Changed? 

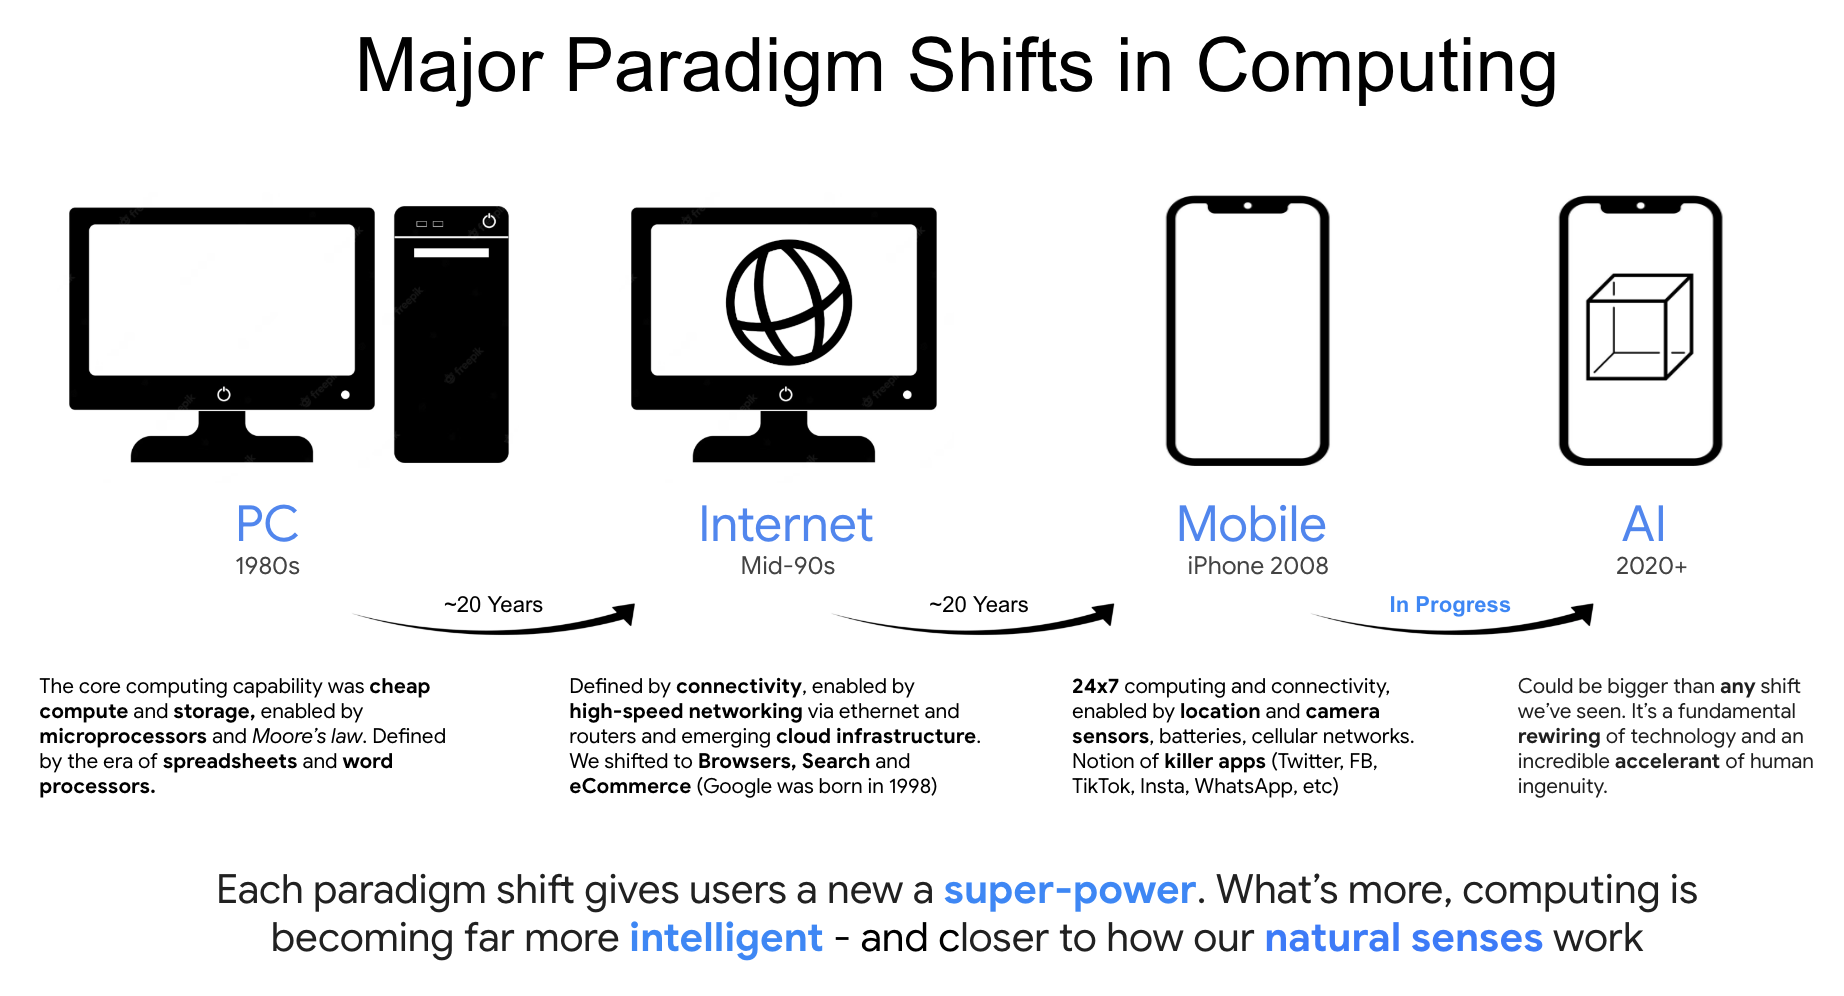
The seismic shift triggered by ChatGPT 3 years ago reminds me of 1995 when Netscape hit our screen. But as we approach the year 2000 - several "greey swans" emerged. Could 2026 be similar. This post discusses some of the possible risks looming for next year. This AI revolution has many of the hallmarks we saw some 30 years ago; i.e., creating extreme capital concentration in giants like Nvidia. As we enter what I think is a late-cycle phase, our focus shifts to systemic risks—from AI disillusionment to credit volatility.

Capital Destruction: Why 23x Forward Earnings is the ‘Magnetic Center’ for the AI Bubble Capital Destruction: Why 23x Forward Earnings is the ‘Magnetic Center’ for the AI Bubble

Capital Destruction: Why 23x Forward Earnings is the ‘Magnetic Center’ for the AI Bubble

Investor enthusiasm for AI is reminiscent of the Internet boom circa 1995. Having worked at Google, I've seen AI's profound impact firsthand, from computer vision to self-driving Waymo vehicles that have achieved 10M rides. But as an investor, the focus must shift to economics: business models, monetization, and valuation. Billionaires like David Einhorn are sounding the alarm: spending hundreds of billions on AI infrastructure may lead to massive capital destruction if CapEx vastly exceeds consumption. History shows that while the technology transforms society, an oversupply creates painful market corrections. The question isn't if AI is the future—it's what price you pay for it.

The Rate Cut Trap: Why ‘Bad News’ is Finally Bad News The Rate Cut Trap: Why ‘Bad News’ is Finally Bad News

The Rate Cut Trap: Why ‘Bad News’ is Finally Bad News

History shows that central bank easing cycles generally benefit stock markets. However, we should ask why central banks are cutting. If the Fede cuts rates to combat a slowing economy, the news may not be as positive as it seems. A weakening economy means lower corporate earnings and reduced consumer spending, which are ultimately negative for stock prices. Several bleak monthly jobs reports is evidence that the economy is struggling. But is just a soft patch or something worse? I suggest exercising caution - rate cuts are not always a positive.

The Bull Steepener Warning: What 10-Year Yields and BBB Spreads Signal The Bull Steepener Warning: What 10-Year Yields and BBB Spreads Signal

The Bull Steepener Warning: What 10-Year Yields and BBB Spreads Signal

It would not surprise me to see the market give back 10–15% over the coming weeks and months. Valuations are very full and the economic data is weakening. But something to watch is the bull-steepening of the 10-yr / 3-mth yield curve from inversions. Whilst not a great timing too - generally its 'vector' is correct. That's a warning - despite the Fed cutting rates.

The 0.1% Risk Premium: Why the S&P 500 Hits Stall Speed at 6,000 The 0.1% Risk Premium: Why the S&P 500 Hits Stall Speed at 6,000

The 0.1% Risk Premium: Why the S&P 500 Hits Stall Speed at 6,000

Another week comes to close - as we draw near the end of the second quarter. For the past two weeks or so - investors are reluctant to push prices much higher. From mine, the index is not only expensive - trading near a forward price-to-earnings (PE) ratio of 22x - the downside risks don't handily offset the (possible) upside reward. For eg, it would not surprise me to see the S&P 500 trade up to a zone of 6,200 (adding another 5% or so). However, equally I see a possibility for a 10% to 20% move lower given the risks to earnings growth, inflation (from tariffs), employment and geopolitical tensions.

The Patience Paradox: Why ‘Buy and Hold’ Fails at 23x Earnings The Patience Paradox: Why ‘Buy and Hold’ Fails at 23x Earnings

The Patience Paradox: Why ‘Buy and Hold’ Fails at 23x Earnings

Over the past ~40+ years - the S&P 500 Index has returned an average of ~9.3% annually exc. dividends (i.e., 171.6 Jan 1985 to 5,979.5 Jan 2025). If we limit that to the past decade (from 2015) - that avg annual return increases to 11.4% (excluding dividends). But what matters most is (a) the price you pay; and (b) when you get out. Sitting tight for 10 years does not guarantee a 10% return...

The Cost of Capital Reality Check: Why Rising Bond Yields Dictate the Next Market Cycle The Cost of Capital Reality Check: Why Rising Bond Yields Dictate the Next Market Cycle

The Cost of Capital Reality Check: Why Rising Bond Yields Dictate the Next Market Cycle

Can the stock market significantly advance with bond yields going higher? That's what investors are trying to gauge. As governments around the world look increase their (already high) levels of borrowing and spending -- it's plausible bond yields are set to rise further. And it's not hard to explain why... demand is falling as supply increases. But at what point does the stock market say enough?

Credit Cycles and Market Psychology: Navigating the Impact of Interest Rates on Long-Term Value Credit Cycles and Market Psychology: Navigating the Impact of Interest Rates on Long-Term Value

Credit Cycles and Market Psychology: Navigating the Impact of Interest Rates on Long-Term Value

If you needed reminding the market remains closely tethered to monetary policy - we received it this week. Stocks surged on the back of two things: (i) CPI coming in slightly better than expectations; and (ii) the prospect of the Fed having more room to ease rates. Bond yields dropped and stocks jumped. There's nothing quite like the sniff of cheaper money to get the animal spirits moving. However, it's still far too premature to jump to conclusions.

Lesson: Don’t Try and Pick ‘Tops or Bottoms’

Everyone makes mistakes. In fact, I love 'collecting' mistakes - whether they are my own or from someone else. It's the only way I learn. This post shares two 'mistakes' from a popular media personality. His name is Jim Cramer who hosts a show called "Mad Money". Earlier this week he said "the bottom is in for CrowdStrike". Big call given recent events. Fast forward a few days and the stock is 16% lower than when Jim called the bottom. So what can we learn from this?

The Big Tech Unwind

Can the market let the air out of the bubble without consequence? The answer relates to my post on economic cycles. That is, panics and busts only occur after booms and bubbles. But what a minute - are you saying this is a bubble? My answer to that is look at where we are in relation to the long-term mean. That's your litmus test. For example, if we simply take the S&P 500 - it trades at ~22x forward earnings (on the assumption earnings growth this year is 12%). The 10-year average forward PE for the S&P 500 is ~18x (mostly as a function of long-term yields trading near zero). And the 100-year forward PE average is closer to 15.5x. And if we look at tech specifically - valuations are even more extreme.