Category Market History

Patience Alone Doesn’t Get it Done

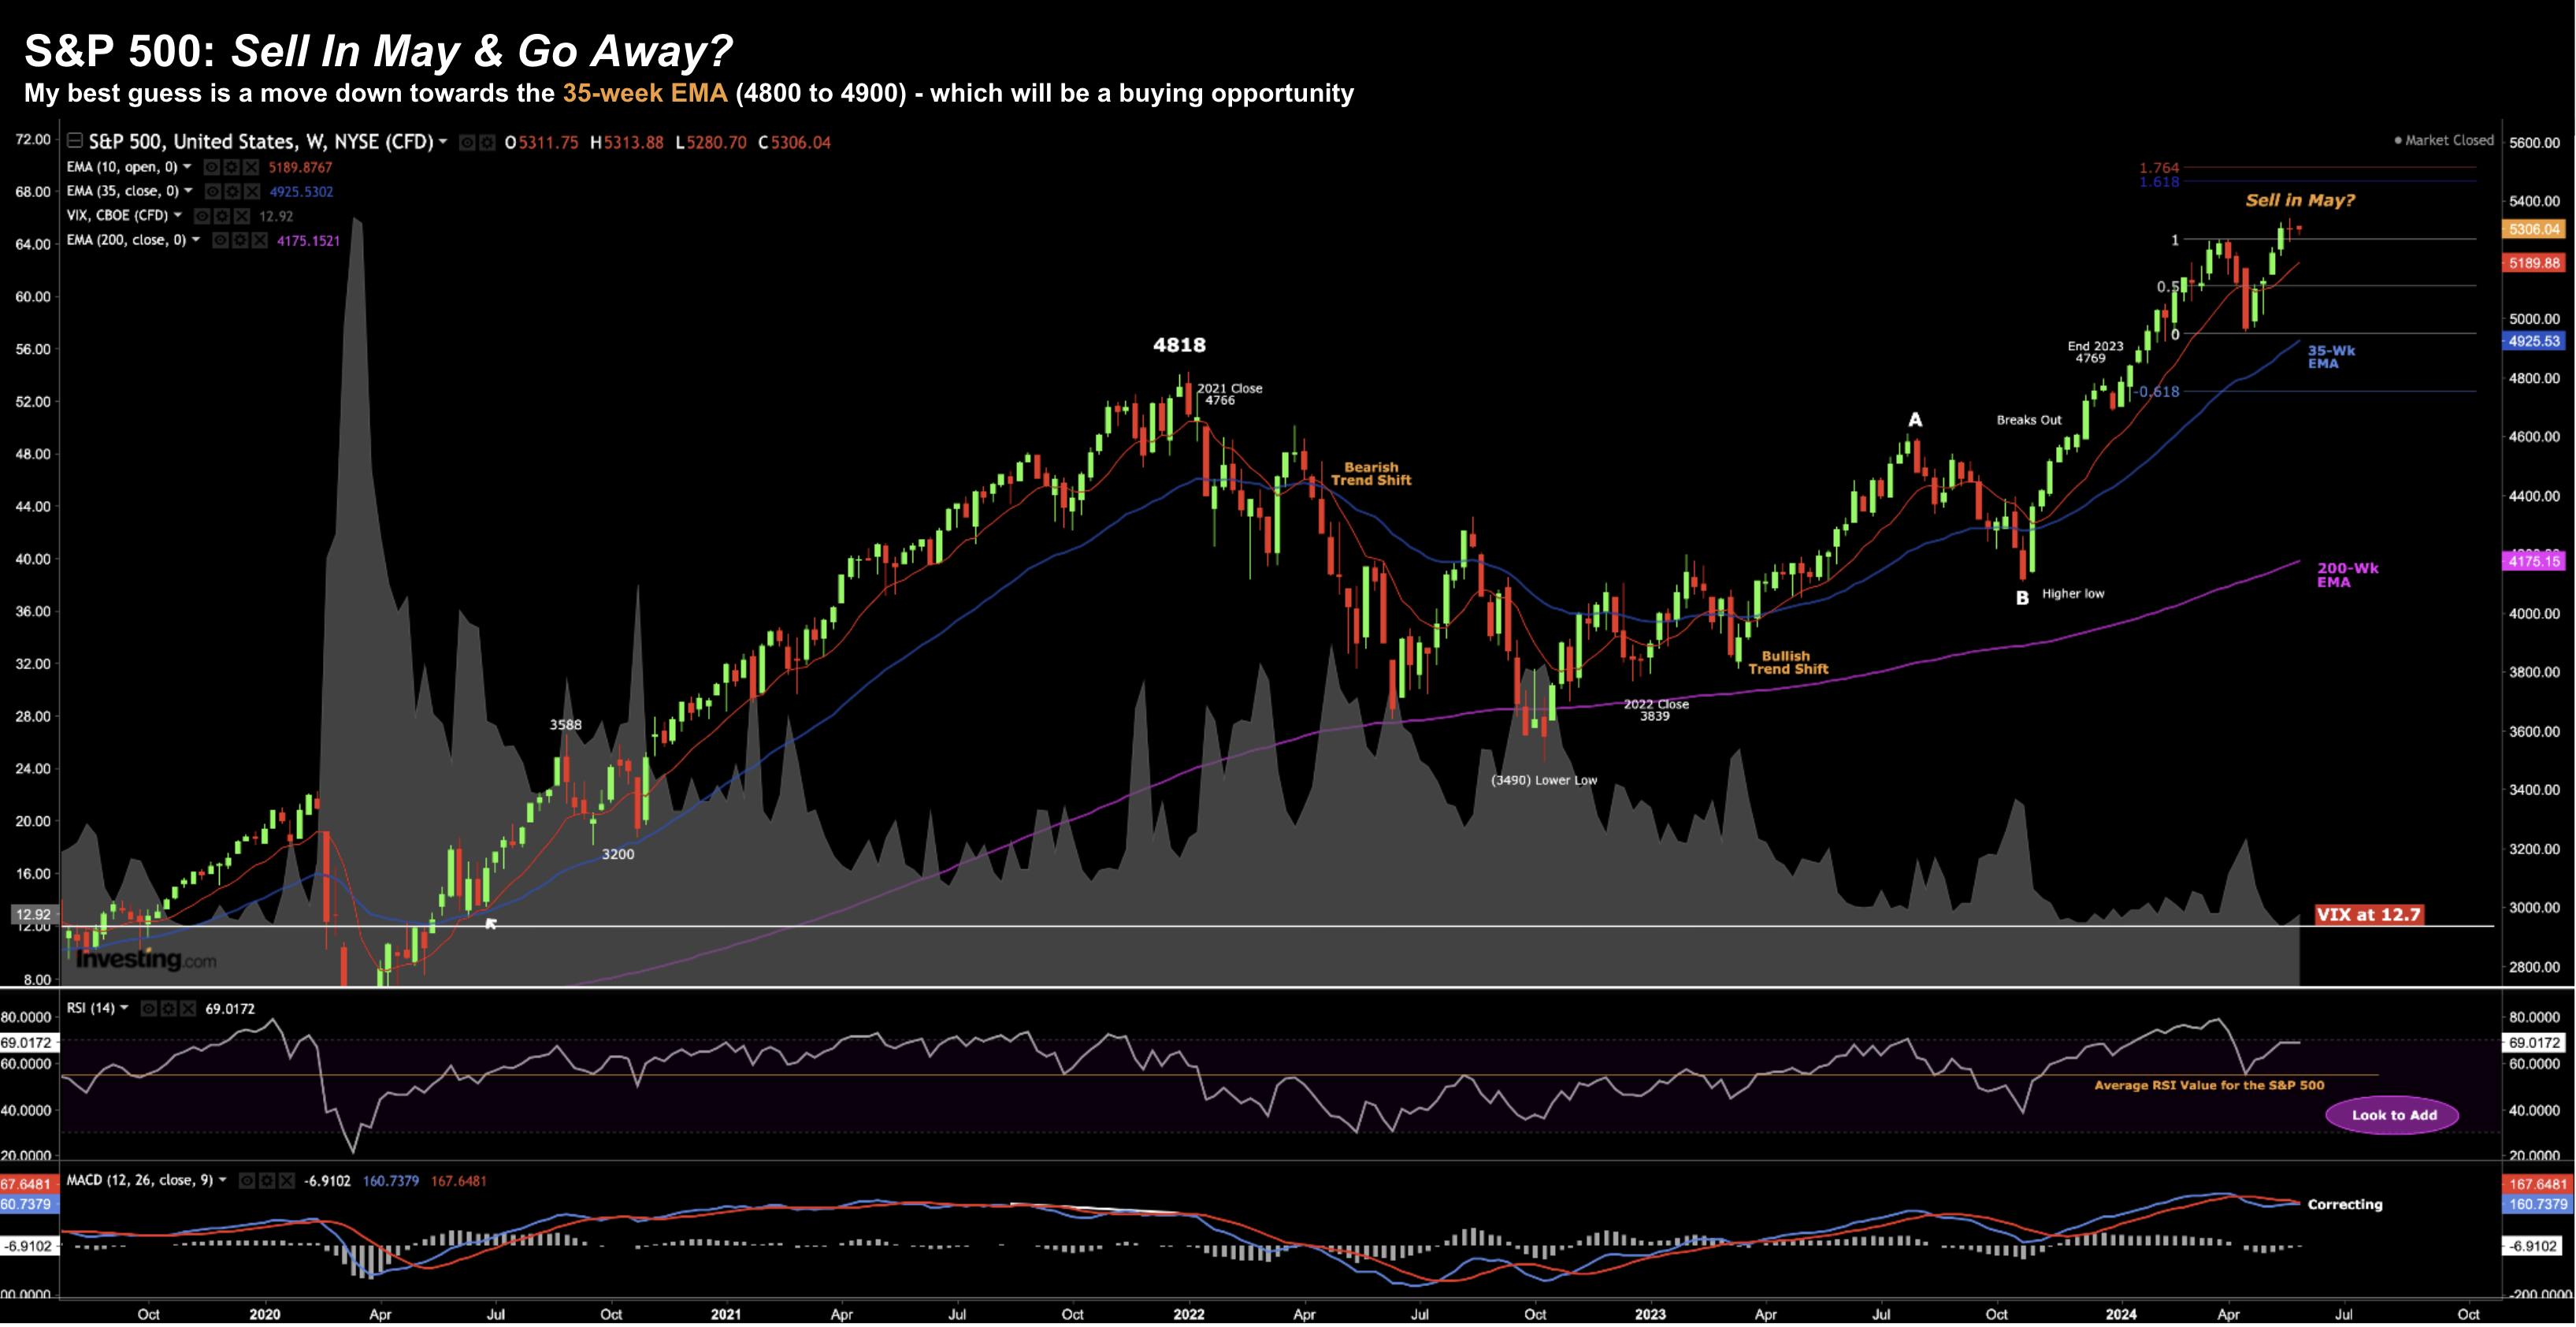
Over the past ~40+ years - the S&P 500 Index has returned an average of ~9.3% annually exc. dividends (i.e., 171.6 Jan 1985 to 5,979.5 Jan 2025). If we limit that to the past decade (from 2015) - that avg annual return increases to 11.4% (excluding dividends). But what matters most is (a) the price you pay; and (b) when you get out. Sitting tight for 10 years does not guarantee a 10% return...

Will Investors be Emboldened by Fed Easing?

Are stocks headed for a melt-up with the Fed set to ease rates over the next 12+ months? It could seem that way as stocks continue to print new highs as the 'soft landing' script firms. And whilst there might be further upside - the environment echoes a lot of what we experienced from the mid 1990's. For example, at the time we had expanding growth, low inflation with aggressive easing from the Fed. What's more, investors were very bullish on the promise of the internet - set to deliver powerful productivity gains. Stock multiples continued to expand as the S&P 500 delivered strong double-digit gains not seen in decades. Today conditions feel similar.

It’s Not Only Falling Inflation & Growth Risks Driving Rate Cuts

As inflation continues to moderate and the employment picture weakens - markets are trying to gauge just how much the central bank will move. A 25 basis point (bps) cut for September is now a 100% probability according to CME Group’s FedWatch tool. There's a 63.5% chance of a 25 bps cut; and 36.5% of a 50 bps cut. Markets clearly want 50 bps... but they also know that very rarely is there just "only one rate cut". This post explores the relationship between debt growth (across all sectors) and the overall trend for interest rates. It's a relationship which is not often discussed - but would be remiss of investors to ignore.

It’s Fed Week… Market Sees Cuts Coming

Are rates restrictive? And if they are - how do you know? That's the question the Fed will address tomorrow - but it's not easy to answer. For example, on the one hand there's a (large) cohort who believe the Fed are falling 'behind the curve' - therefore increasing the odds of a recession. They feel that growth risks are to the downside - and do not need to wait for both inflation and employment data to confirm what's ahead. On the other side of the coin - there are those who think we still run the risk of higher inflation if acting too early.

Is the Market “Euphoric”?

It's that time of year... where "Sell in May and Go Away" makes its typically annual appearance. Personally I don't give it much weight... basically none. Who invests with the timeframe a few months? Not many that consistently make money. But therein lies the rub - this saying is only relevant as a function of how you choose to invest. Your time horizons are likely very different to mine. This post will offer background where the adage comes from. From there, I will try and answer the question of whether the market is "euphoric". And finally, I'll share some names that I've been adding to.... it's not NVDA.

Money Supply is Expanding: Fuel for Stocks

When the supply of money expands - it's typically very good for stocks. For example, the S&P 500 index is said to appreciate at an average annualized pace of 14.02% when liquidity expands. However, when it contracts, that gain was only around 7.0%. Today money supply is once again expanding after one of the largest contractions in recent history. This has the potential to be very good for investors. As they say, it's always easier swimming with the tide.

Buffett’s Letter: Time Not to be Greedy

If we needed confirmation the market isn't cheap - the Oracle of Omaha told us as much in his annual letter to shareholders. He sits on a record amount of cash - over $167B. But he is no hurry to overpay. Buffett's letter is compulsory reading for anyone who is serious about investment. It's filled with timeliness insights from the mind of one of the world's greatest investors (arguably the greatest). For example, very few (if any?) have averaged a CAGR of 19.8% for 58 years (see page 17) vs the S&P 500 10.2%

Three Cheers for 5,000!

This week the S&P 500 closed above 5,000 for the first time. Another milestone as we climb the 'wall of worry'. Over the past 100+ years the S&P 500 has averaged capital gains of ~8.5% per year plus dividends of ~2.0%. That's a total return of close to 10.5% (on average). If you compound 10.5% per year over 20 years (i.e., 'CAGR') - that's a 637% increase. But as we know, the pathway is rarely smooth. Some years the market may "add 20%" and others it could give back a similar margin (or worse). And we saw this happen recently. However over the long run - markets will rise more often than they fall.

Many Lessons in One Great Chart

This post looks at one of the most compelling / informative long term charts I've come across. For example, it shows relative PE ratios, interest rates, bond yields, bull and bear markets along with performance. For me, not only does it reinforce the power of time with asset speculation - it also highlights the opportune windows when to add risk (and when not to). The latter is far more important.

Cautious… But Invested

It's a brave person who is short the market. Probabilities suggest we are headed higher in the near-term. For example, previous episodes of Fed pausing suggests stocks typically gain. My sentiment today is best described as 'cautious... but invested'. To that end, one should always be invested to some extent. And whilst it's always unwise to be completely remiss of the risks -- it would be an even greater mistake not to have some exposure to higher quality risk assets and fixed income (at current yields)