The 1,100 Point Gap: Why 22x Earnings Defies the Gravity of 0.2% GDP Contraction
Words: 945 Time: 4 Minutes
- Why now is a good time to reduce risk
- Keeping an eye on (slowing) consumption trends (70% of GDP)
- Recurring applications for US jobless benefits jump
If we needed confirmation that economic growth is slowing – today we got it.
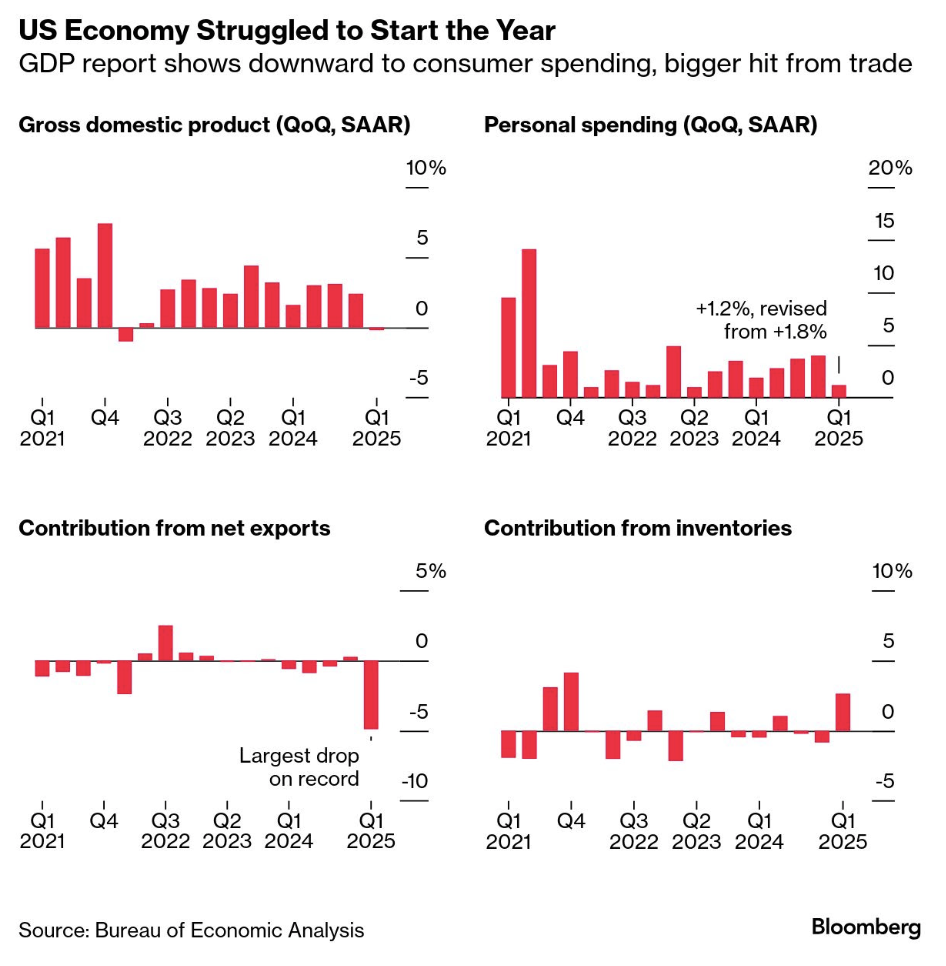
The US economy shrank at the start of the year, restrained by weaker consumer spending and an even bigger impact from trade.
Gross domestic product (GDP) decreased at a 0.2% annualized pace in the first quarter.
And there were also warning signs from the labor market (more on this shortly)
From Bloomy:
Let's explore…
Watching Consumption
Of the four charts above – it"s personal spending which has my attention.
Consumption makes up 70% of US GDP.
Quarter on quarter (QoQ) this was down sharply — however a single quarter"s data does not represent a trend.
With respect to consumption – what I prefer to measure is two-fold:
- Real PCE (Personal Consumption and Expenditure) adjust for inflation; and
- Quarterly Change Year over Year (not QoQ)
Three thoughts:
- We should always adjust for inflation to measure any data point in real terms;
- When analyzing trends – year-over-year (YoY) helps us smooth out out any noise or anomalies (e.g., tariff or seasonal impacts etc); and finally
- Consumption is a leading indicator of activity (whereas most other economic indicators like inflation, employment and growth are trailing)
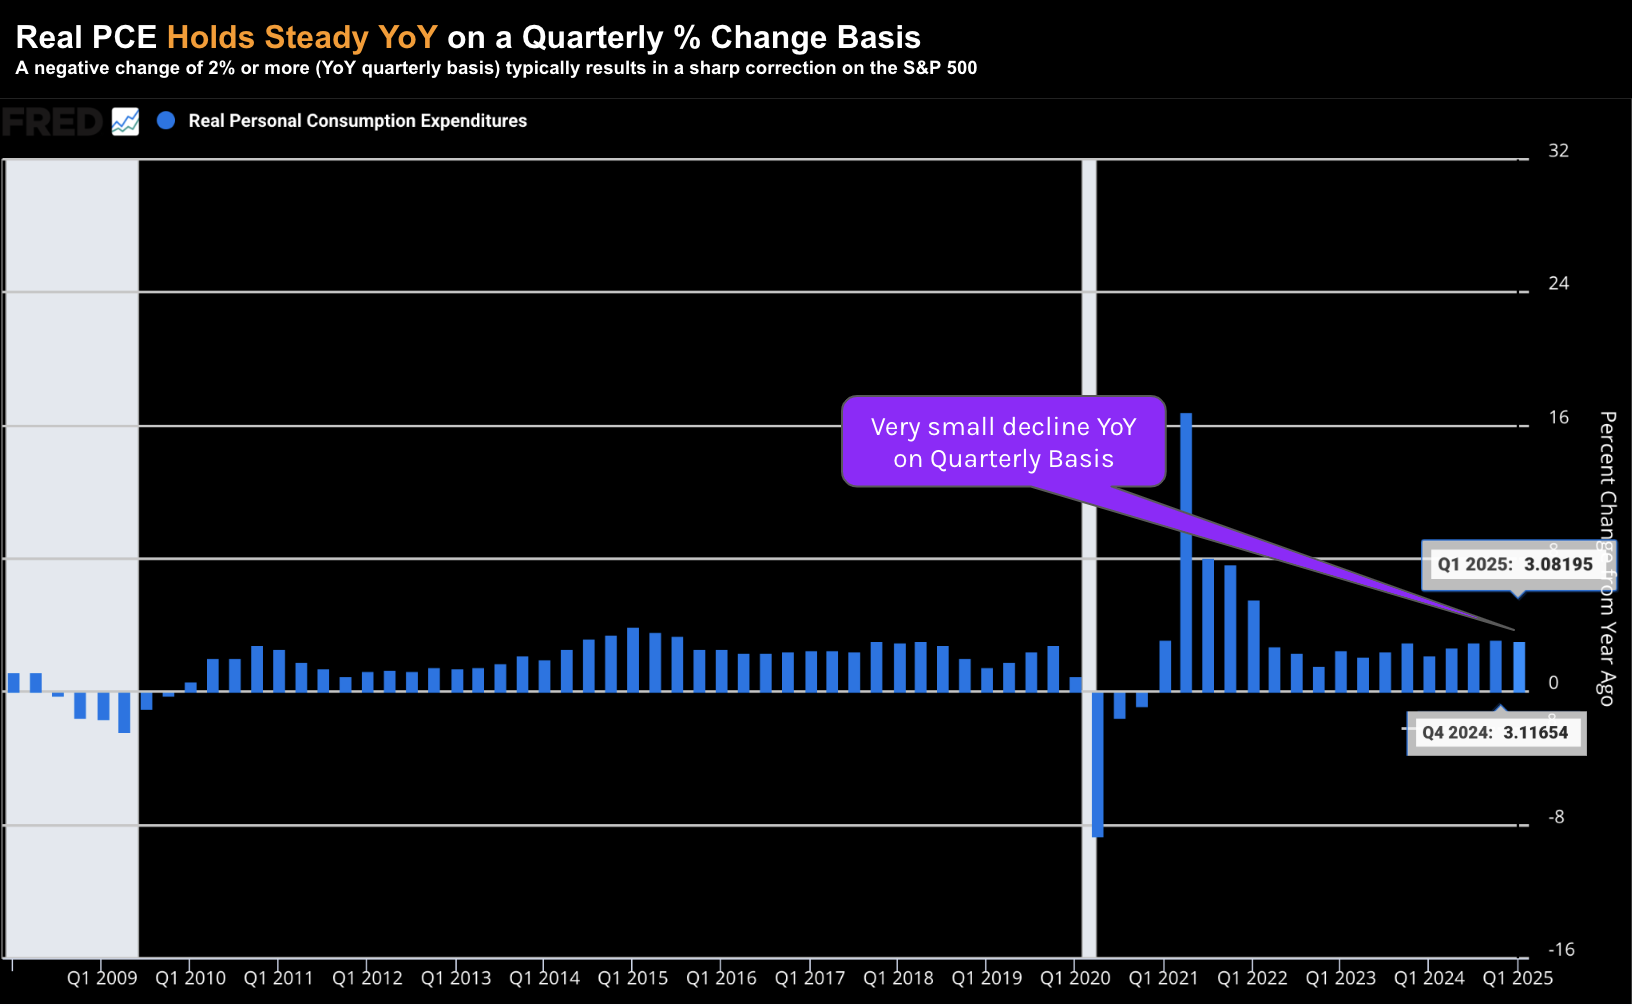
For those wanting to generate this chart – it"s available via the Fed"s site.
With respect to the settings – look to amend the following: (i) percent change from a year ago; and (ii) set it to quarterly timeframe (see below – right hand side)

Below we see that Q1 2025 (YoY) percentage change was 3.08%.
And whilst this is slower than the 3.12% YoY quarterly change in Q4 — for now it"s mostly steady.
In other words, consumers continued to spend.
I will raise a red flag if (or when) we see this decline 2% or more YoY (on a quarterly basis)
My expectation is this will fall in subsequent quarters.
Now Trump has argued that his trade policies will stoke economic growth in the future (i.e., expecting consumption to increase)
For example, with consumption at 70% of GDP, that is where economic growth will come from.
I believe his logic is deeply flawed.
Econ 101: make something more expensive – expect less of it.
In this case, goods and services will cost more (e.g., at least 10% more).
With consumers forced to pay higher prices — it"s difficult for me to understand how this will lead to increased consumption?
If I"m wrong – then I will throw out every book on economics (and human psychology) I"ve ever read.
So far, the data is confirming my thesis… but let"s continue to watch this over the coming months.
Jobs Weaken
The other data point I"m watching is jobs.
And whilst this is a trailing indicator (vs consumption which leads) – it gives us an insight into the relative strength of the economy.
In short, it"s difficult for consumers to increase spending if they (a) have lost their jobs; and/or (b) fear losing them.
On this, this week we learned that recurring applications for US jobless benefits jumped to their highest level since November 2021.
However, observe the trend from 2022:
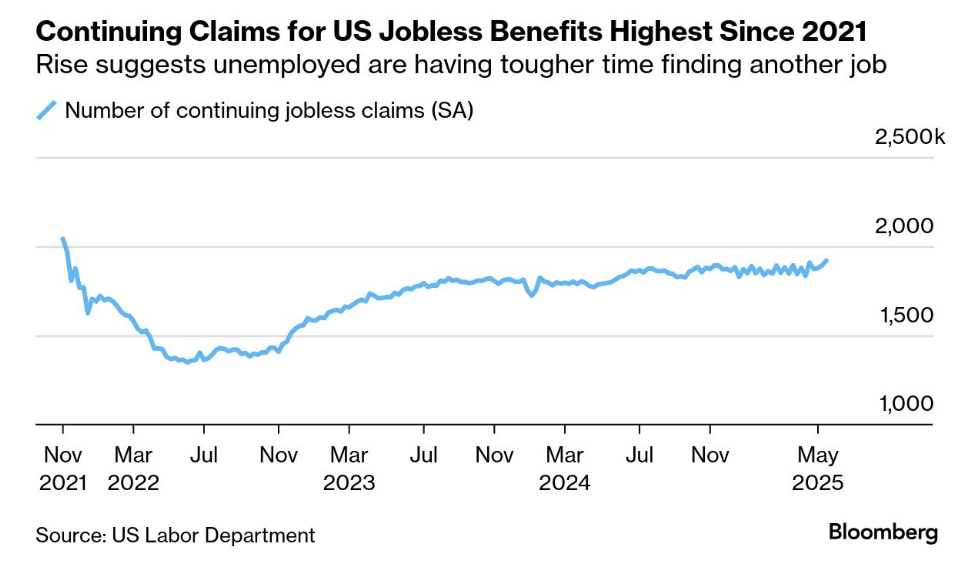
Bloomberg reported that continuing claims, a proxy for the number of people receiving benefits, increased by 26,000 to 1.92 million in the week ended May 17.
That exceeded the median forecast of 1.89 million in a Bloomberg survey of economists.
The numbers suggest the combined impact of Trump"s trade policy and government spending initiatives are starting to take a larger toll on the labor market as those out of work increasingly struggle to find new positions.
Again, this only reinforces my thesis that these are (strong) headwinds to growth.
If correct, then earnings are likely to come down.
This also implies the current forward PE ratio of 22x could be higher.
But that"s not what the market is pricing in.
Putting it All Together
Markets will always overshoot in both directions.
In turn, this creates opportunity for savvy (patient) investors.
For example, greed will drive prices well above their long-term mean (i.e., 22x forward); and fear will drive it below.
In terms of average forward multiples – the mean for the S&P 500 over the past 10 years is 18x.
And if we go back 100 years – it"s closer to 15.5x
Based on this – here"s some back-of-the-envelope math to help dimension the risk(s):
- With the S&P 500 trading 5912 – investors are paying ~22x forward earnings.
- Earnings are assumed to be in the realm of $275 per share (i.e., 5912 / 275 = 21.5x)
- $275 assumes double-digit growth on last year (i.e., no economic slowdown)
- For the past 10-years the market has averaged a multiple of 18x forward
- Using 18x as the mean – it implies the market is potentially 4 x $275 = 1,100 points above the 10-year mean.
This is best summarized by Howard Marks business cycle diagram (see below) – where the blue line is the (rising) growth in earnings over time (which is ~7-8%)
Self-defeating behaviors such as bias and greed will drive the multiple paid well above the average ("d"). That is generally a good time to reduce risk.
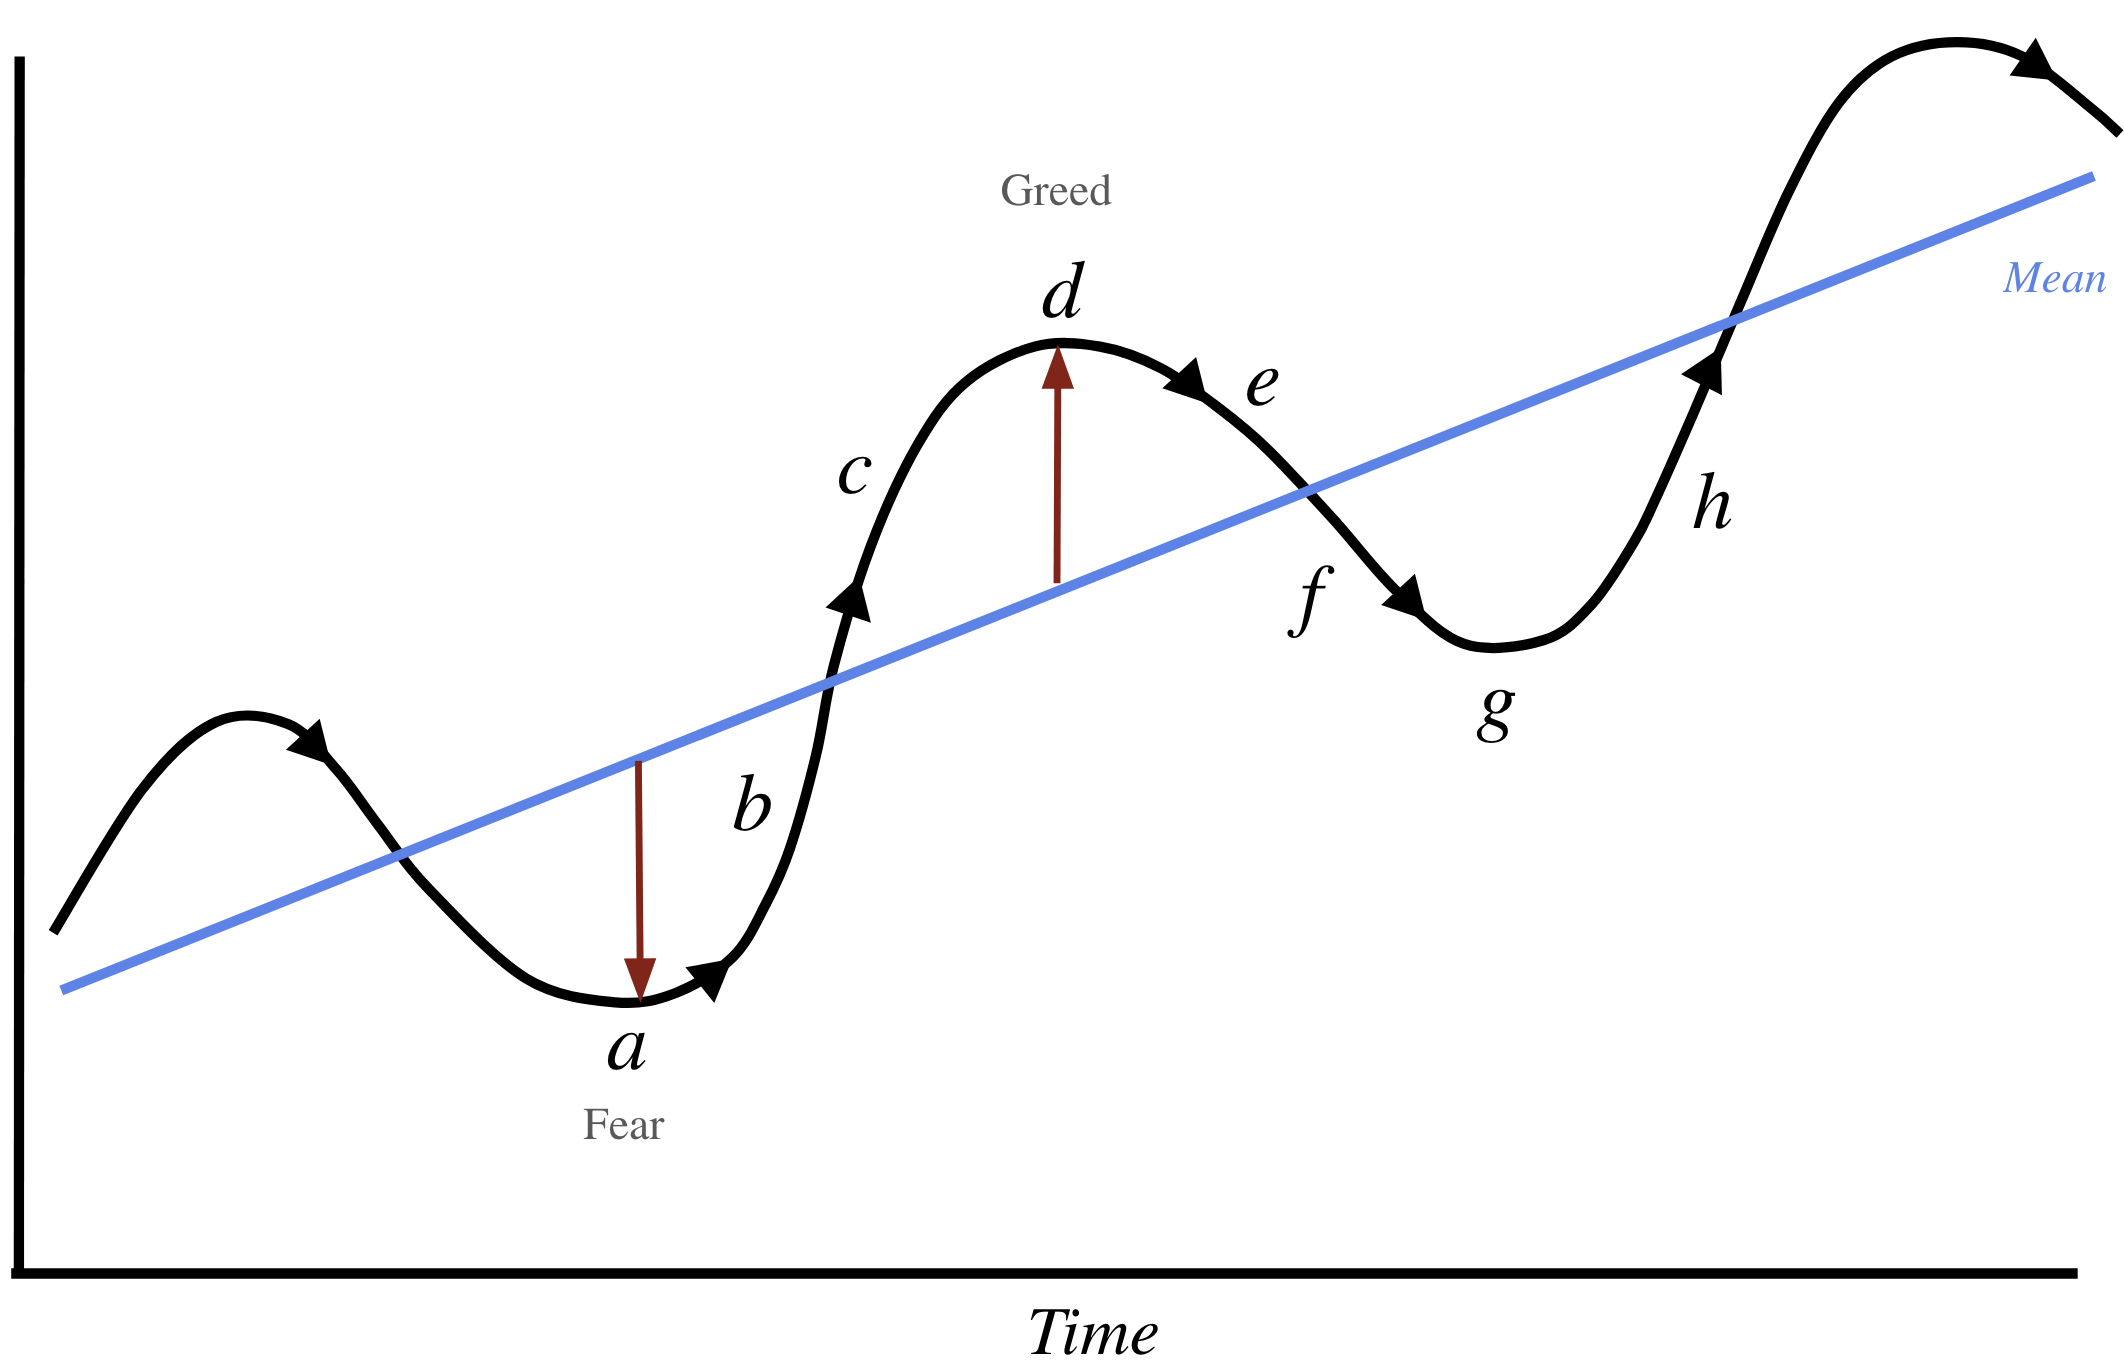
On the other hand, emotions such as fear and panic will drive the multiple below the mean ("a"). That"s a time to add to risk.
As Warren Buffett would remind us: "be fearful when others are greedy; and be greedy when they are fearful"
And whilst I could be wrong – now feels like the right time to reduce risk.