The Quality Filter: Why a 15% Net Margin and 10-Year ROIC are the Only Antidotes to a Sideways Market
Words: 4,413 Time: 18 Minutes
- Investment strategies for a range-bound (or bear) market
- How to discover quality assets to reduce the risk of loss
- The attributes and metrics of a company I focus on
It"s my thesis market returns over the next few years are unlikely to match what we"ve seen over the past decade (see this related post).
However, I"m also of the view that will create great opportunities for savvy patient investors who think long-term.
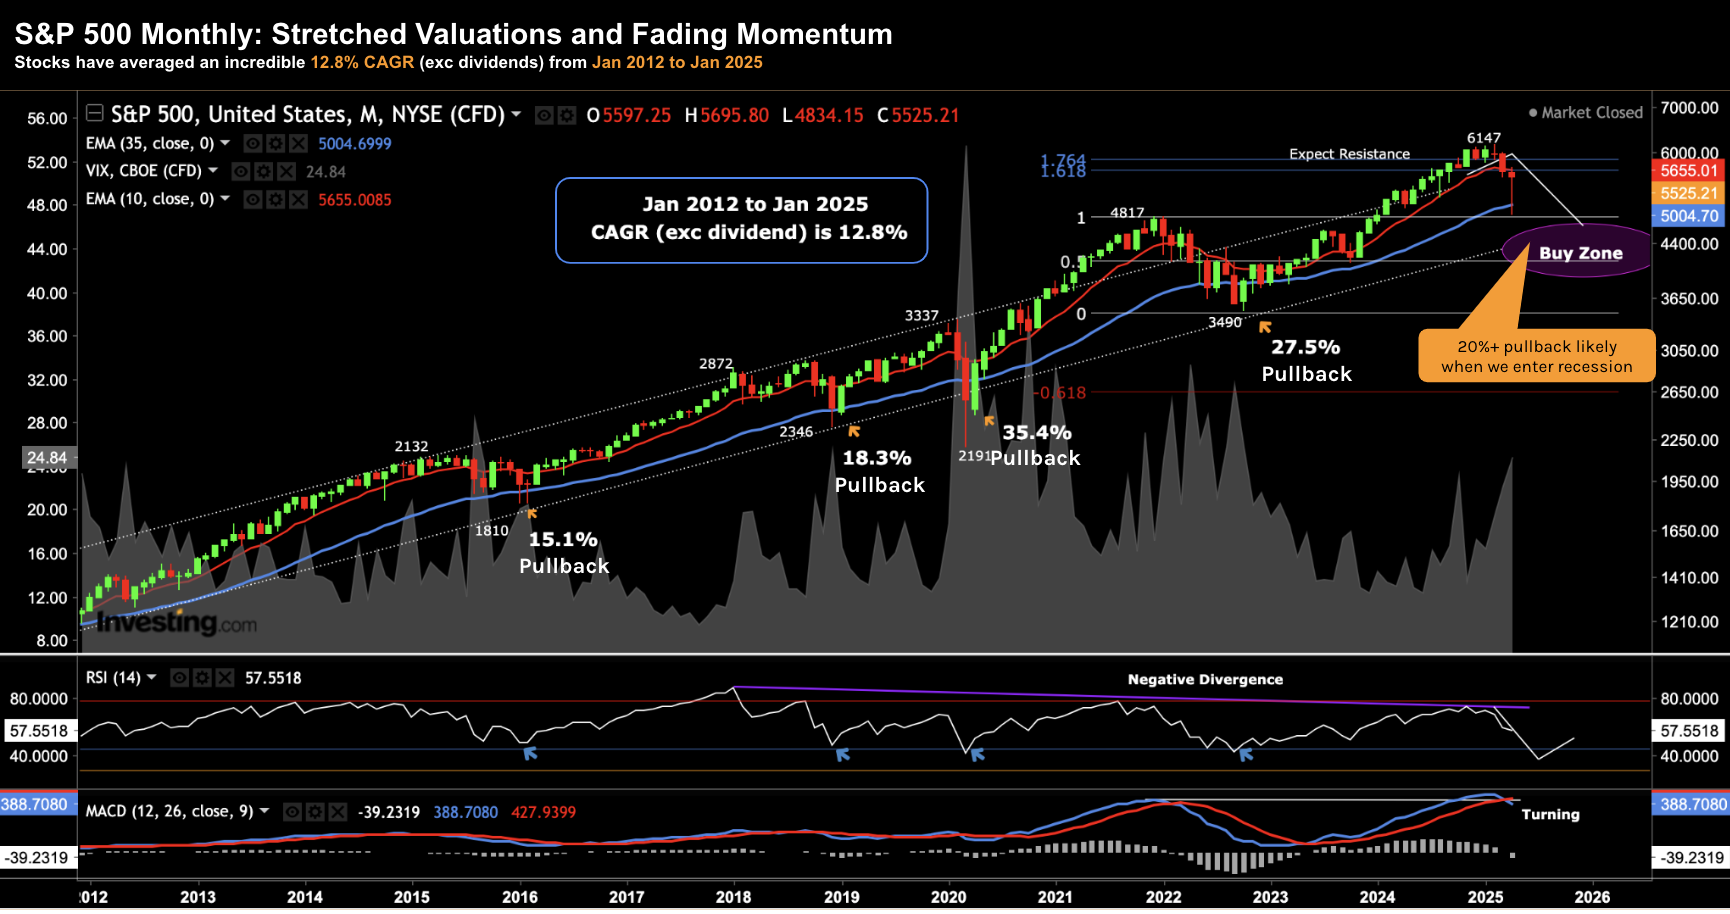
To help frame this missive – from 2012 to 2025, the total return for the S&P 500 was ~15% per year (inclusive of ~2% annual dividends).
Exclusive of dividends – price appreciation has seen CAGR of 12.8% over this same period.
These are well above average returns; i.e. some ~4% per year higher than the 100-year average of ~8.5% (again exc. dividends)
Below is the monthly chart from Jan 2012 to today showing the price appreciation CAGR:
April 27 2025
Over the past 9+ months – I"ve consistently highlighted both the valuation and technical risks as the market made new highs.
From a valuation perspective – the Index is not cheap at ~20.1x forward earnings (despite coming off the highs). This assumes earnings per share (EPS) of $275.
However, should EPS come down (e.g., due to growth headwinds or tariffs risks or other risks) to say $260 per share (or less) – the asking multiple increases to 21.3x.
For comparison, the average forward multiple over the past 10 years is ~18x (see chart below from Yardeni Research).
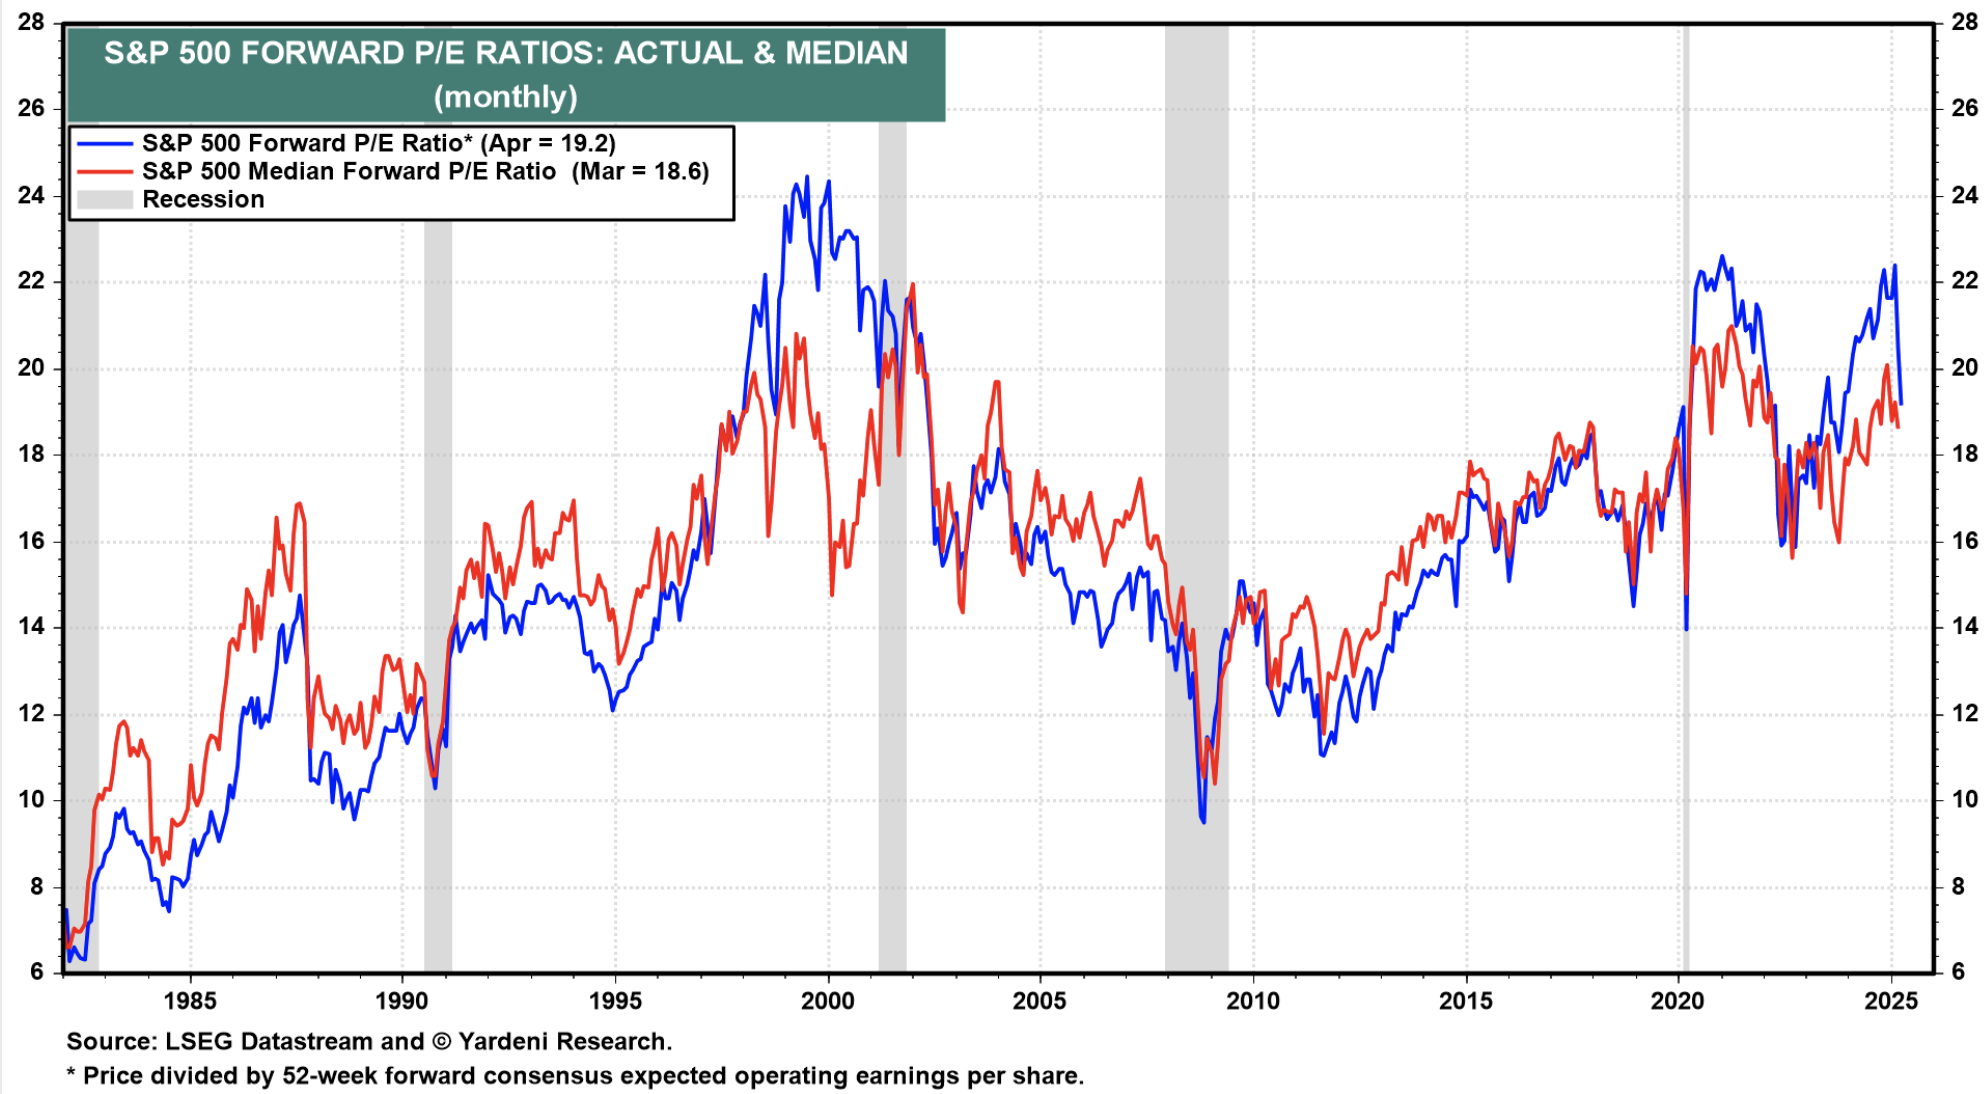
Source: Yardeni Research
Over the past 100-years, the average forward PE is closer to 15.5x. That said, the average 10-year yield was above 5.5%.
From a technical perspective, I"ve talked about how momentum has stalled (see "How Far Will Multiple Expansion Take Us?")
In the chart above – my two favoured momentum indicators (monthly RSI and monthly MACD) have both rolled over (something called "negative divergence").
This is often a warning of lower prices ahead.
Finally, I shared this from Factset (with my own annotations).
Their chart shows the divergence between expected EPS (dark-blue RHS axis) and the S&P 500 (light-blue LHS axis).
What"s troubling is the large divergence which opened up in recent months (i.e. the gap between the light-blue and dark-blue lines).

Put these things together – I doubt we will see the same kinds of large (double-digit) returns we have been blessed to see the past decade or more. It"s been an epic bull market.
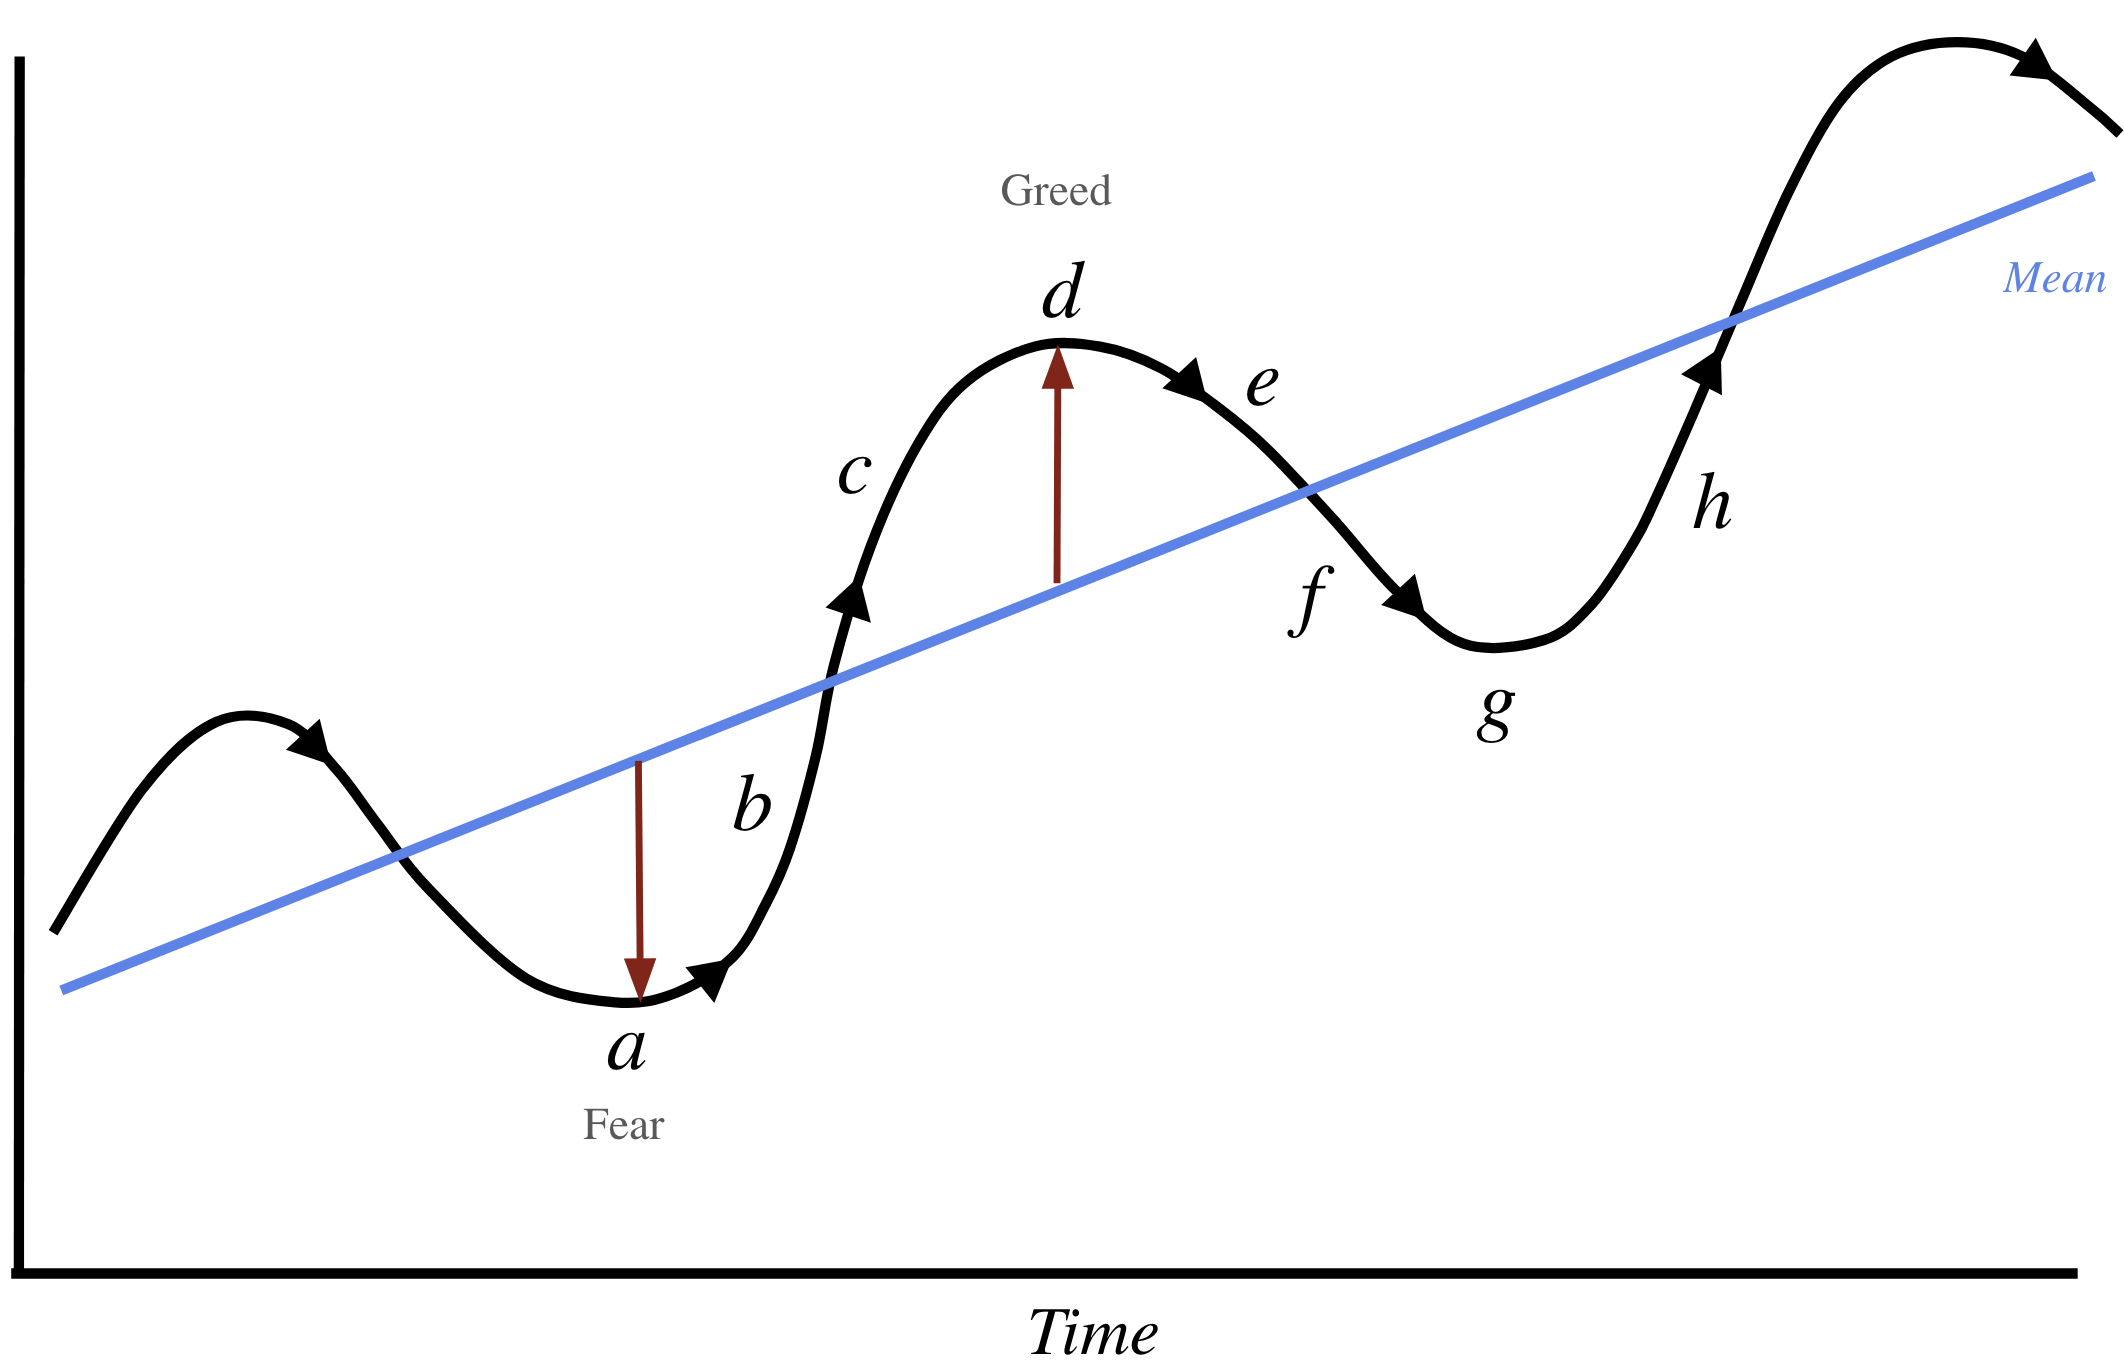
I expect both the prices asked (and market multiples) to revert to the mean.
That said, multiples are unlikely to simply stop at the mean.
For example, due to investor fear and panic over recession and slower growth – they will fall below the mean – creating opportunity in high quality names.
The opportunity to buy is closer to point "g" on this chart… where the blue line is the gradual 7% (nominal) rise in earnings over the long term.
So what should you focus on when (not if) the opportunity comes?
In short – very high quality.
When markets are in decline or we find investor"s mood sours – you want to only want to own the best stocks.
Now investors who have not focused on quality (i.e., more speculative assets) can do well during rising markets. As they say, a rising tide will lift all boats.
However, when the tide goes out (e.g., where growth stagnates or falls) these boats will be left "shipwrecked".
This post will talk to where I focus my capital during these times (and what it means to buy "quality")
What are High Quality Companies?
Warren Buffett is said to focus on six things before making an investment.
Five of these six focused on the company"s quality. The sixth filter (and the most difficult) is its valuation.
The good news is it"s not difficult to reduce your potential investment list to only high quality stocks.
However, it"s far more difficult to find high quality at a reasonable (or discounted) prices.
In fact, it"s quite rare for stocks to be offered at a considerable discount. For example, we"ve seen these only 3 times the past 25 years.
What"s more, when they do go on sale, you need to be cashed up (and ready to act) when they do.
And generally, this will require a contrarian mindset (as almost all other market participants will be selling)
Let"s frame this post by reviewing what Buffett looks for in a company:
1. Simple and Understandable Business
Buffett calls this staying within his "circle of competence". He avoids businesses he can"t easily explain or predict.
2. Consistent Operating History
Buffett also looks for companies with a long record (10-20+ years) of stable and growing returns on capital and cash flow.
To Buffett, flashy growth isn"t as appealing as consistent performance over several decades.
To this point, I published this which describes how Buffett built a trillion dollar cash machine.
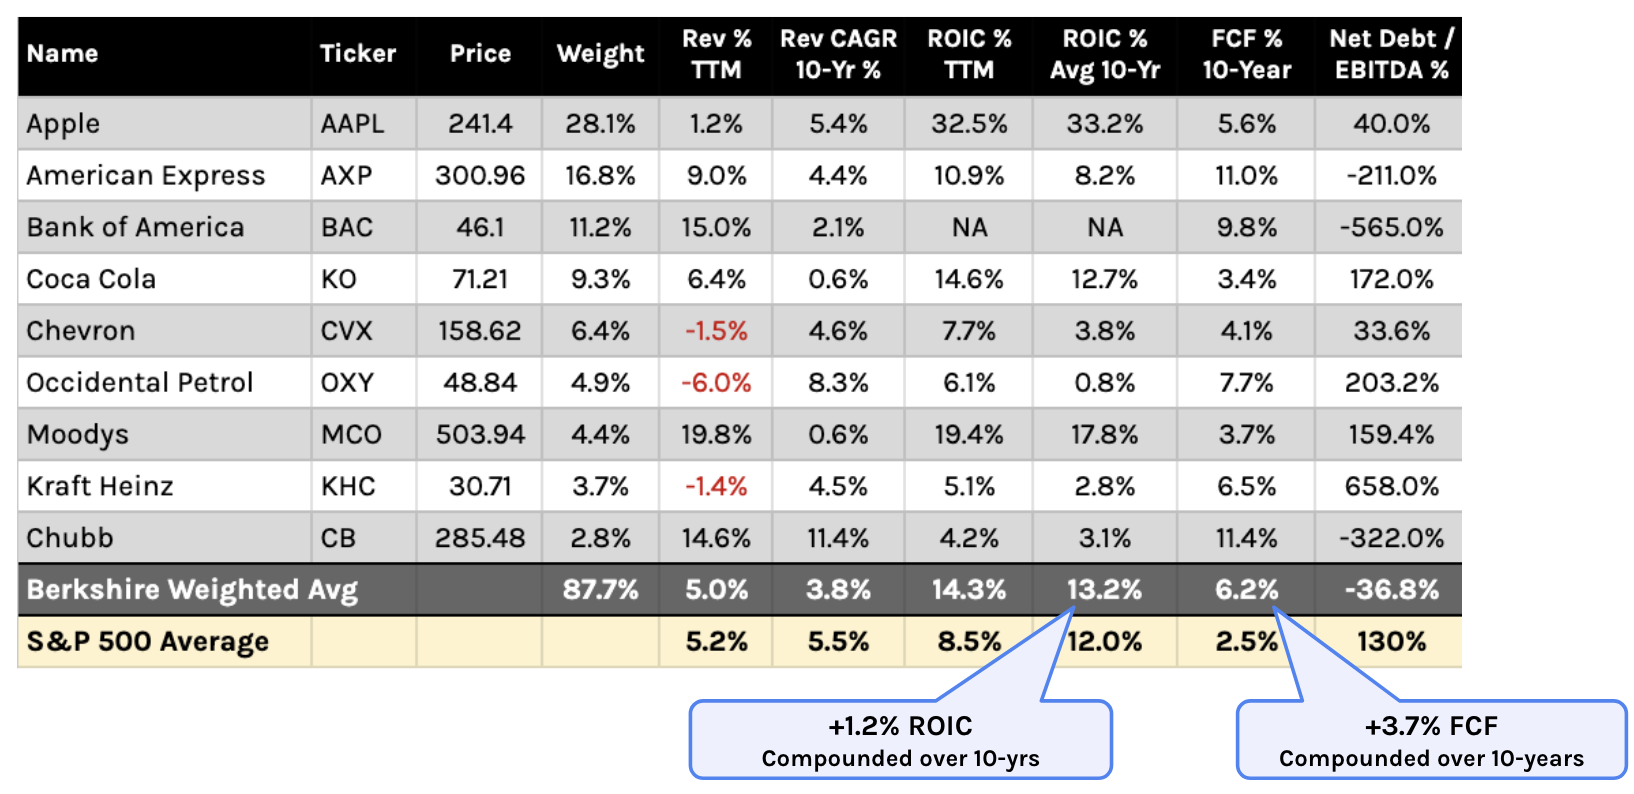
With respect to revenue growth – I called out the 10-year average of his largest holdings over the past 10 years.
That average is just 3.8% vs the S&P 500 at 5.5%. In other words, revenue growth is not the focus of Buffett"s core investments (which I will expand on later)
3. Sustainable Durable Advantage
Buffett wants companies with a durable competitive advantage (or a strong "moat") – demonstrated by strong brands, pricing power, or network effects.
More importantly, he avoids businesses vulnerable to disruption or with little competitive advantage.
To find companies with a sustainable durable advantage, look no further than the 10-year average net income margins (NIM).
For example, if a company averages at least 15% over 10 years – they have pricing power in their respective market(s).
By way of example, Coca-Cola (KO) averages a NIM of almost 20% over the past 10-years – a testament of its pricing power and resilience.
There are "a million" other soft-drink competitors – and yet KO does not need to discount.
It"s a product people want and a brand they are familiar with and trust.
Other companies with strong 10-year (15%+) average NIM"s include Google, Adobe, Apple, Amgen, Biogen, McDonalds, Johnson & Johnson – to name just a few.
You should avoid companies with low (single digit) net income margins in bearish or challenged market environments.
4. Competent and Trustworthy Management
When you buy shares in a stock – you"re trusting their management (on the basis most of us are passive investors)
Buffett looks for honest, talented and shareholder-focused managers.
Specifically, he values capital efficiency (and allocation) skill almost as much as operational skill.
I will talk to capital efficiency below when I focus on return on investment capital over the long-term.
Great managers will prioritize their return on capital rather than simply chasing growth at any cost (as many companies do)
5. Strong Financial Metrics
Buffett essentially prioritizes the following metrics (not limited to) when assessing the financial health of a company:
(i) Return on Invested Capital (ROIC);
(ii) Return on Equity (ROE);
(iii) Free Cash Flow (FCF); and
(iv) Low or manageable debt.
I talked about this here – again referencing Buffett"s largest 9 holdings. Repeating some of my language from the post:
With respect to ROIC – over 10-years – Buffett"s weighted portfolio is +1.2% above the average of the S&P 500 (which is ~12%). Compounded over 10+ years – this makes a large difference.
However, the standout metric is FCF. Buffett"s weighted portfolio boasts a FCF 10-year average of 6.2% — which is 3.7% above that of the S&P 500 at ~2.5%
Buffett believes free cash flow measures the true health of a business (not its earnings).
As an aside, it"s not unusual to see a company report positive earnings growth despite a history of negative cash flow (somethig for investors to avoid)
Valuation – Quality at a Reasonable Price.
Armed with 10-years of a company"s balance sheet, income statement and free cash flow statements – it"s not difficult to create a short-list of 50+ stocks which meet the above criteria.
However, what"s far more difficult is knowing what to pay.
For example, simply buying the highest quality companies (e.g. Apple, Google, Amazon, McDonalds, J&J, Coke etc etc) can be a bad investment if you overpay.
I recently warned investors paying as much as 33x forward earnings for companies like Apple and Microsoft (among others).
As part of "Investors Start to Question AI"s ROIC" (Jan 31) – I explained not only the dangers of overpaying – but also the valuation measures that I prefer to use.
(1) EV/EBIT; and
(2) P/FCF
It"s worth noting that I don"t rely on price to earnings (PE) ratios.
Put simply, earnings can be heavily manipulated. I prefer something like EV/EBIT as it brings the balance sheet into the valuation.
And with respect to P/FCF – I like to understand how much I am paying for each dollar of cash flow (more on this below)
Let"s now expand on some of these factors to help you find better stocks in a challenging climate.
Sustainable Durable Advantage
A company with a "defensible moat" is one of the most overlooked aspects of investing.
For example, consider Apple and its user base of over 2B.
Tune into any Apple conference call – and CEO Tim Cook will always lead to the strength and stickniness of their (growing) user base.
Moreover, this is incredibly difficult for another company to replicate easily.
Many have tried (e.g., Amazon, Google, Meta, Samsung, LG to name a few) – none have succeeded in topping Apple"s powerful ecosystem.
This is important as you can increase your confidence level with assessing future cash flows.
Without a strong defensible moat, competitors will quickly move in whenever they see above-average returns (creating a "honey pot") – perhaps forcing the company to lower prices and/or lose market share.
Competitive and defensible moats can come in different forms:
- Strong brands (though not all brands are equally valuable)
- Patents or unique intellectual property
- Regulated monopolies
- Preferential access to natural resources
- Unique know-how (specialized expertise competitors can"t easily replicate)
And some companies (like Apple) will exhibit most (if not all) of these qualities.
Vitaliy Katsenelson who authored "The Little Book of Sideways Markets" emphasizes three main competitive forces that shape a company"s ability to maintain profitability over time:
1. Competition from Existing Rivals
How fierce is the competition today? If many players are fighting for the same customers, net income margins (NIMs) get squeezed. Note – this is why I look for a minimum 10-year average NIM of 15%+
2. Competition from New Entrants
How easy is it for new competitors to enter the market?
High barriers to entry (e.g., brand loyalty, patents, economies of scale) protect existing players.
Again, think how long it would take a competitor to replicate and exceed what the likes of Coke, American Express, McDonalds, Apple, Amazon, Google or Microsoft etc etc have built over the past 25+ years.
3. Competition from Substitutes
Can customers switch to an alternative product or service easily? If substitutes are readily available, it puts downward pressure on pricing and loyalty.
Katsenelson emphasizes competitive advantages for long-term survival:
"A company without a competitive advantage may survive in the environment where the market it serves is growing rapidly, as competitors are satisfied with growing sales in tandem with the market.
However, once market growth decelerates, competition intensifies and a company without a competitive advantage will be crushed by competitors"
Investing during a period of decelerating growth is where this post is focused.
Further to my opening preface, that"s what I think faces investors over the coming few years; i.e., a prolonged period of sideways-to-lower prices.
Therefore, the competitive moat of the asset you own now matters a great deal more.
I would recommend working through your portfolio of stocks and assessing whether you believe they have a very strong competitive moat.
Can their business be easily replicated? If not, why not? What are their moats that no-one else can do?
Start by assessing their average net income margin over the past 10-years. Is it more than 15%?
Management Quality
As investors – we have a tendency to simply scrutinize financial statements.
I know I"m guilty of making this mistake.
There was a period where I would exclusively focus on balance sheets, income and cash flow statements – and then making a decision.
That"s not enough.
And whilst pouring through 10-years of these statements might be more work than the average investor (my guess is many investors don"t even read annual reports) – not focusing on management"s quality can prove costly.
For example, something to look for is where executive compensation is married to stock performance.
This can often drive short-term performance at the expense of longer-term impact.
While management executes strategy, their primary goal should be building long-term competitive advantages—shareholder value naturally follows.
In addition, investors should be wary of management bias. Quite often they will "talk to their own book".
In Katsenelson"s book – he references Toll Brothers" chairman Robert Toll.
Toll repeatedly denied the housing bubble before 2006 while simultaneously selling hundreds of millions of dollars" worth of his company"s stock.
Another example is Dell vs. Gateway in 1992.
At the time, Gateway"s return on assets (ROA) was 3.5x higher than Dell"s. Dell had twice as many sales, but both companies had similar profitability.
Over time, Dell succeeded by fully committing to direct sales, while Gateway gave up this advantage by opening retail stores.
When computers became commodities and price a pivotal factor, Dell"s cost advantage proved decisive.
Two qualities to look for with management:
- Integrity and honesty
- Focus on long-term shareholder value, even when it disappoints Wall Street
On the first point – integrity and honesty – was key to Charlie Munger"s investment (and life) success. For example, Charlie told us:
"How you behave in one place will help in surprising ways later"
Peter Kaufman echoed this: "If the rascals really knew how well honor worked, they would come to it"
Charlie added that people investing in (and making contracts with) Berkshire do so because they trust their management to behave well – despite the power they have.
There"s an old expression which works here – quoted by Munger:
"How nice it is to have a tyrant"s strength and how wrong it is to use like a tyrant"
Charlie said that more often Berkshire has made extra money out of morality.
One of Munger"s role models – Ben Franklin – did not say honesty was the best morality – he said honesty was the best policy.
It"s well said.
Katsenelson recommends several approaches to assessing management"s quality:
- Look for managers who readily admit mistakes (very few do).
- Watch for those who recognize and admit to problems rather than denying them
- Listen to conference calls; read press releases and annual reports
As an aside, Warren Buffett readily admits (and owns) the investment mistakes he made. More important, he always says what he learned from the mistake.
As I like to say "it"s not the mistakes we make in life, it"s how quickly we recover that counts"
How many CEO"s do you hear do this during earnings conference calls (if ever)?
It"s rare.
With respect to long-term value creation… often you will find that management (not unlike investors) suffer from myopia.
However, a high quality business will engage in "pain today for gain tomorrow".
As context, humans evolved in an environment in which thinking about more than getting through the day or even to the "next meal" was not a valuable use of time.
People today, who live in very different environments, have a hard time with deferred gratification.
As an aside, this is why credit card companies and/or "buy now pay later" services have surged in recent years… people want it now (but don"t have the money). It"s a world of instant gratification.
Some (careless) investors think the same way. James Montier described the problem well here:
"The penultimate hurdle is myopia (or "hyperbolic discounting" if you happen to be a geek). This reflects the idea that consequences, which occur at a later date, tend to have much less bearing on our choices the further into the future they fall.
This can be summed up as "eat, drink and be merry, for tomorrow we may die".
Of course, this ignores the fact that on any given day we are roughly 26,000 times more likely to be wrong than right with respect to make it to tomorrow. Or if you prefer, this myopic bias can summed up by Saint Augustine"s plea: "Lord, make me chaste, but not yet"
For most listed companies – short-term (Wall Street) thinking forces even great managers into poor decisions.
The same applies for some investors…
Investors should always look for a management team that has the guts and the confidence to keep a long-term focus and to make fewer cowardly, compromising decisions that hinder a company"s long-term sustainable competitive advantage merely to satisfy short-term returns.
Bullet Proof Balance Sheets
As I mentioned earlier – when the tide is rising – you can make money from lower quality companies.
A rising tide lifts all boats – even boats that leak. But when that tide goes out – and growth stagnates or falls – those boats will sink.
By exclusively investing in companies with very strong balance sheets – this gives you a far greater probability of being successful (or losing less capital).
Put another way, they"re more likely to weather the storm.
Strong balance sheets give companies greater flexibility when markets decline.
For example, companies with little or no debt have more room to maneuver when business conditions change.
By way of example, if you look at Buffett"s weighted portfolio of his top 9 holdings – the average net debt-to-EBITDA ratio is negative (i.e., there"s no debt and cash available).
However, the S&P 500 averages around 130% in leverage.
Here"s the thing:
Businesses that could afford debt often avoid it. However, those that would benefit from more conservative financing (i.e., lower debt) often take on too much.
Why?
Companies with high return on capital and significant free cash flows typically don"t need to rely heavily on debt.
This is the case for almost all of the Mag 7 companies (excluding Tesla)
Two examples of industries which rely on large levels of leverage include auto manufacturing and airlines (two sectors I"m always happy avoiding).
These industries (and others like them) share three dangerous characteristics:
- High fixed costs (expensive factories, planes, unionized workforce).
- Sales highly sensitive to economic cycles; and
- Costs driven by unpredictable commodity prices (fuel, raw materials etc)
Together, these create "total leverage" – a mixture of operational leverage (high fixed costs) and financial leverage (high debt).
During downturns, revenues drop while costs stay high, quickly leading to losses.
Now if a company is carrying debt (which is typical) – you should ask yourself how many years of free cash flow could they pay off the debt?
For example, if the answer is say 3 (or less), that is not troubling.
If it"s something like 5 or more – then it could require the company going back to the market for more funding (never a good sign).
Therefore, I would recommend concentrating on ratios that compare debt levels to cash flows, as well as those that measure interest coverage. For example, I look at:
- Debt/EBITDA
- Debt/operating cash flows
- EBITDA/interest expense
- Operating cash flows/interest expense
Beyond the above – we should also look at potential "hidden liabilities"
This is debt which is beyond the balance sheet. Two common forms of large debt include:
- Underfunded pension plans – promises to pay current and former employees. Companies make assumptions about pension investment growth rates, and aggressive assumptions (e.g., 9% annual returns) may hide significant future obligations that could materialize when these high returns don"t happen.
- Operational leases: Contracts where companies rent assets (like retail stores) instead of buying them. Though treated as regular expenses, these represent long-term obligations that can"t easily be canceled. Credit rating agencies add these back to the balance sheet as both assets and liabilities
Key Financial Health Metrics: ROIC & FCF
I will end with two of Buffett"s favored financial "health" metrics.
- Free Cash Flows (FCF); and
- Return on Invested Capital (ROIC)
Again, here I referred to the financial summary metrics table earlier in the post. Let"s start with FCF.
Free Cash Flow (FCF)
FCF represents money remaining after a company pays all expenses, including investments for future growth (such as R&D etc).
A company"s ability to deliver strong consistent FCF is the true financial health of a company.
For clarity – it"s not its earnings (as many believe)
Put simply, FCF as "operating cash flows less capital expenditures" – what"s left after paying salaries, taxes, inventory, interest, and investments in physical assets:
FCF = Operating Cash Flow (CFO) – Capital Expenditures (CapEx)
Companies with significant FCF gain valuable flexibility during sideways or recessionary markets. For example, strong FCF gives them the ability to:
- Buy back undervalued shares or increase dividends to reward shareholders.
- Make strategic acquisitions when opportunities arise
- Navigate economic downturns without needing outside financing
- Use cash reserves as buying power during crises when assets are cheaper
A key insight into FCF is distinguishing between two types of CapEx:
1. Maintenance CapEx: Spending to sustain current operations and safeguard sales by replacing equipment, upgrading systems, and servicing assets. Without it, sales would gradually decline over time.
2. Growth CapEx: Spending to expand capacity and drive higher sales by opening new facilities, launching products, or entering markets. Without it, growth stalls even though existing sales persist.
When growth slows (as we find today or companies reach a certain size) – the type of CapEx matters:
- Companies with high maintenance needs (e.g., oil companies) won"t see much FCF improvement since they must keep investing heavily just to maintain existing sales.
- Companies with low maintenance needs (e.g., software companies) will experience substantial FCF increases when growth investments stop.
Managing FCF Volatility
For those less familiar – FCF can be "lumpy" pending the company"s capex cycle.
Consider a high quality company like Amazon….
Amazon spends massively on things like data centers (AWS expansion), warehouses (fulfillment centers), and transportation networks (air hubs, vans, etc.).
These projects are huge and irregular — so their capex swings dramatically from year to year.
As explained above – when they"re in a major investment phase (like 2020–2022), FCF looks bad even if their "core" business is doing well.
Their FCF also gets affected by inventory buildup or changes in accounts payable (especially around holidays like Q4).
They often collect cash from customers before they pay suppliers — but depending on timing, this can cause big quarterly moves.
It"s important to understand that FCF is typically more volatile than net income because:
- Income statements use accrual accounting (matching sales with related costs), while cash flows reflect actual timing of money movements.
- Capital expenditures are naturally "lumpy" compared to the smooth depreciation expense on income statements.
To handle this volatility, investors should average free cash flows over 10-years rather than focusing on any "one or two" years results.
Another approach is using depreciation as a general indicator of CapEx patterns:
- High-growth companies: CapEx > Depreciation (spending heavily on new assets to fuel growth).
- Maturing companies: CapEx ≈ Depreciation (replacing assets at roughly the same rate they"re wearing out).
- Mature companies: CapEx < Depreciation (fully build-out companies that need less new investment).
Depreciation reflects past investments while CapEx shows current spending.
This relationship changes predictably through a company"s lifecycle, offering a simple growth stage indicator.
The last thing to mention is watching how companies use their FCF, as poor decisions can destroy value (note: I will talk to return on invested capital shortly)
For instance, while some acquisitions create shareholder value, many serve to build "bigger" (not better) corporate empires. Again, be careful of "growth for growth"s sake"
More companies will die as a result of indigestion vs starvation.
In other words, more often they are better off not trying to grow through acquisition.
High Return on Capital (ROIC)
ROIC measures how efficiently a company uses money invested in the business:
Return on Capital = Operating Profit / Invested Capital
This ratio shows how many dollars of profit a company generates for each dollar invested.
Going back to our table summarize Buffett"s Top 9 stocks (repeated below) – his investments average an ROIC of 13.2% vs the S&P 500 ~12%
Note: Banks typically are not measured on ROIC basis.
When a company"s return significantly exceeds its cost of capital, it signals the ability to create substantial shareholder value.
For me personally, high ROIC is an essential ingredient for earnings growth formula, alongside growth opportunities.
Here I will target companies who generated at least 15% on average over the past 10 years.
If companies are generate returns of 15%+ consistently – it gives the ability to expand using internally generated funds rather than outside financing.
That"s critical in a difficult environment. For example, they can:
- Grow faster than competitors using the same amount of reinvested profits.
- They avoid diluting existing shareholders by issuing new stock.
- They reduce risk by avoiding additional debt and interest expenses.
- They maintain independence from capital markets
For example, a company generating 20% return on capital can grow twice as fast as a competitor earning 10% while reinvesting the same amount of profits.
Alternatively, it could match the competitor"s growth while paying half its earnings as dividends.
Consistently high returns typically signal the presence of a sustainable competitive advantage.
Without such protection, high returns would attract competitors who would drive down prices and profit margins (as discussed previously).
Companies maintaining high returns over time usually have established moats protecting them from competitive forces, creating a virtuous cycle of internal financing and sustained profitability.
Putting it All Together
Regular readers will have heard me stress the importance of investing in high quality companies for many years.
This post serves as a timeless checklist for finding quality.
You could read this post again in 20+ years or more – and it will be just as relevant:
- Consistent Operating History (10+ years)
- Sustainable Durable Advantage (Consistent NIM"s > 15%)
- Competent Trustworthy Management with a Long-Term View
- Strong Financial Metrics (High FCF, High ROIC and Low Net Debt/EBITDA)
In closing, it"s my (strong) thesis we"re now entering either:
- Initial stages of a range-bound market (single digit returns); or worse
- A bear market opposite the growing risk of recession
If either of these assumptions is true (and they may not be) – the case for investing in high quality will make a meaningful difference to your overall returns.
I would recommend creating a table of your own investments with each of the metrics discussed above.
For example, for each company record their 10-year average:
- Net Interest Margins (as a measure of their competitive moat)
- Free Cash Flow and
- Return on Invested Capital
Also assess their balance sheet strength (e.g., Net Debt / EBITDA ratio); and if they have debt – can it be paid back by exclusively from free cash flow in 3 years or less?
The work you do now will serve you well over the coming few years.