The Debasement Paradox: Why $4,000 Gold and 4% Treasuries Can’t Both Be Right
Words: 2,453 Time: 12 Minutes
- Gold is up ~50% this year – time to take some profit?
- Mag 7 Q3 earnings need to jump a very high bar
- At 24x forward earnings – is the S&P 500 "priced to perfection"?
It"s been a few weeks since I"ve put (digital) pen to paper….
I"ve been taking some time to work on a few personal projects now that I"ve departed Google.
Looking back at my missives from earlier this month – it appears not a lot has changed.
Apart from some noise around the government shutdown, US trade tensions and rampant speculation in AI stocks – I observed:
- The S&P 500 trades around 24x next year"s expected earnings;
- Consumer price inflation remains stubborn around 3.0% – well above the Fed"s 2.0% objective; and
- US 10-Year bonds have found support around the 4.0% zone
What has changed is stocks have become more expensive.
The multiple is now approx one turn higher (i.e., from 23x to 24x) – which suggests investors maintain an optimistic lens (note: one turn is equal to around 280 points; ie the expected EPS value for next year)
And it makes some sense…
At this stage of the third quarter earnings season – most companies are beating expectations.
Factset reported that 87% of S&P 500 companies have posted positive earning surprises.
If this holds, it will be the strongest level of upside surprises since 2021. It will also mean nine straight quarters of earnings growth.
With respect to inflation, consumer prices rose 0.3% in September, which drove the annual rate of inflation from 2.9% to 3%, the highest it"s been since January, according to Bureau of Labor Statistics.
But despite the uptick – investors saw this as not as hot as feared (given the tariff uncertainty) – sending stocks sharply higher.
Outside the gains in equities – it"s worth observing the sharp pull back in gold prices.
Gold started the year at $2,654 an ounce – coming off a 30% gain in 2024.
For 2025 – it"s handily beaten the S&P 500 – up ~55% year to date (at $4,126)
However, recently gold plunged about 8.5% – dropping from a record high of $4,397 to a low of $4,021 during the week (before catching a bid).
So why the move lower? Is the gold rush over? Let"s take a look…
The Gold Rush of 2025
Over the past 100-years – gold has averaged a compound annual growth rate (CAGR) of 5.98%
Quite remarkable for an asset which doesn"t generate any cash.
I say this because determining the fundamental "value" for gold is very difficult – it"s simply what someone else is willing to pay for it (not unlike art or a collectible car).
And today that figure is above US$4,000 per ounce.
Consider this:
- In 1925 – the price of gold was fixed under the gold standard at approximately $20.67 per ounce;
- In 2025 – the price is now ~$4,126 per ounce – equating to a CAGR of 5.98%
Gold"s CAGR is ~0.5% higher than the average yield on the 10-year treasury over the past 50+ years (~5.50%)
But given gold"s role as a hedge against currency debasement (or monetary expansion) – this chart is one I pay close attention to:
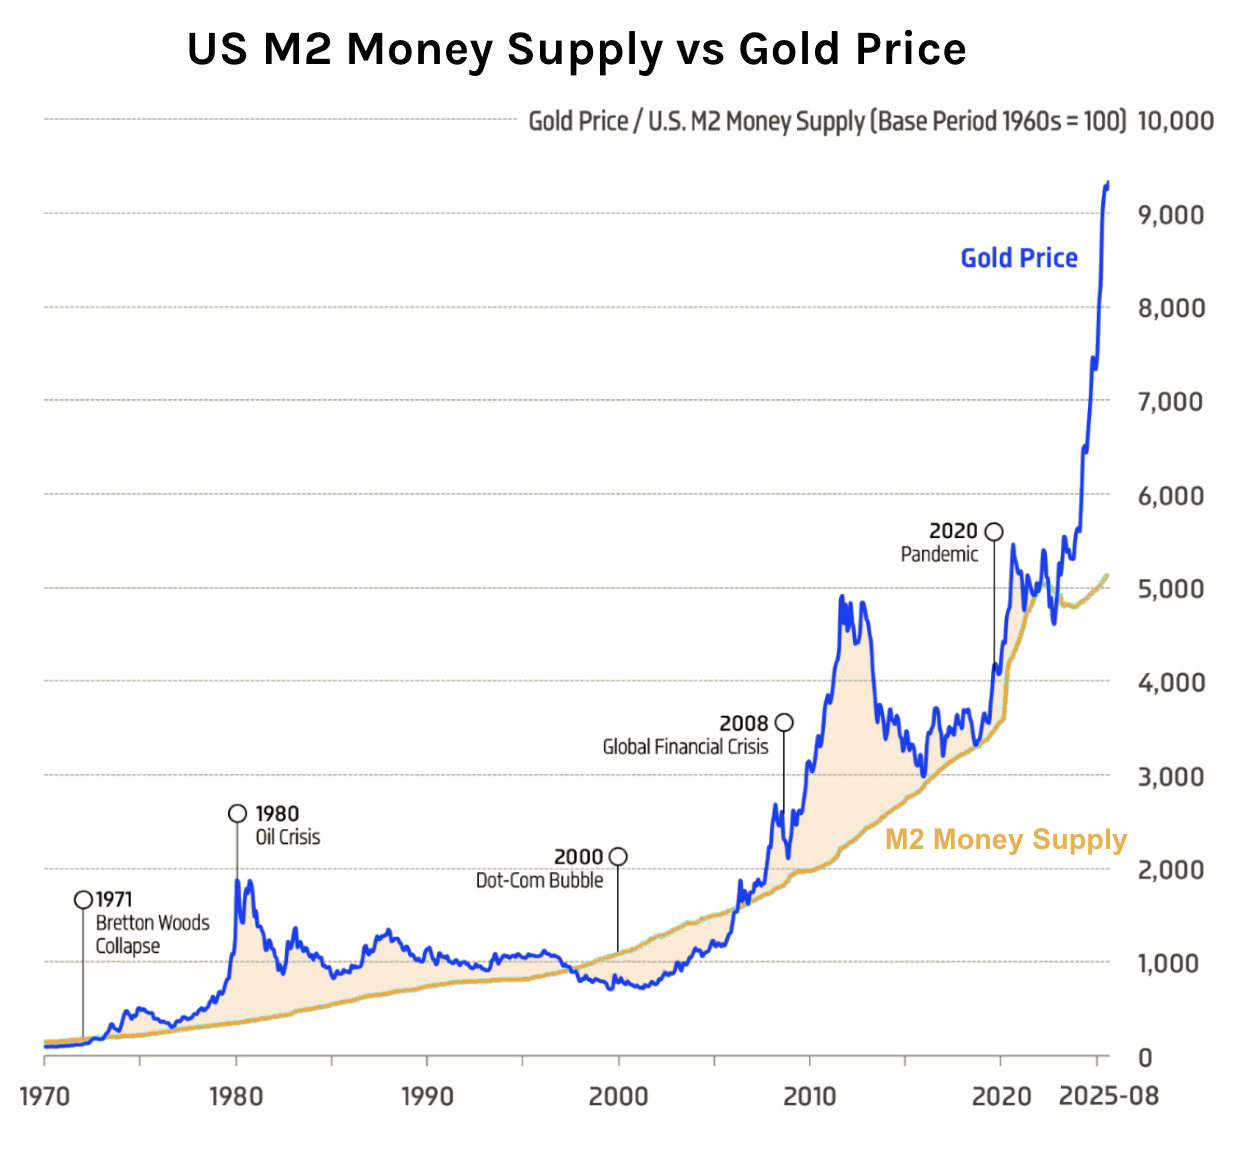
Directionally, gold will typically follow the path (and trajectory) of money creation.
Given the US typically increases the money supply (M2) every year (by about 6%) – it stands that gold will rise along with it over time.
However, unlike money creation, the path of gold"s trajectory is far from uniform.
For example, we can observe long periods where it trades both above and below the rate of money supply growth.
During the late 90s and early 2000"s – gold was an excellent buy – as it fell below the M2 growth rate.
However, during 1980 and 2011, when markets were either panicked or spooked by credit downgrades, gold soared.
But in each case, the price reverted to the mean.
What"s important is to know where gold trades relative to money supply growth.
From mine, that"s one of the better proxies to estimate whether there is opportunity.
Today we find ourselves in another 2011 situation (vs 1980) – where fears of currency debasement are sending the price sharply higher.
It"s now ~60% above the 2013–2022 average relative to M2.
Other drivers such as inflation concerns, geopolitical risks and stronger investment demand are all combining to drive the price higher.
Let"s start with a look at the monthly chart – and the ascent we"ve seen recently:
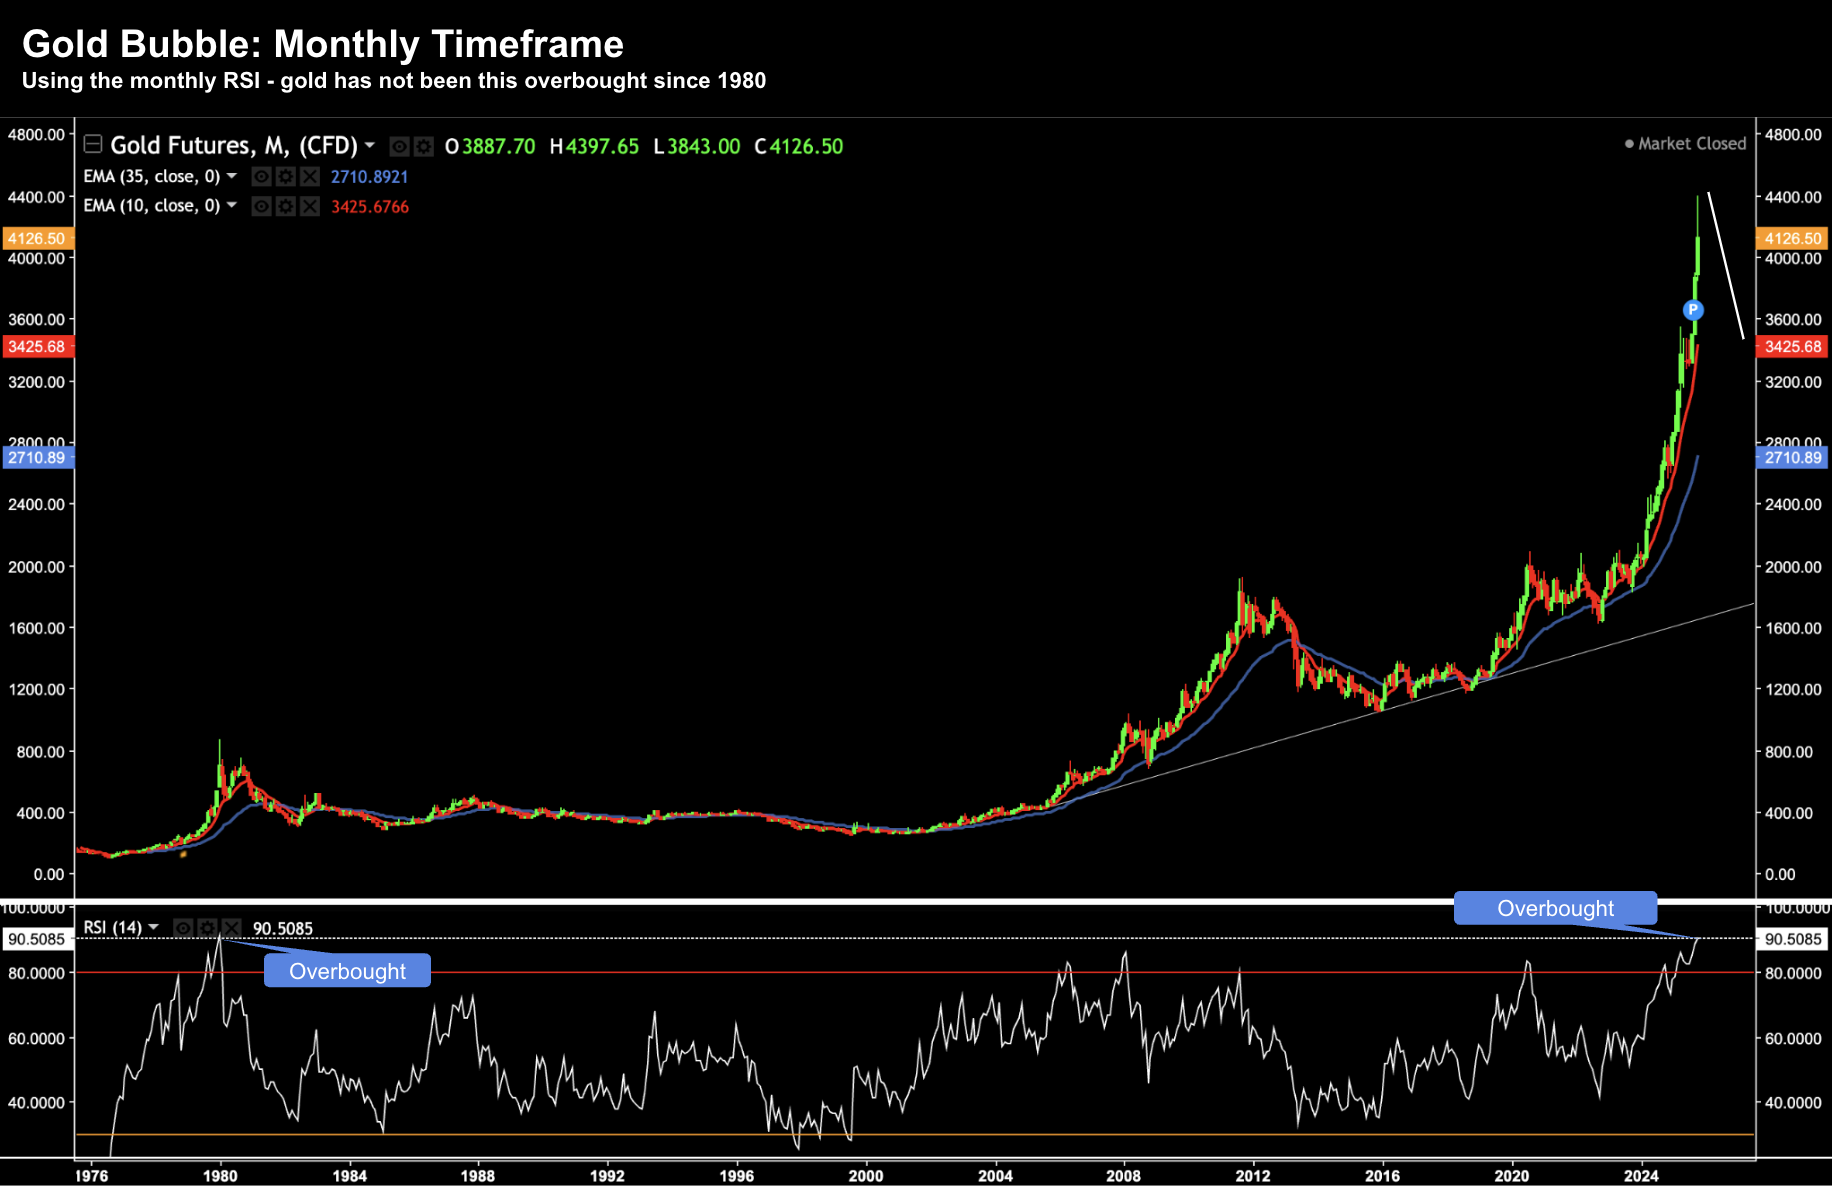
October 25 2025
As I say, my take is the sharp move higher is a bet against the fiscal recklessness of the US government.
The bet is inflation and (ultra) loose monetary policy will erode the real value of fiat currency.
Again, this is nothing new…
For example, since Nixon ended the dollar"s gold convertibility in 1971, investors have periodically sought refuge in gold whenever they feared that money-printing and deficit spending might dilute their savings.
Similar to the fear (and greed) which drives stock prices – what we see in gold is no different.
But here"s the thing:
Despite the US Dollar losing value this year – curiously, U.S. Treasury yields remain subdued around 4.0%.
Put another way, if investors were really concerned the US dollar was worth the value of "confetti" – then why aren"t yields closer to 5.0% or 6.0%?
When investors dump US Treasuries – it sends their yields higher.
On the other hand, when investors buy US Treasuries, it drives their yields lower.
It would be reasonable to assume an investor would only buy US Treasuries if they had faith in both the US dollar and their government paying you back (which people clearly do with the US 10-year at just 4.0%)
For now, there is a curious contradiction.
On the one hand – gold investors are pouring into the precious metal on the basis of extreme currency debasement (and perhaps growth fears and geopolitical risks).
But on the other hand, they continue to buy Treasuries (i.e., showing a level of faith in the US dollar).
For now, gold thrives in such contradictions, serving as both a hedge against inflation and a vote of no confidence in central banks.
What Can We Learn from History?
As I touched on earlier, the gold booms of 1980 and 2011 were born of panic.
In the late 1970s – we had inflation and geopolitical chaos.
Inflation was in the realm of almost 20% per year – sending interest rates soaring.
However, once inflation was brought back under control through very aggressive monetary policy (i.e. raising interest rates) – gold prices eased.
In August 2011 – we did not have an inflation scare – however there was a U.S. credit downgrade.
Standard & Poor"s – one of the "Big Three" credit rating agencies – lowered the long-term sovereign credit rating of the United States government from its top rating of AAA to AA+.
This sent gold prices soaring again…
Today"s rally resembles 2011 more than 1980 (especially with inflation only around 3.0% year over year)
It"s fueled less by crisis than by unease.
Investors are extremely anxious about the actions of both government and central banks (and with good reason).
Here"s a chart I"ve shared many times over the past 14 years.
It shows the rampant acceleration in public debt (CAGR of 8.25% since 2008) vs Real GDP (or output) – CAGR of just 2.01%
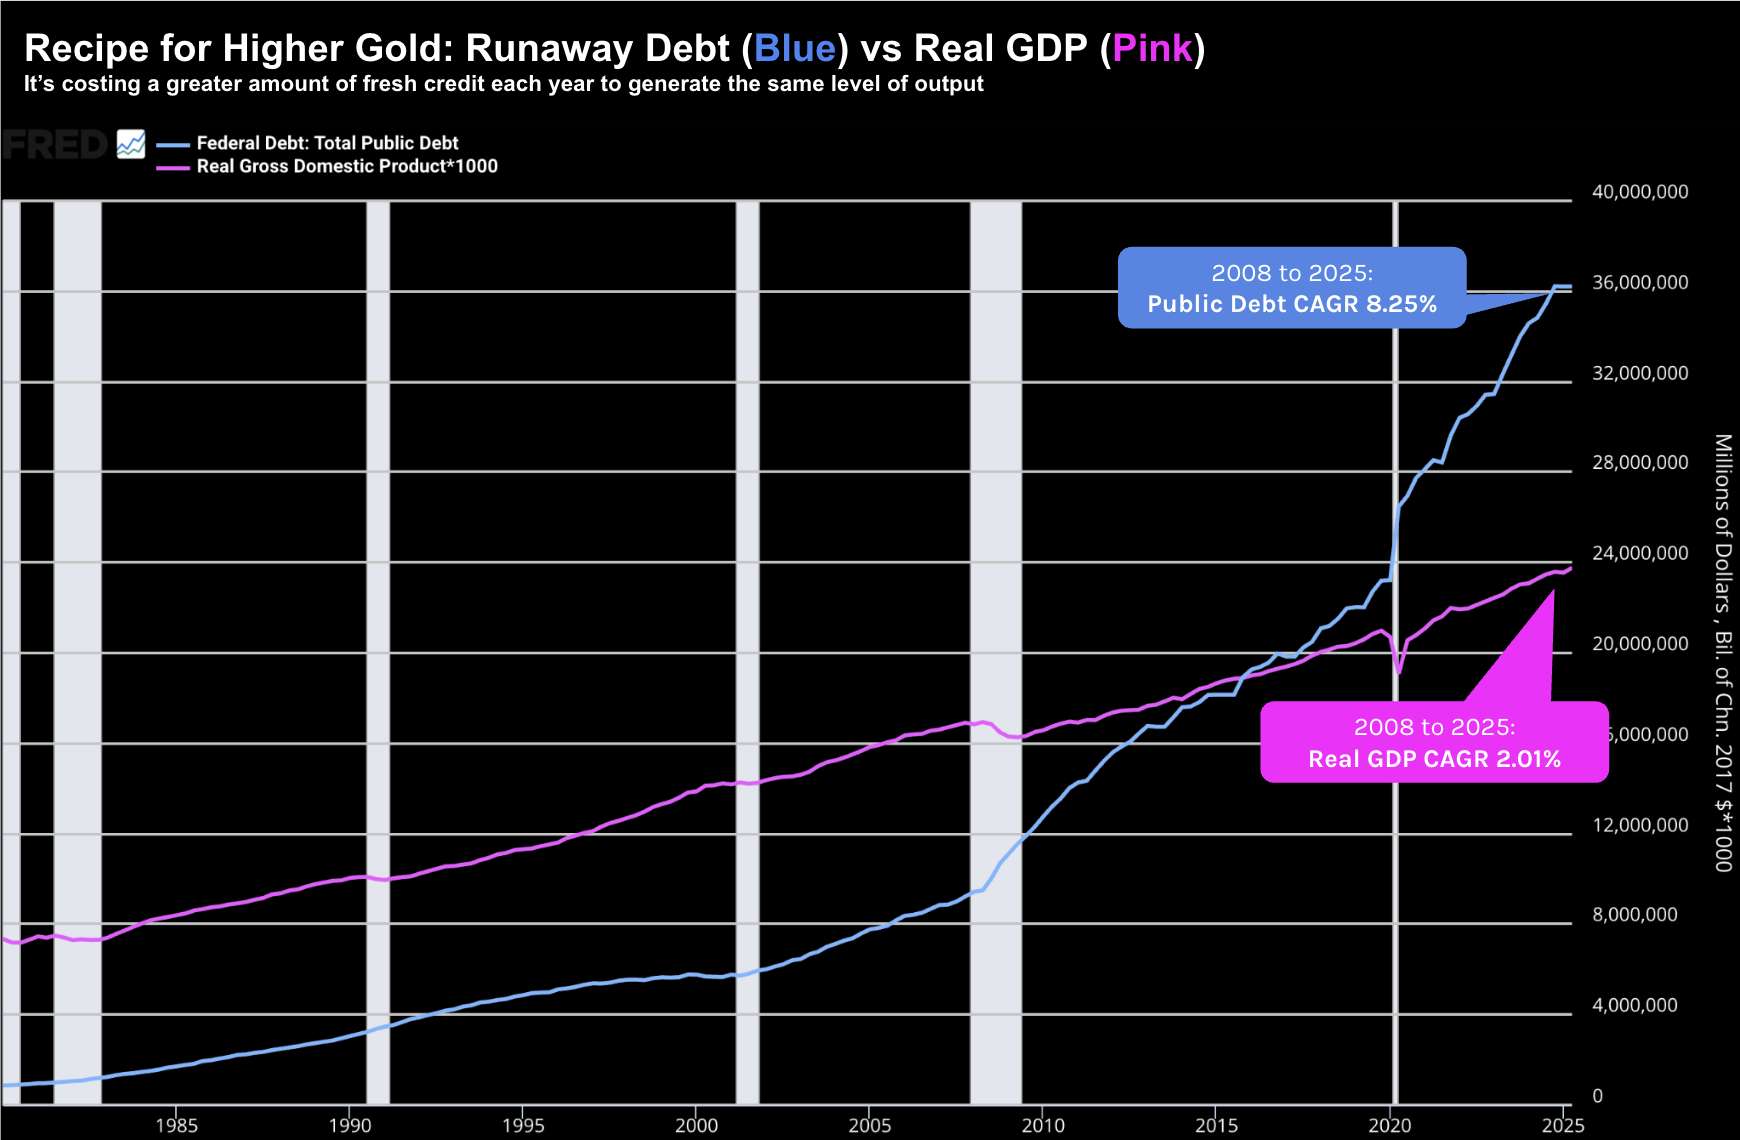
October 25 2025
Do you think this trend is sustainable? You tell me….
With public debt travelling at a CAGR of over 8% the past ~20 years – it"s little wonder gold has accelerated.
As I like to say – this is nothing more than greater debt "posing" as growth.
So Who"s Buying?
Whilst data shows foreign central banks have been quietly reducing U.S. Treasury holdings – they"ve also been doing at a pace slow enough not to send yields sharply higher.
For example, they"re mindful not to crash the bond market — as this would also see material losses on their own balance sheet (i.e., the treasury holdings would be worth less).
However, as they offload US bond holdings – some of that money is finding its way into the "hard" currency like gold.
For example for the first time in 30 years – central banks now hold more gold than US treasuries.
Now if we revert to my chart earlier – it"s no coincidence we see the same shift from central banks not longer after 2008:
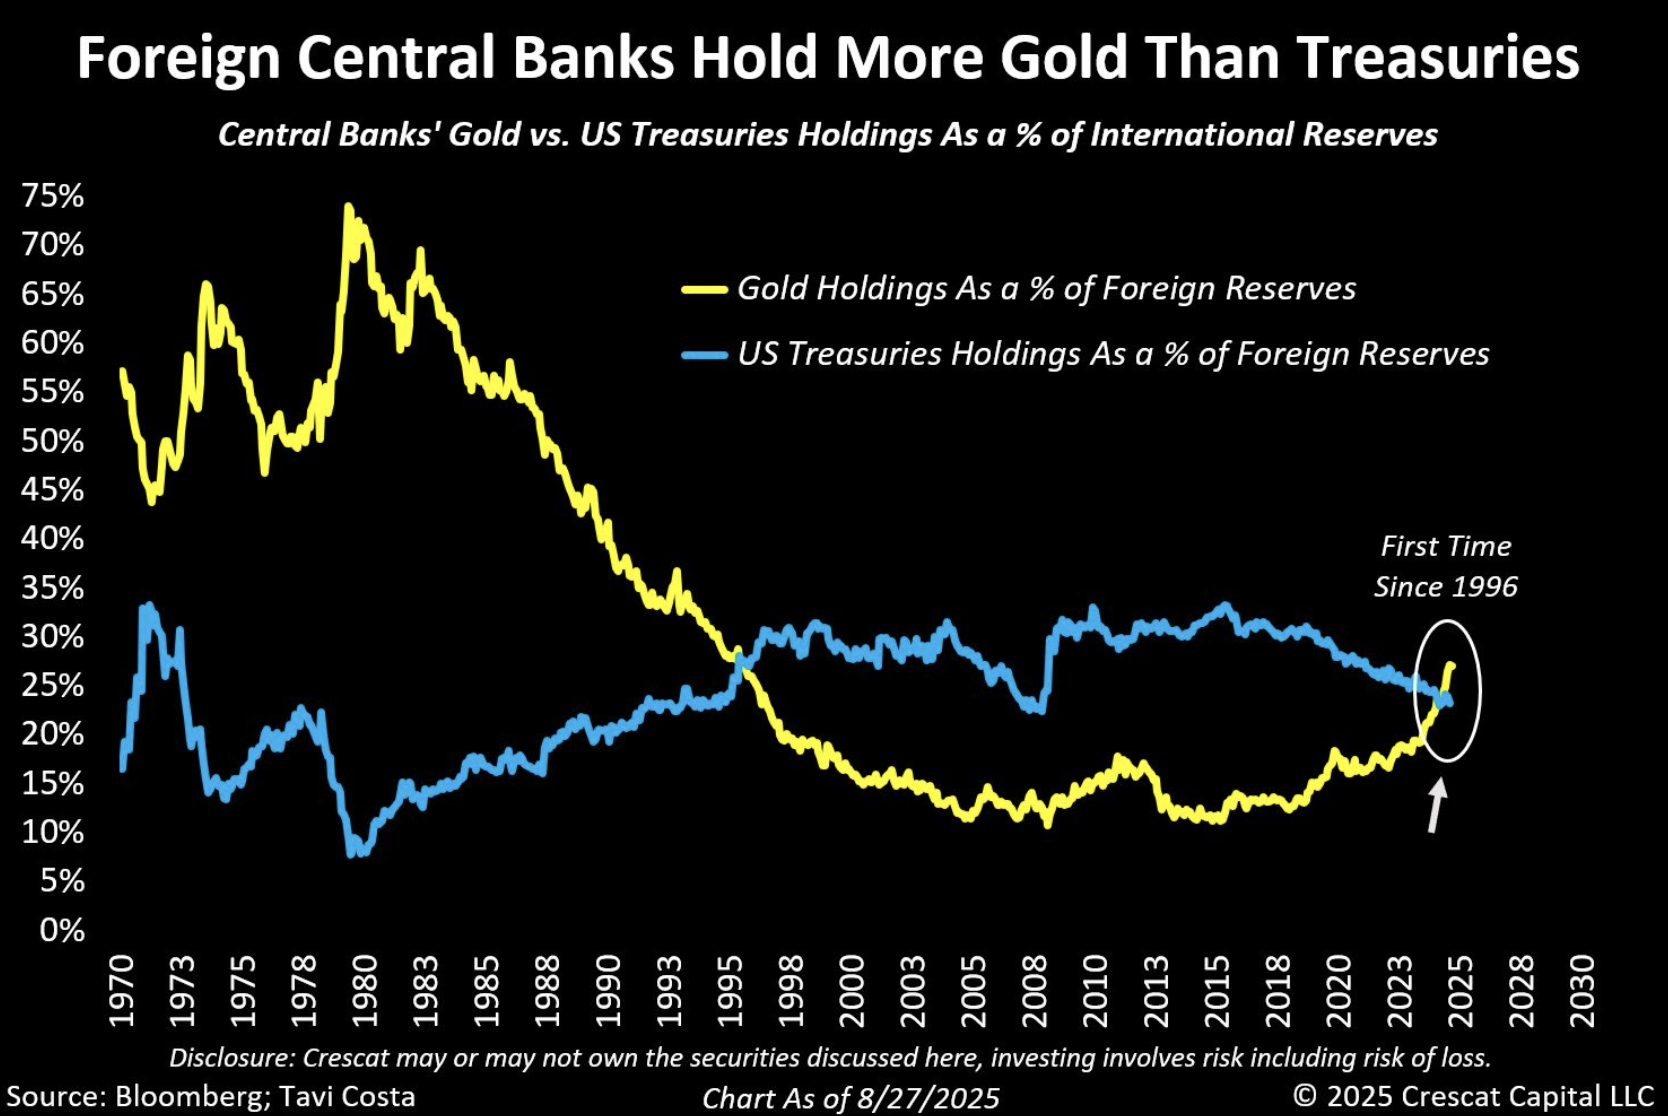
In summary, I think we should pay close attention to the blue line (US Treasuries).
For example, if this line continues to drift lower (which I expect) – it follows yields will continue to rise.
And given the sheer magnitude of debt now in the system (both private and public) – the world is not ready for a US 10-year back above 5.5%
Put another way – a gold price well above $4,000 won"t bother equity markets.
However, a US 10-Year yield above 5.5% could create panic.
S&P 500: Can the Mag 7 Carry it Forward?
If we choose to define the birth of the new bull after the 20% decline in 2022 – it"s now 3 years old.
However, the gains of those 3 years have not been evenly shared.
Consider this breakdown from Bloomberg:
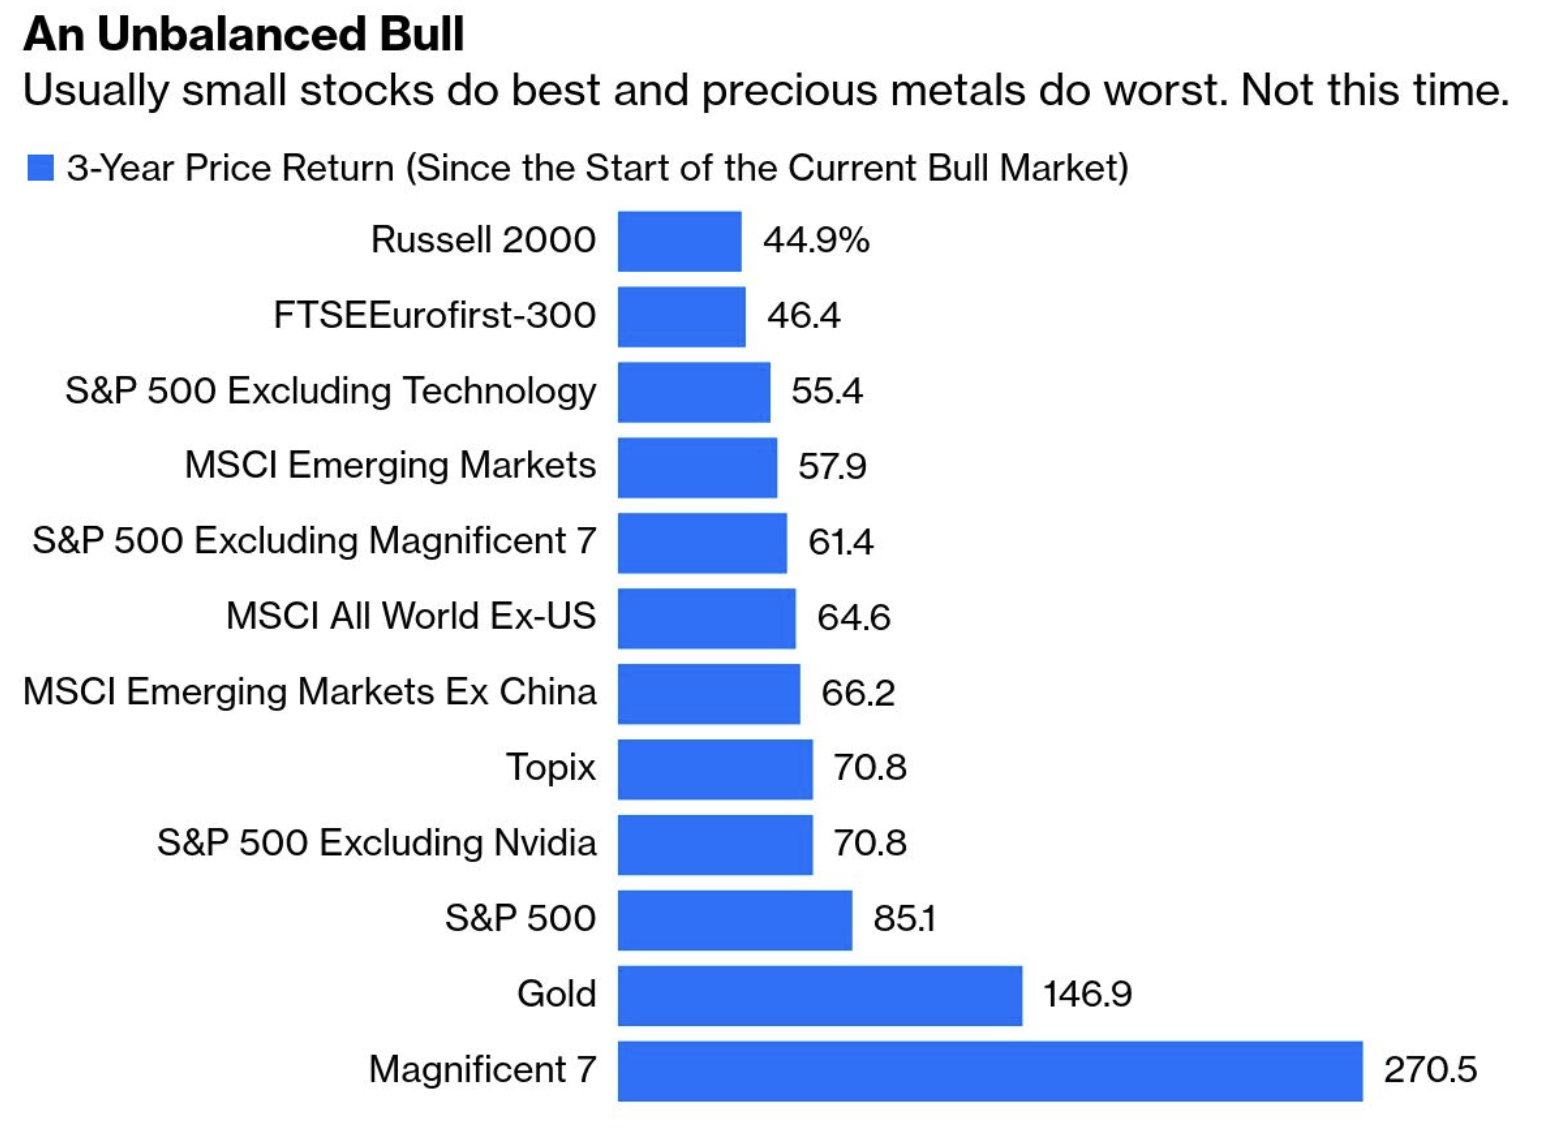
The gains in Mag 7 (Apple, Microsoft, Google, Amazon, Meta, NVDA and Tesla) have been 270.5% (i.e., an average CAGR of ~ 55%)
Gold has gained an impressive 147% (i.e., a CAGR of 35.2% over the 3 years)
However, the broader S&P 500 has "only" gained about 85% over 3 years (CAGR of ~23%)
But if we remove the Mag 7 and look at the gains for the other 493 stocks – those gains are just 61% over 3 years (CAGR of 17%)
Not surprisingly, these seven "magnificent" stocks comprise a staggering 35% of the total S&P 500 market capitalization.
Therefore, if you"re buying the Index on the basis of adequate diversification – you"re not getting it.
The market is a heavily concentrated bet on just seven names (all of which are extended in terms of their valuations)
Moving on…..
With the S&P 500 ~6300 approximately eight weeks ago – I mentioned it could easily test 7,000 this year.
That bet now looks like a near certainty – just 3% away.
I doubt very few predicted the S&P 500 would gain ~40% in just 6 months. Again, hat tip to the Mag 7.
Despite the higher highs… the relative strength index (RSI – lower window) warns these levels may not be sustained:
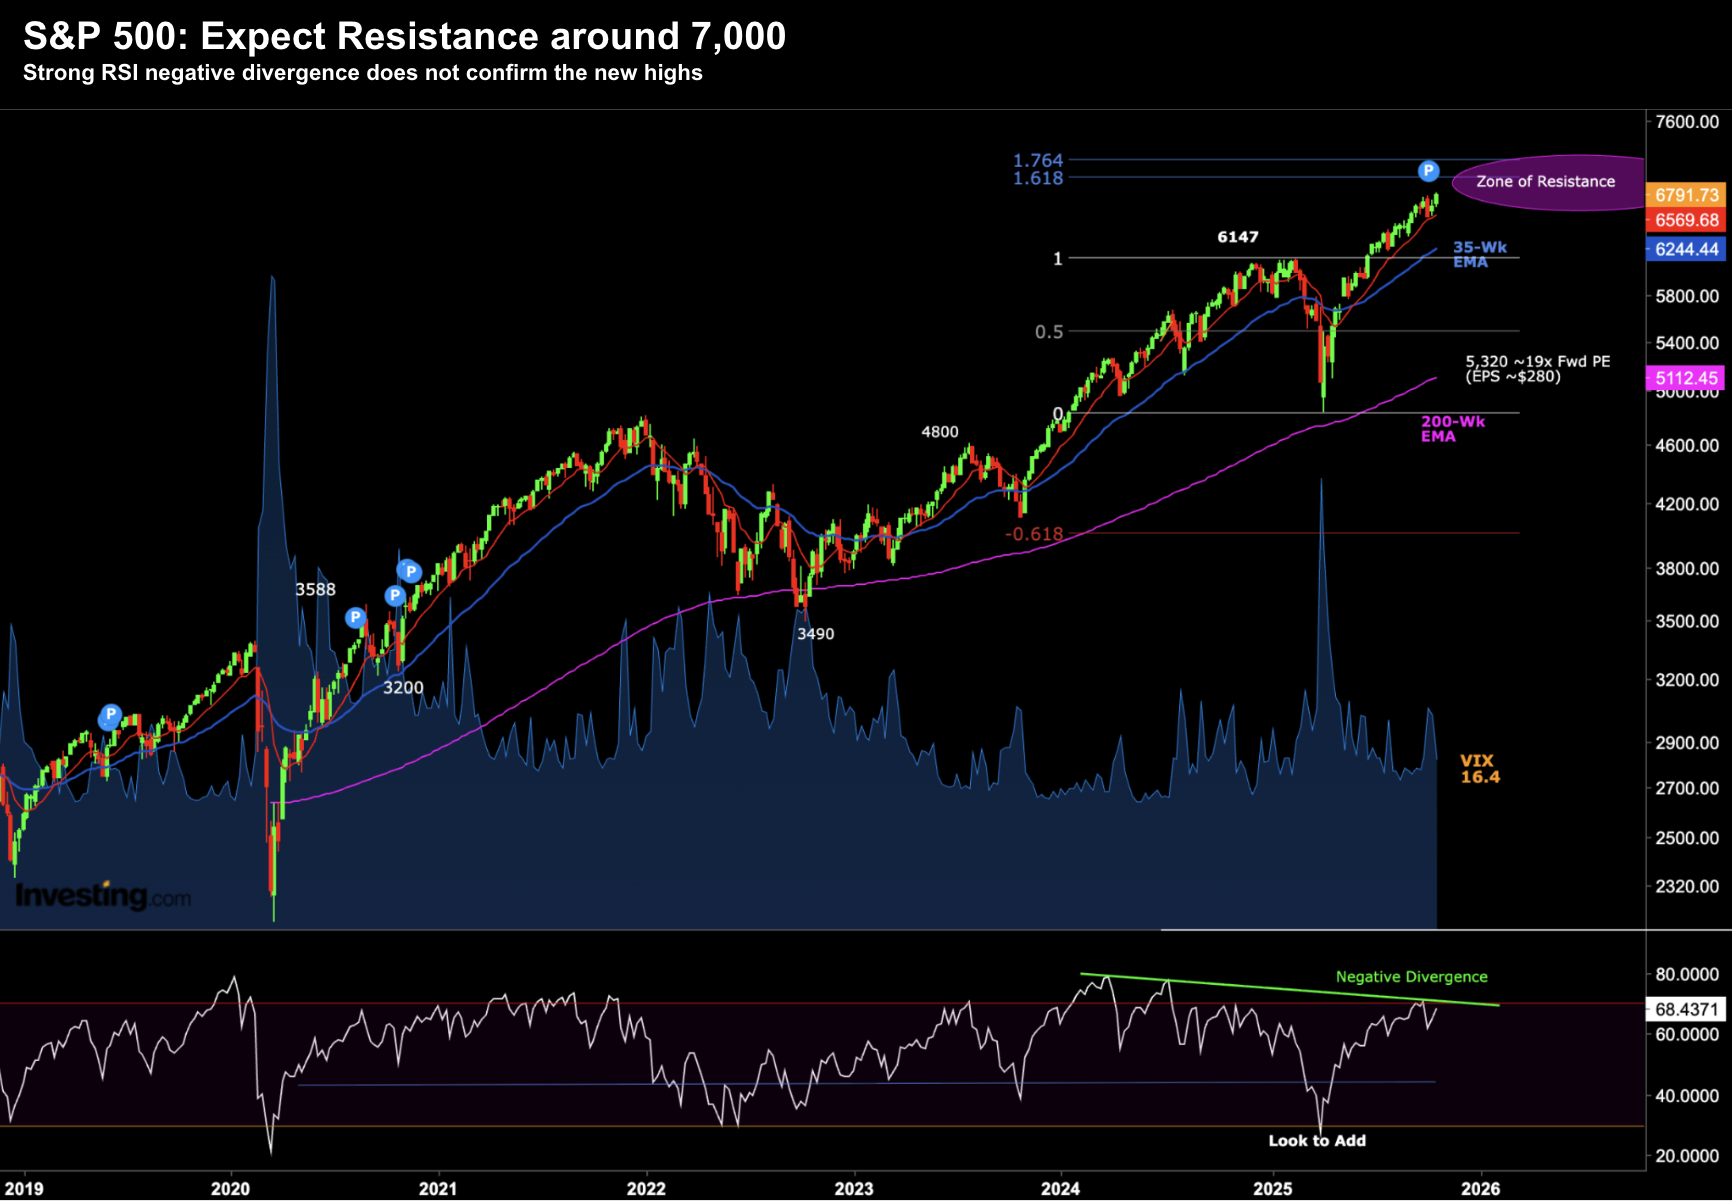
October 25 2025
For those less familiar – ideally the RSI will make new highs together with the price action.
However, as our green line shows in the lower window, each peak in the price has seen a lower peak with the RSI. We call this negative divergence. From investopedia:
Negative divergence, or bearish divergence, occurs when prices create higher highs, but the momentum indicator shows lower highs. This signals a reduction in bullish momentum, suggesting that prices may reverse downward
We saw something similar heading into 2022.
As the S&P 500 made new highs in 2021 – the RSI momentum indicator failed to.
However, it should also be noted the divergence signals are poor timing tools. The market could easily add another "10%" from here despite the (negative) signal.
From mine, my bigger concern is what we see with valuations and fundamentals.
That is, the high price investors are being asked to pay for quality assets.
Investors are not getting value at ~24x next year"s earnings (and much higher for the Mag 7 names)
What"s more, that multiplier could be higher if earnings do not generate at least 12% growth year on year.
From mine, a lot rests on what we hear from the Mag 7 over the next two weeks.
And specifically – are they seeing any strong signs of returns on the massive amounts of capex invested into AI (which has significant depleted their robust cash reserves)?
Case in point:
I was looking at Price to Free Cash Flow (P/FCF) ratios for a few of the Mag 7 this week.
Think of FCF as the "money left over" a company has after paying all the day-to-day costs of running the business and paying for all the necessary investments (e.g. new equipment, buildings, or software) required to keep the business operating and growing
First, let me share the 10-year average P/FCF ratios for each of Google (GOOG), Microsoft (MSFT) and Amazon (AMZN):
- GOOG – 28.0x
- MSFT – 28.1x
- AMZN – 59.5x
In short, this tells me how much you are paying for every dollar of a company"s available cash.
As Warren Buffett would suggest – it is one of the clearest ways to judge a stock"s value because it compares a company"s stock price (what you pay) to the actual cash profit it generates (what you get).
Multiples of 28x or more are very high – however if the company is growing its cash quickly – it can be justified (as long as they keep growing).
But let"s now compare what P/FCF you are paying today for these three names:
- GOOG – 46.1x
- MSFT – 54.0x
- AMZN – 174.4x
This is an extreme multiple to pay.
Now if we invert these ratios – we get what"s called the cash flow yield. It shows you the rate of return in cash you are getting for the stock price you pay.
- GOOG – 2.17%
- MSFT – 1.85%
- AMZN – 0.57%
In plain english – when you invest $100 in say AMZN with a cash flow yield of 0.57% — you"re getting $0.57 in FCF generated by the company over the last year.
That"s something which concerns me… despite the cash-flows AI is "expected" to deliver these companies.
Putting It All Together
It"s a strange year when gold tops the returns of equities in the absence of a sharp economic contraction.
My thinking is the (sharp) rise in gold is largely centred on currency debasement fear.
I could be wrong – but it feels like (some) investors are turning to gold as protection against the perceived (ongoing) erosion of fiat currency value — a narrative that remains powerful despite inflation around 3.0%.
The gold rally of the past two years reminds me of 2011 (not 1980) – when the US was first put on credit watch.
And whilst I don"t pretend to guess the timing of when the gold rally is over (that"s impossible to do) – the heightened volatility we are seeing (e.g., dropping 8.5% in a week) – suggests this could be close to the final phase.
It"s my view gold investors would be best to consider trimming positions (especially with the yellow metal still above $4,100).
To be clear, I would not exit the position entirely – but reduce your exposure if you"ve enjoyed these spectacular gains.
With respect to equities – valuations are too rich for my blood.
However, I maintain 65% long exposure (no short positions) – with my largest allocation still GOOG.
So far, I"ve been very fortunate to see the stock rally around 40% this year.
However, when the stock was trading about 16x its earnings earlier this year (after it pulled back to ~$155) – it felt like a good (long-term) risk reward bet. Today that multiple is ~28x.
GOOG, MSFT, META, AMZN and AAPL all report earnings next week.
The growth (and earnings) bar is now very high… question is whether they will clear it (again).