Market Volatility vs. True Panic: How to Use the VIX to Identify Peak Fear
Words: 1,020 Time: 5 Minutes
- Distinguishing between routine volatility and structural panic.
- The VIX Thresholds: Identifying the "35x" signal for real fear.
- The Inversion Test: How to fail (and how to avoid it) when markets dip.
Are markets panicking? The answer depends entirely on your investing timeframe. To a day trader, a 2% drop is a crisis. To a disciplined value investor, a 6% retreat from record highs is simply the market "trading per the script."
Understanding the difference between noise and signal is the hallmark of a seasoned investor. To find the signal, we look to the VIX (the "fear index") and the long-term technical structure of the S&P 500.
Technical Structure: Trading the Script
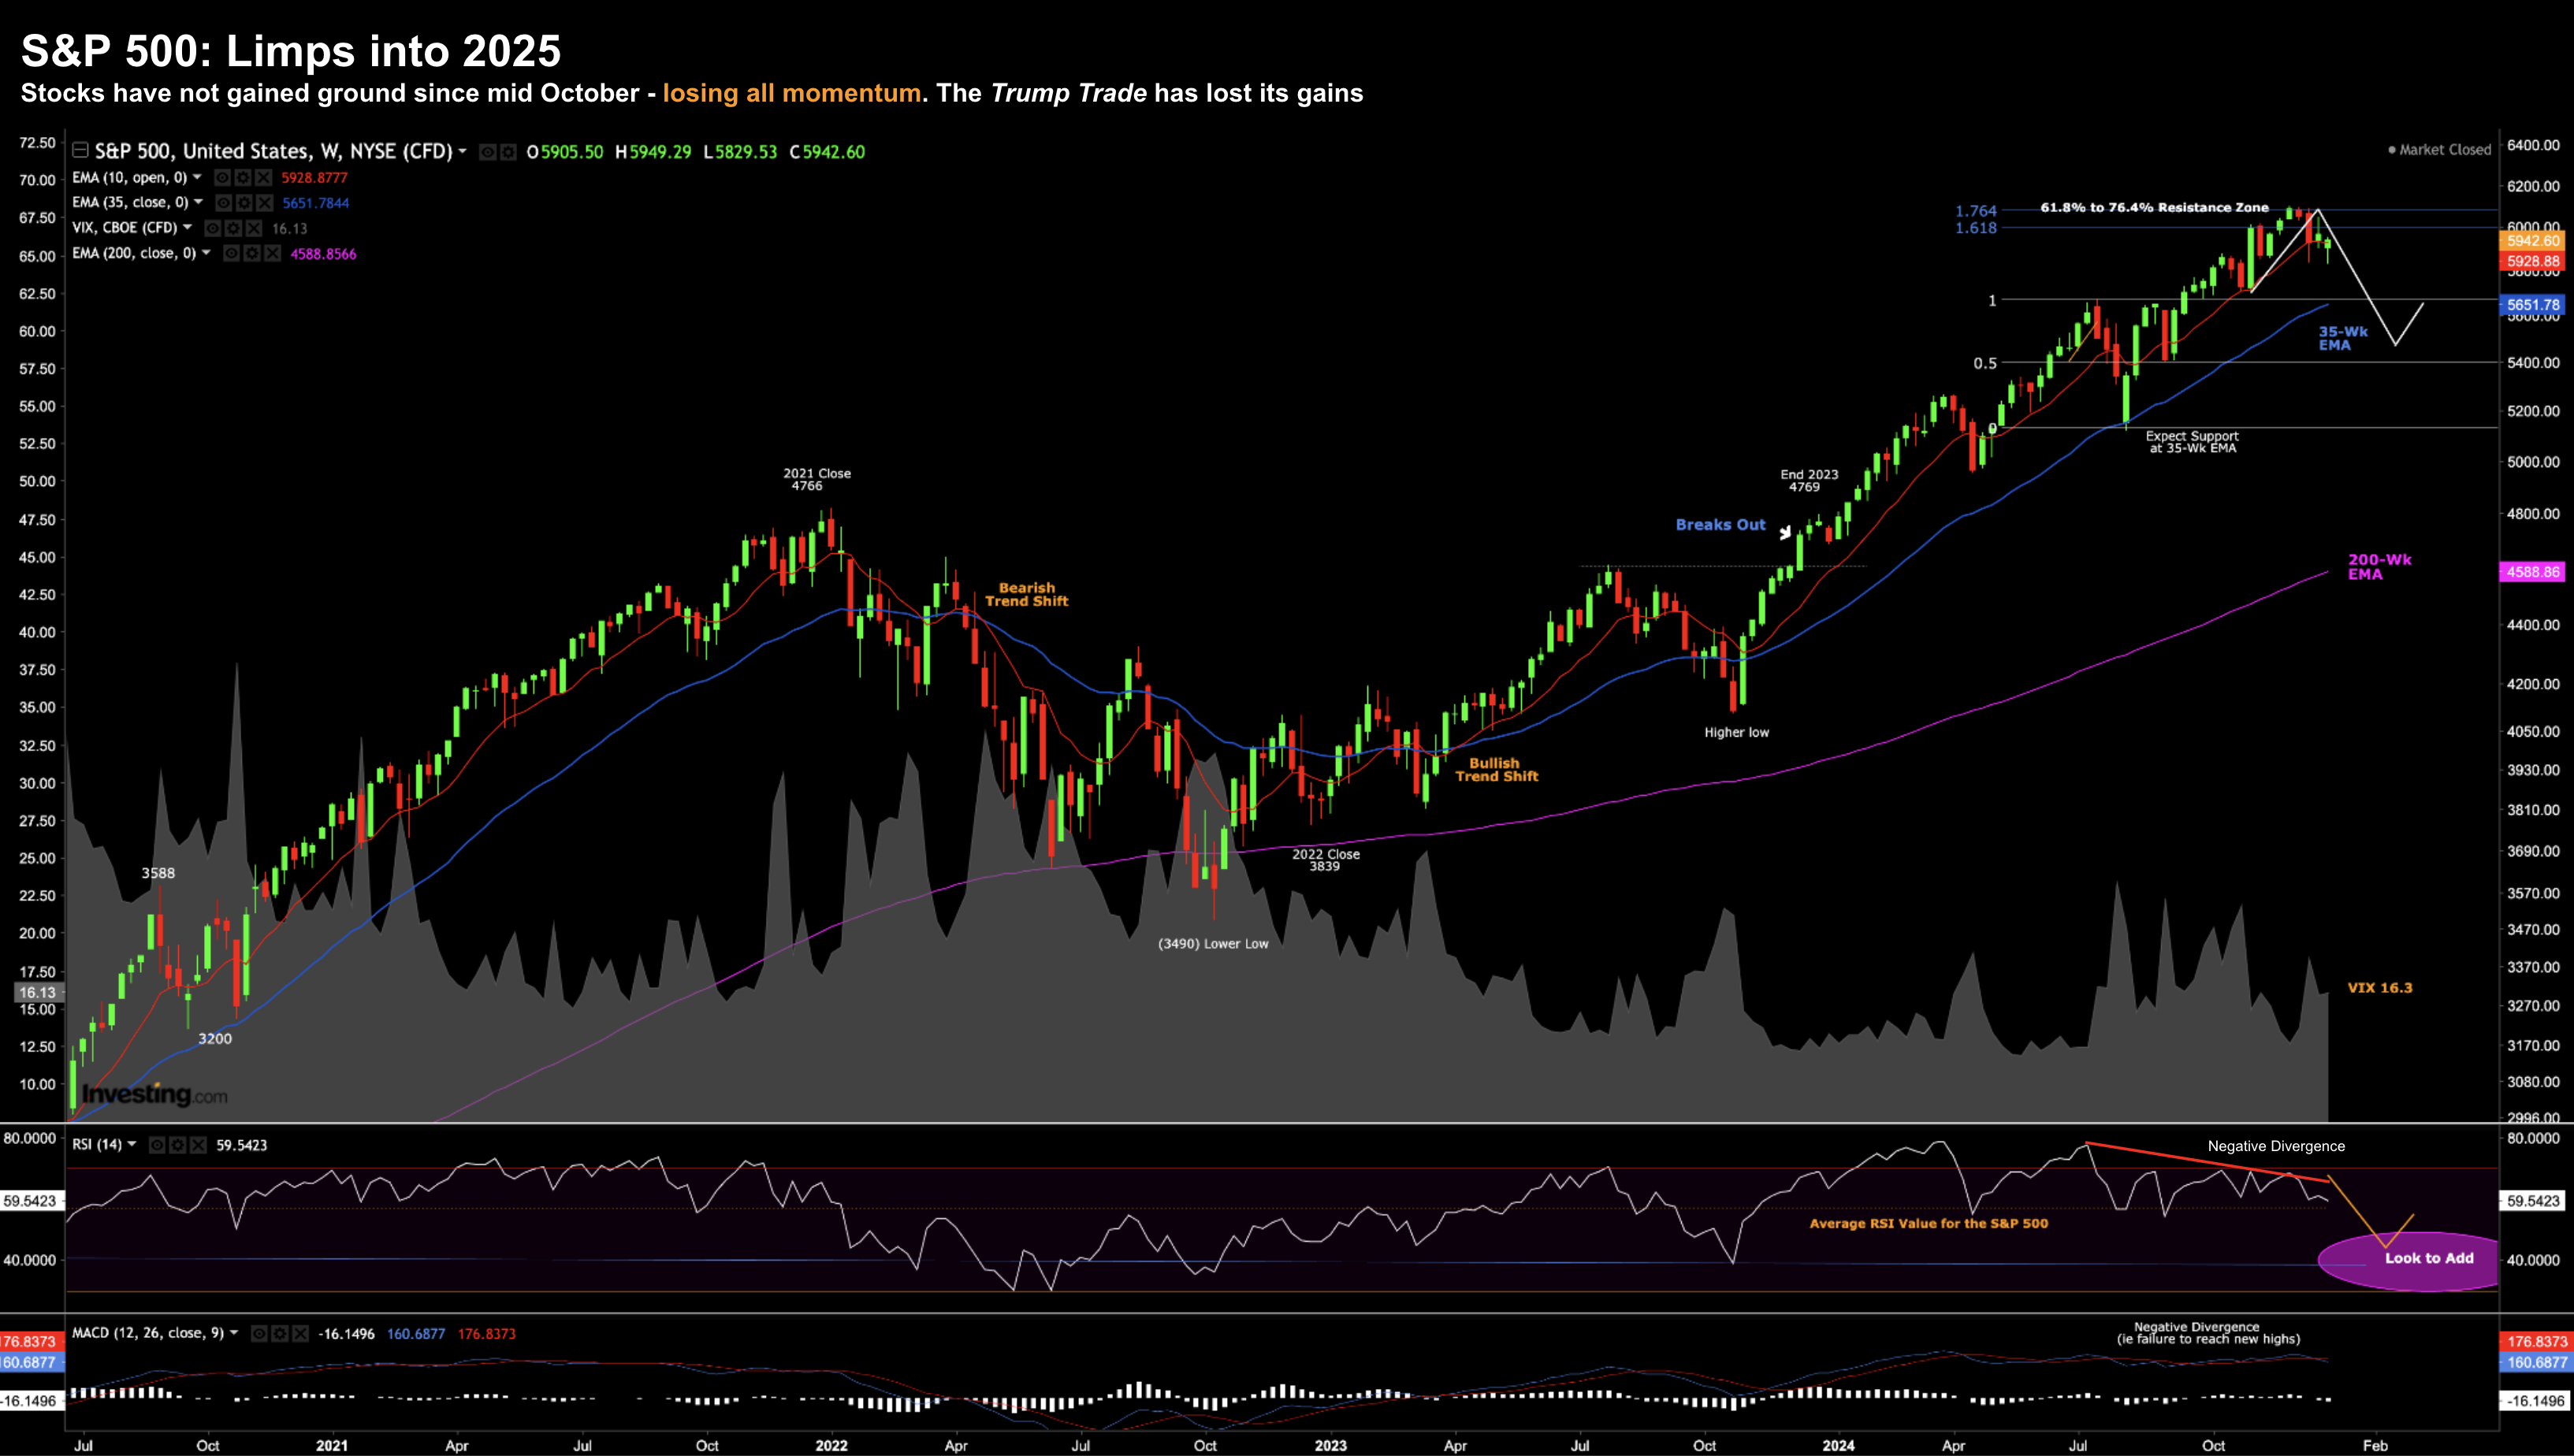
Markets rarely move in a straight line. Often, we see "negative divergence"—where prices remain high but momentum indicators like the weekly MACD or RSI begin to fade. Technicians view this as a red flag that prices are at risk of easing.
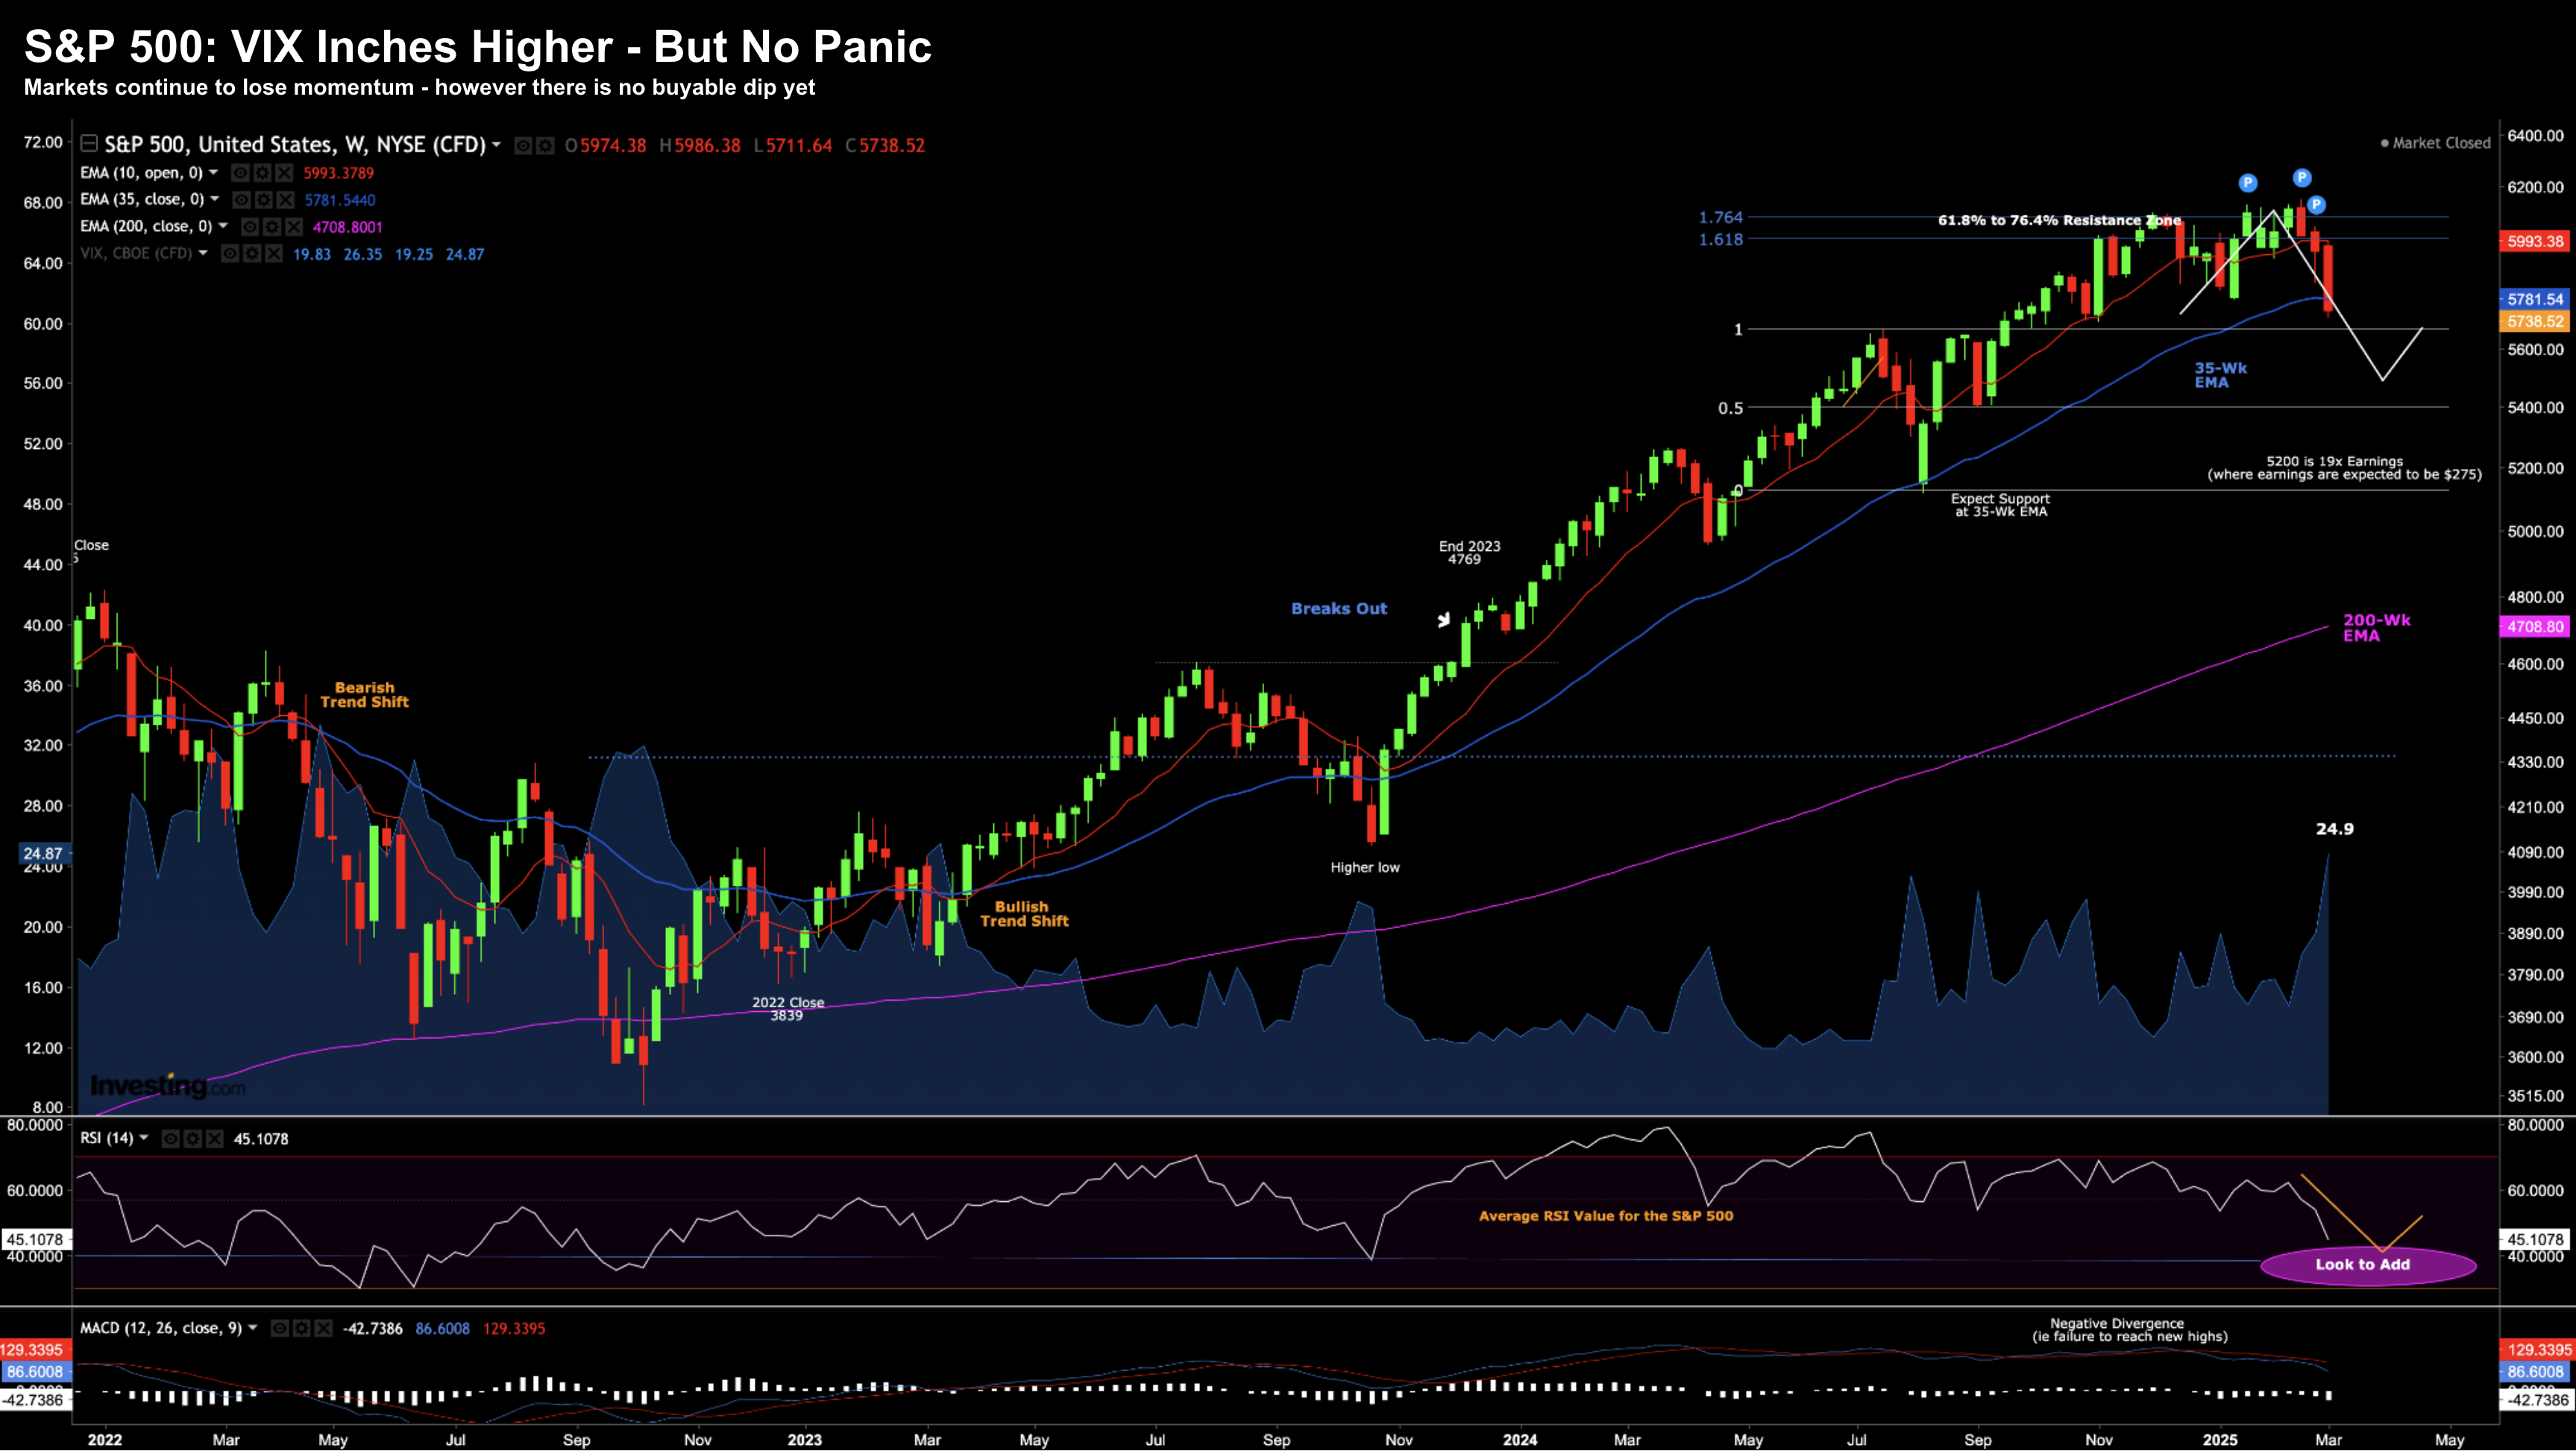
In a healthy bullish trend, it is common to see a move back toward the 35-week EMA zone (the blue line). As I have noted in previous analysis, these retreats—often between 5% and 10%—are arbitrary in the short term but essential for long-term health. The goal is not to be "too cute" with price targets, but to recognize when the risk-reward profile is shifting to the downside.
The Sentiment Cycle: When to Buy Peak Fear
Historical data shows that annual returns are significantly amplified over a 3-to-4-year horizon when capital is deployed during episodes of "peak fear." As I explored in my analysis on buying peak fear, the CAGR following a sentiment washout vastly exceeds standard index averages.
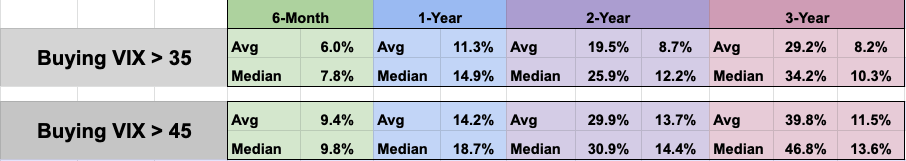
But how do we quantify "panic"? We use the VIX. Since 1995, there have been fewer than 10 instances where the VIX ripped above 45 (outright panic). However, it has crossed the 35x level more than 20 times. This is the "washout" zone—the moment when the baby is tossed out with the bathwater.
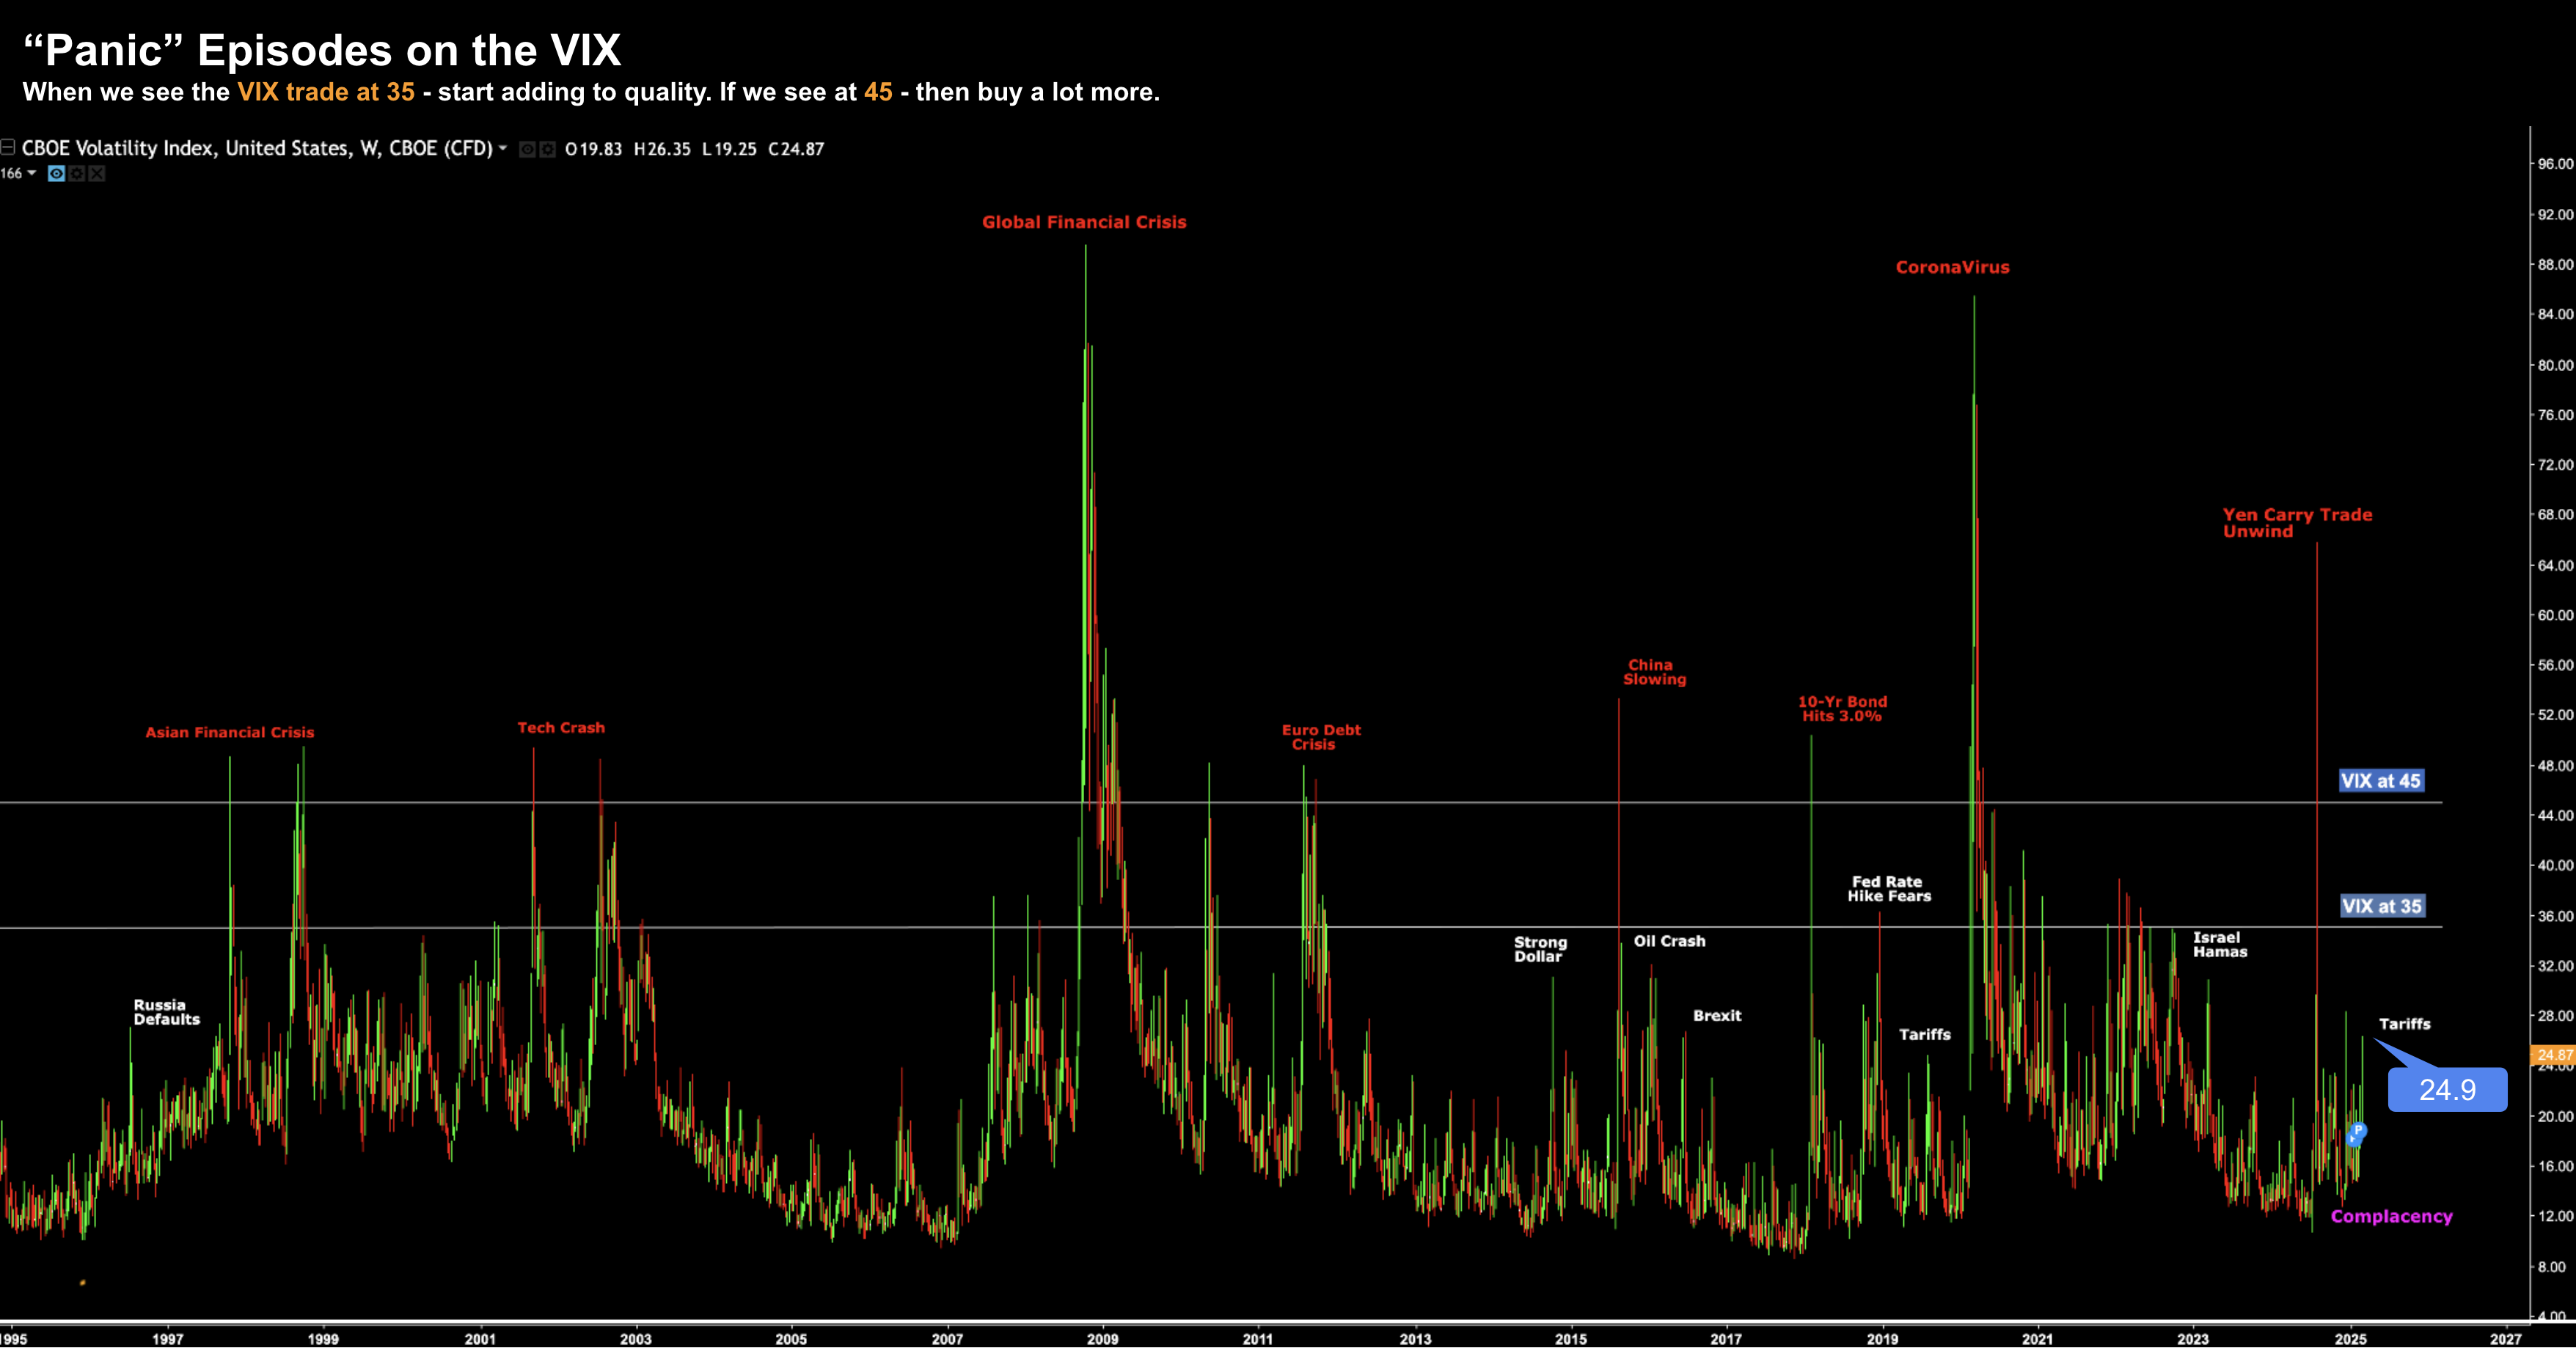
When the VIX is at 12, the "boat is leaning to one side" (extreme complacency). When it hits 35, the boat is tipping. That is when savvy investors add to Quality.
Inversion: How to Fail During a Market Dip
To succeed, we must first define what leads to failure. If you want to lose capital during a market easing, follow this "anti-checklist":
- Ignore Quality: Buy speculative companies with no earnings just because they are "cheaper" than they were last month.
- Use Leverage: Force yourself into a position where a temporary 20% drawdown results in a margin call.
- Short-Termism: Abandon your thesis if the stock is still underwater after 12 months.
- Over-Optimism: Assume you have found the absolute "bottom" and take a 100% position immediately.
By inverting the problem, we see our path: We buy moated assets, we avoid leverage, we maintain a 4-year horizon, and we scale in slowly because we expect the stock to trade lower after our first purchase.
The 15/15 Quality Filter
When panic hits, do not just look at the price trend. That only tells you about sentiment. Look at the business. I prioritize companies that clear these hurdles:
- The 15/15 Rule: Return on Equity (ROE) and Return on Invested Capital (ROIC) of 15%+.
- High Free Cash Flow: Proven growth over a 10-year period.
- Strong Net Margins: Evidence of durable pricing power.
- Valuation: Targeting an EV/EBIT or P/FCF of 15x-20x for moated assets.
If you aren"t comfortable with quality analysis, the simplest path is to add to the Index via a low-cost fund like Vanguard"s VOO.
The Bottom Line
Buying peak fear feels like the world is collapsing. Recession talk will be rampant, and unemployment will be rising. Most will sell. But as Buffett says, "Only when the tide goes out do you see who is swimming naked."
When you buy stocks out of favor, expect them to stay underwater for a year or more. I rarely take a full position at once; I hope for a further 20% drop to complete the stake. By combining the VIX signal with a Quality framework, you stop being a victim of the market"s mood swings and start becoming a beneficiary of them.