Inflation: Here Today… Gone Tomorrow?
- Bond markets calling Powell"s bluff?
- How to spot signs of a (coming) Fed policy mistake; and
- Why some inflation is unlikely to be entirely transitory
The near-term bounce in equities continues as Corporate America continues to post stellar profits.
I will check in with the S&P 500 after Friday"s close…
However at the time of writing – the Index looks set to take out the all-time high of 4535.
Maybe the near 5% September swoon was as good as it gets?
Tonight"s missive revisits the most important topic on the mind of every investor: inflation.
Here today – but gone tomorrow?
I think that"s the market"s bias.
But how do we know?
Faced with a massive global supply crunch (which looks certain to go deep into 2022) – central bankers weigh the merits of reducing monetary accommodation.
But they are faced with an impossible question to answer; i.e.
Just how much of the 30-year high inflation we"re experiencing today is:
- the resurgence of economic demand (pent-up over the past 18+ months); or
- due to supply-chain impediments caused by closed factories, jammed ports and shortages of materials and workers?
Who can say for sure?
Whatever the case, rates are almost certain to rise... evidenced by what we see with the 10-year yield and break-even rates.
As a result, when rates do rise, this will temper demand.
However, it will do nothing to ease the supply bottlenecks across the world.
But let"s say these shortages ease and trade resumes as expected (as it will at some point) – will monetary policy flip from being too easy to too tight?
Bond markets seem to think so (as I will demonstrate below)
As I said the other day – the Fed may have boxed themselves into a corner (and not for the first time).
And it will take a silver-tongued Jay Powell to talk his way out of this one…
10-Year Yield Calling Powell"s Bluff
From mine, one of the best measures of whether tighter monetary policy is on the horizon is what we see with the 10-year yield.
Let"s update our weekly chart and my self-titled "market friendly" barometer:
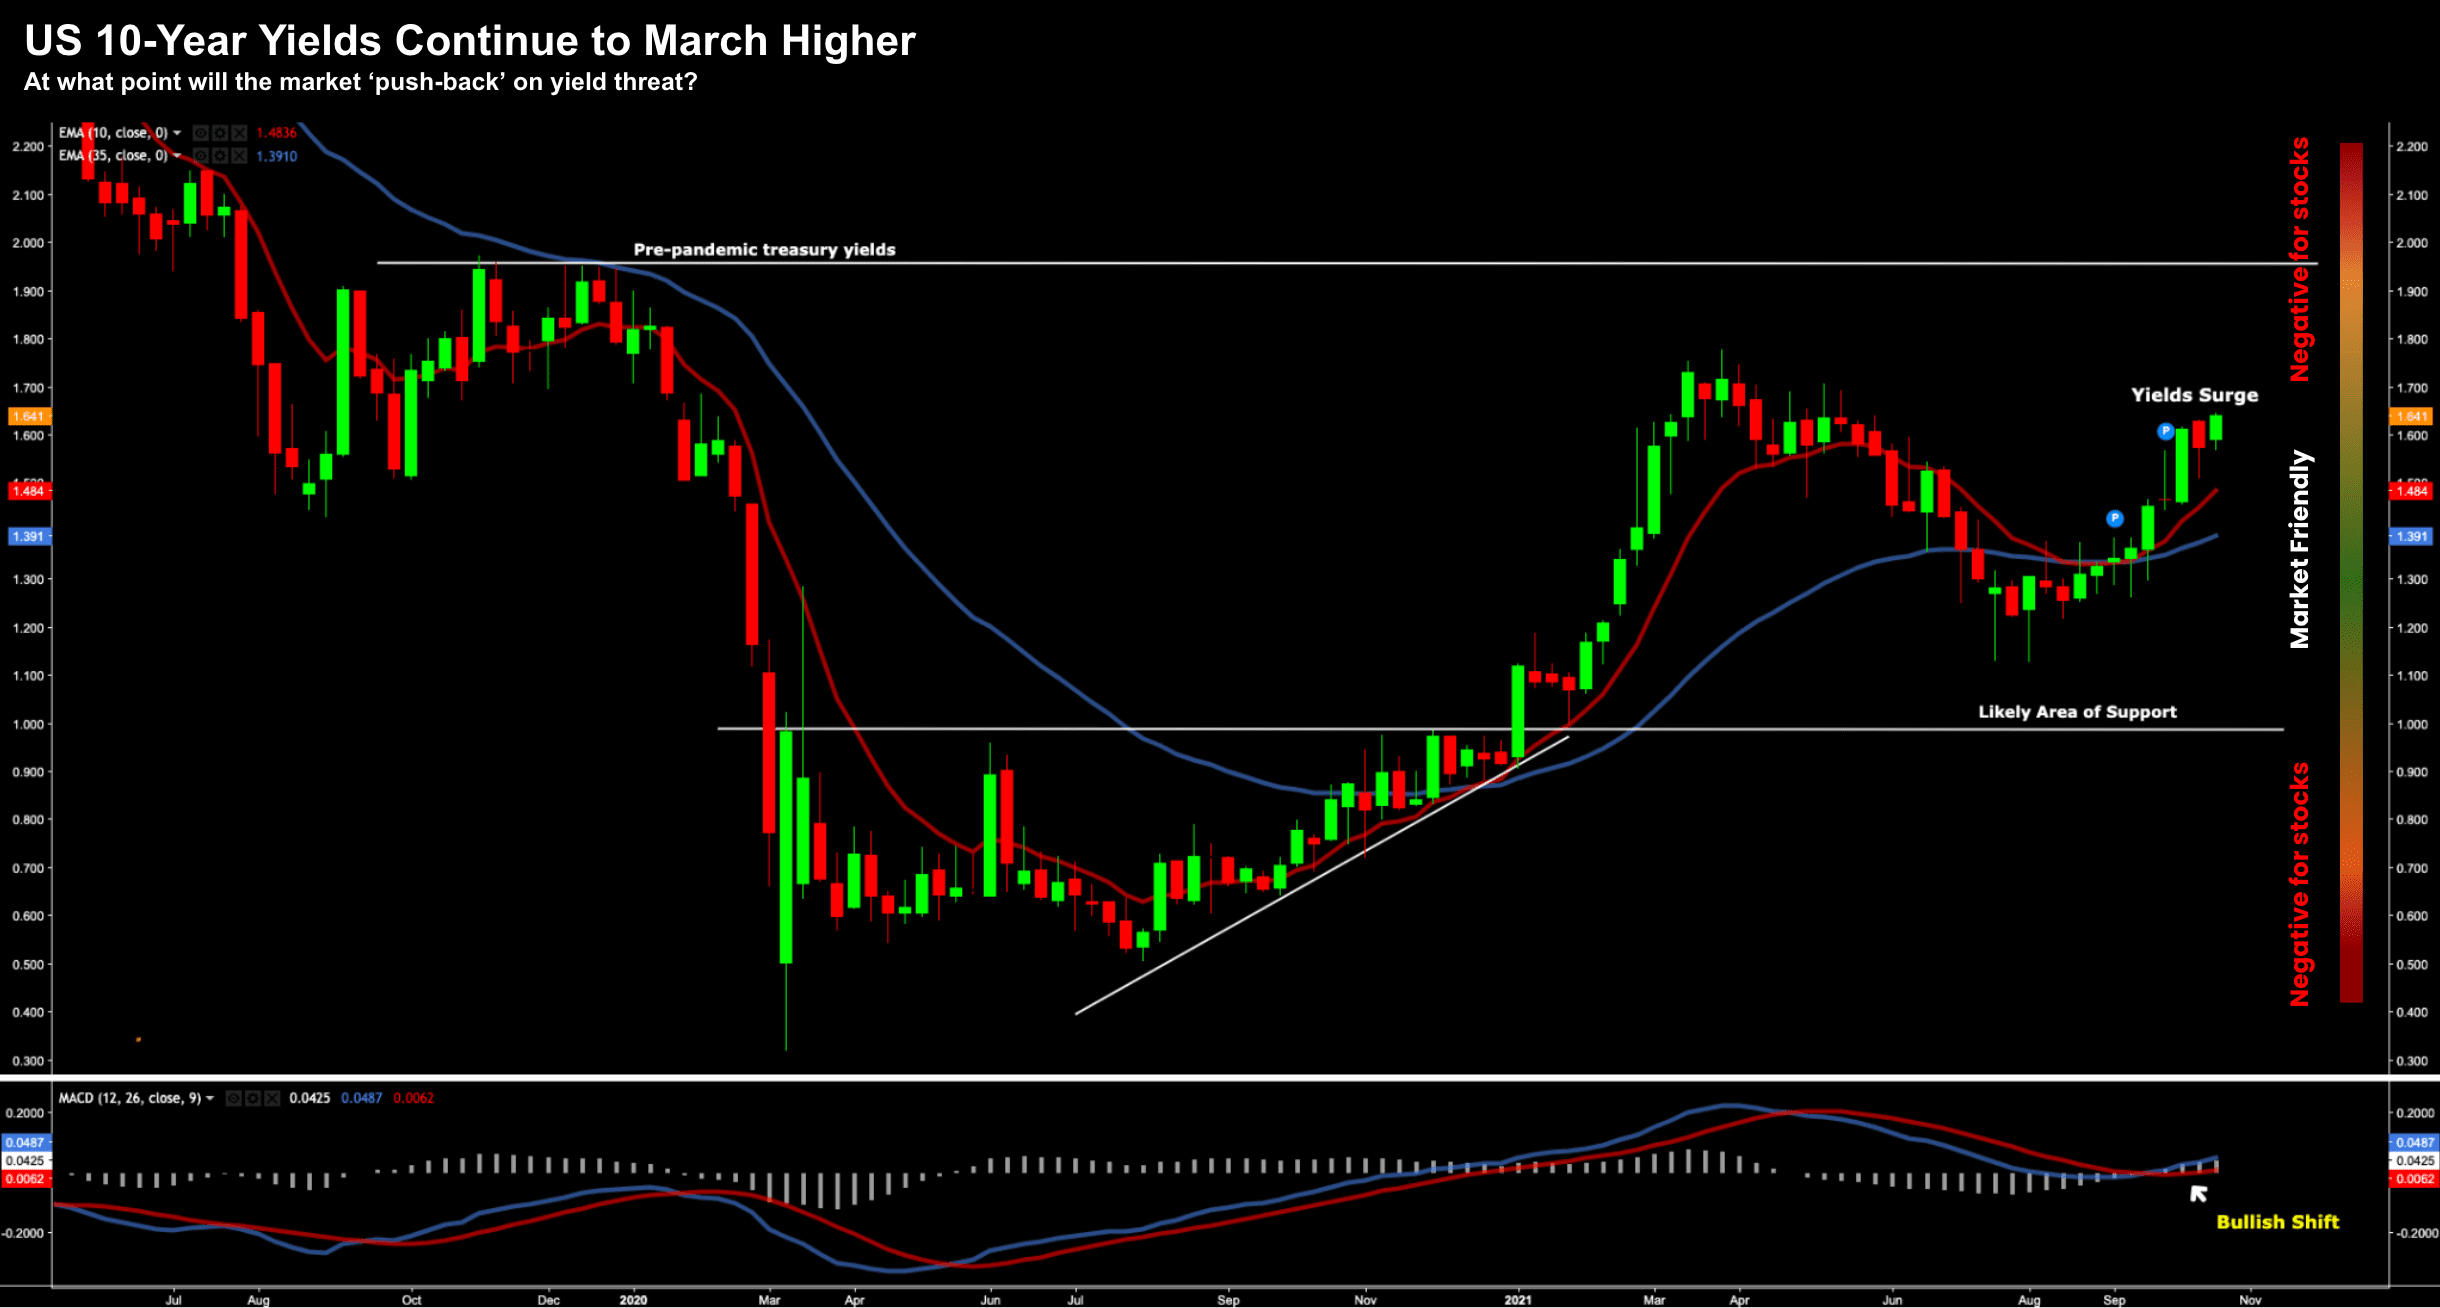
October 19 2021
In short, it"s my view that 10-year yields trading between 1.10% and 1.80% are a relatively "friendly" zone for stocks.
However, I think once yields start to advance toward 2.00% (and above), that equation may change.
Similar, if yields were to decline below 1.0% (which now seems most unlikely) – this would also be a negative.
To that end, I think Jay Powell may continue his "slightly hawkish" rhetoric (i.e. reducing bond purchases / raising rates towards the end of 2022) – however keep pushing things out on any commitment to act.
But this is a balancing act…
Because at some point, the 10-year yield will call his bluff (and we feel close to that point)…
Inflation Expectations…
Perhaps the best (market) measure of inflation expectations are what we see with break-even rates:
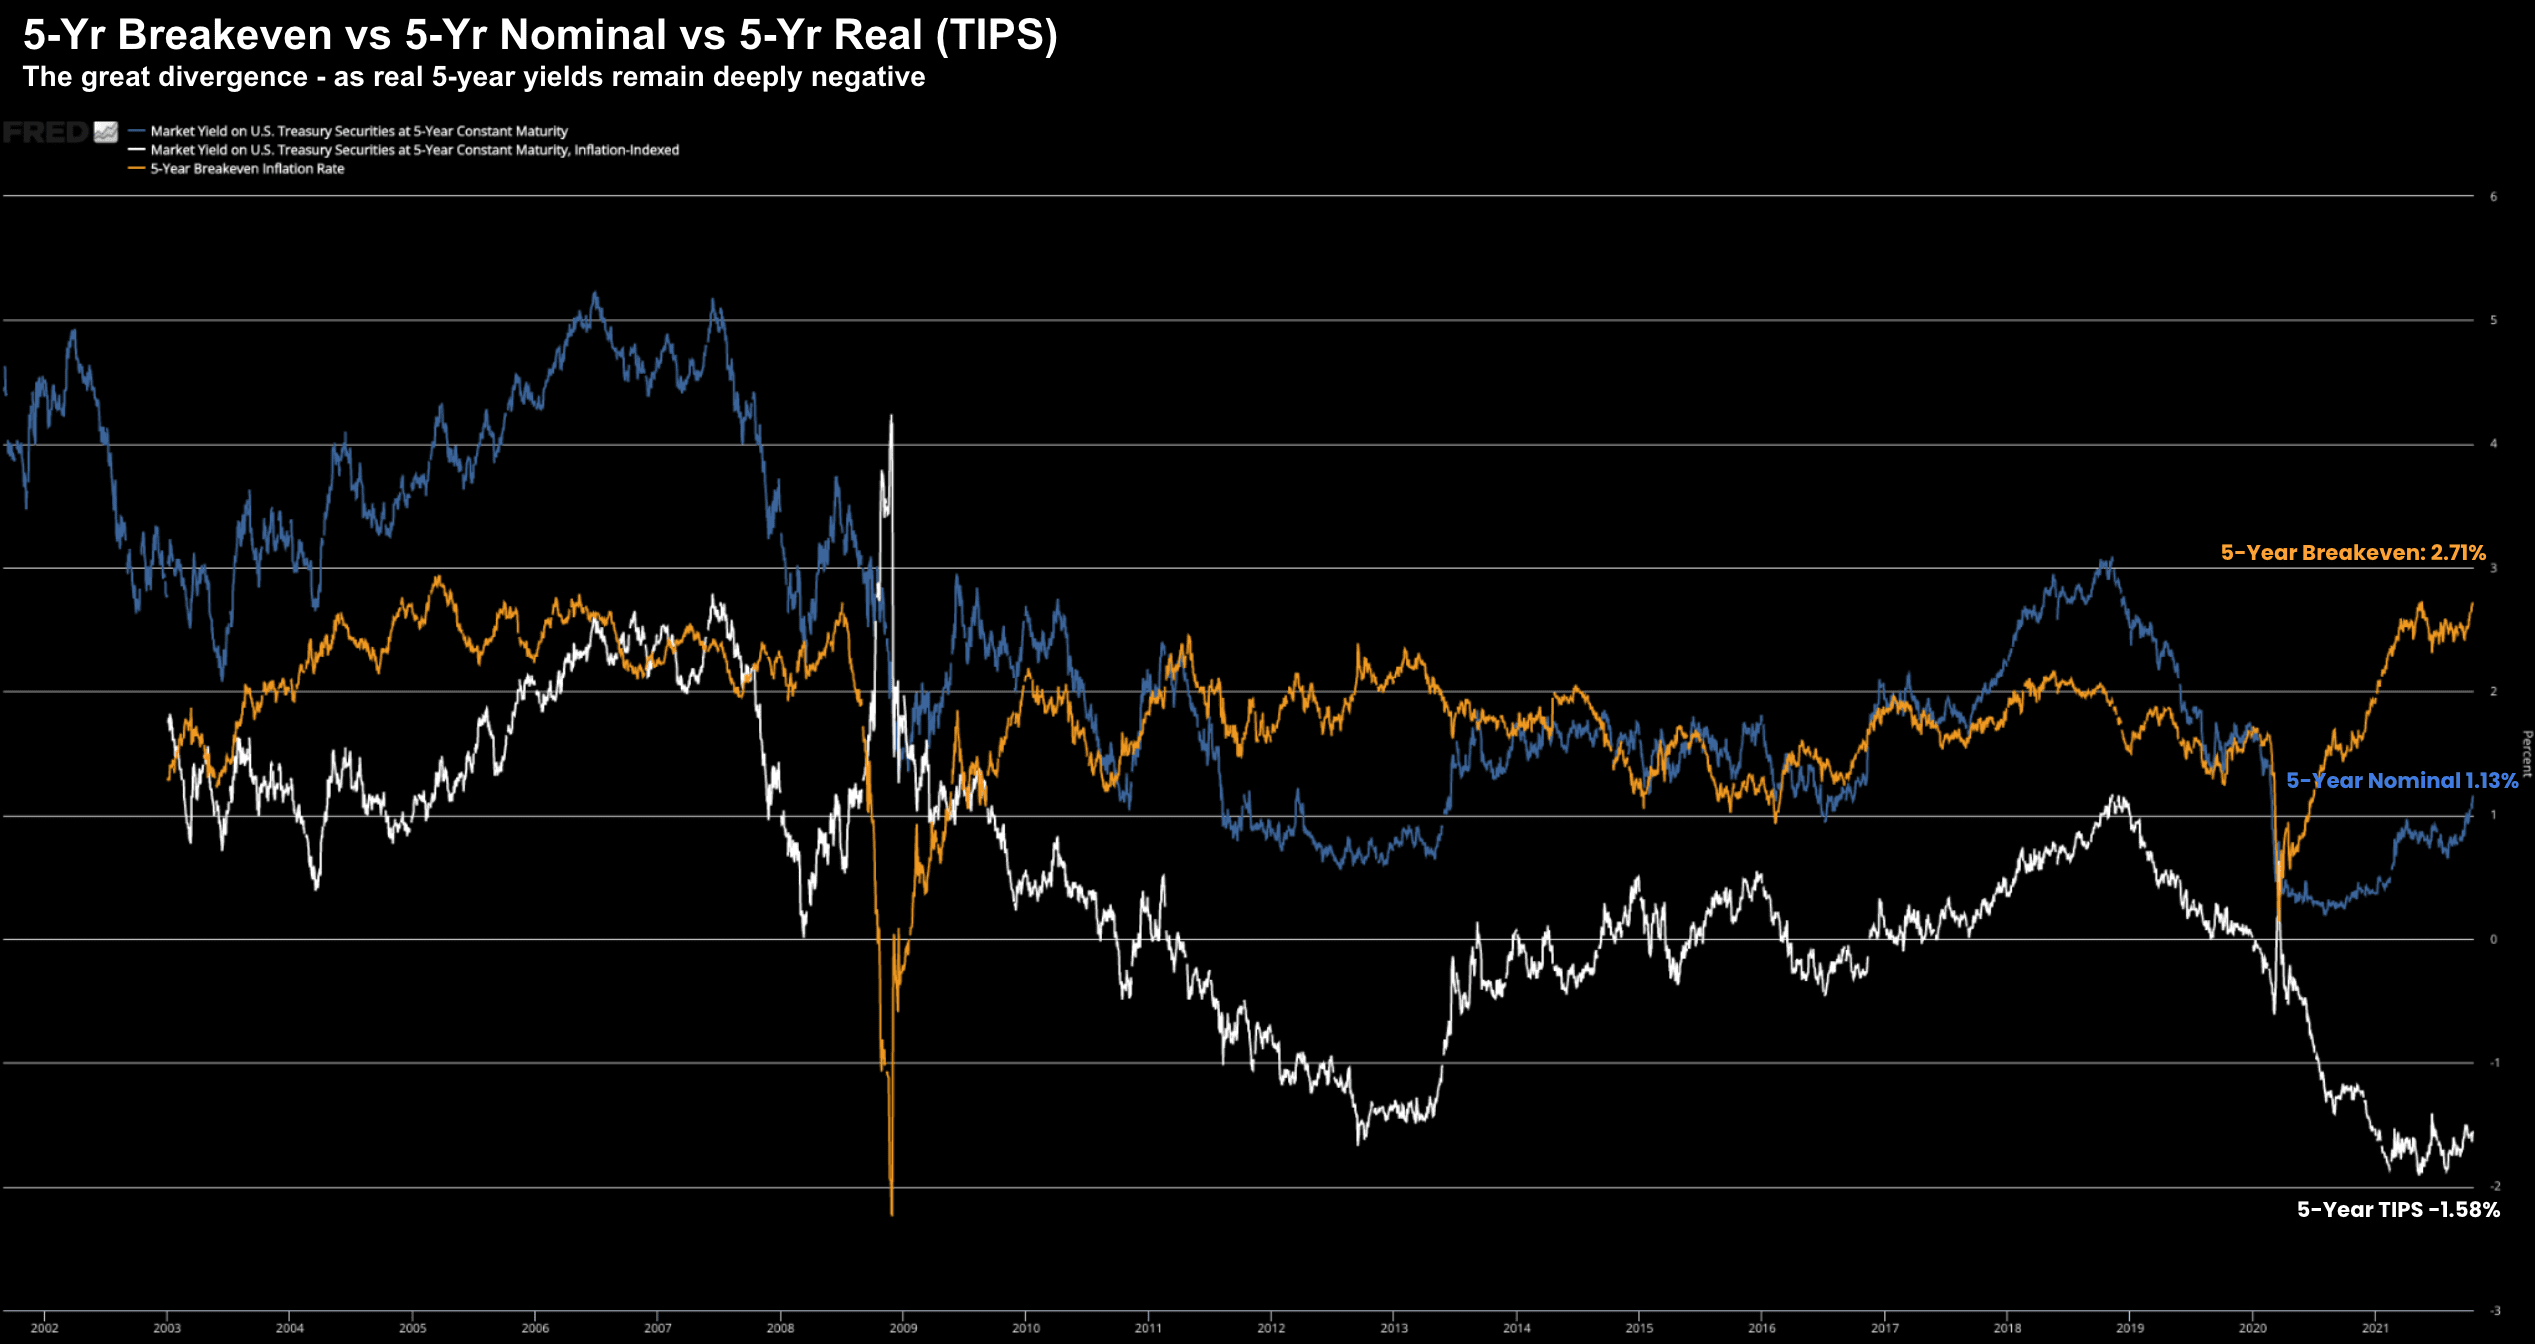
October 19 2021
For those less familiar, the chart above is one of the most important for traders and investors alike.
This shows how 5-year inflation expectations are built into bond prices.
The key line is in orange – which shows the difference between the yield on nominal 5-year (blue) and real (inflation adjusted) 5-year treasuries (white).
This is the (bond) market"s explicit expectation of what consumer price inflation will average over the next 5 years (2.71%).
That"s near the high end of the past 20-years – which tells us the bond market may not be buying what Jay Powell is selling.
In other words, inflation may not just be transitory.
But what it also suggests is if future inflation expectations rise to the ~5% level (i.e. 30-year highs we find today) – the bond market may be in for a severe adjustment.
That is, nominal yields (blue line) will have to rise significantly; and/or real yields (white line) will have to hold steady or fall.
I will be updating this chart on a monthly basis – as this will determine what we see with equities.
Again, my thesis is that equities are not pricing in the prospect of the bond market adjusting sharply.
For example, take a look at this economist survey from Bloomy this week on inflation expectations:
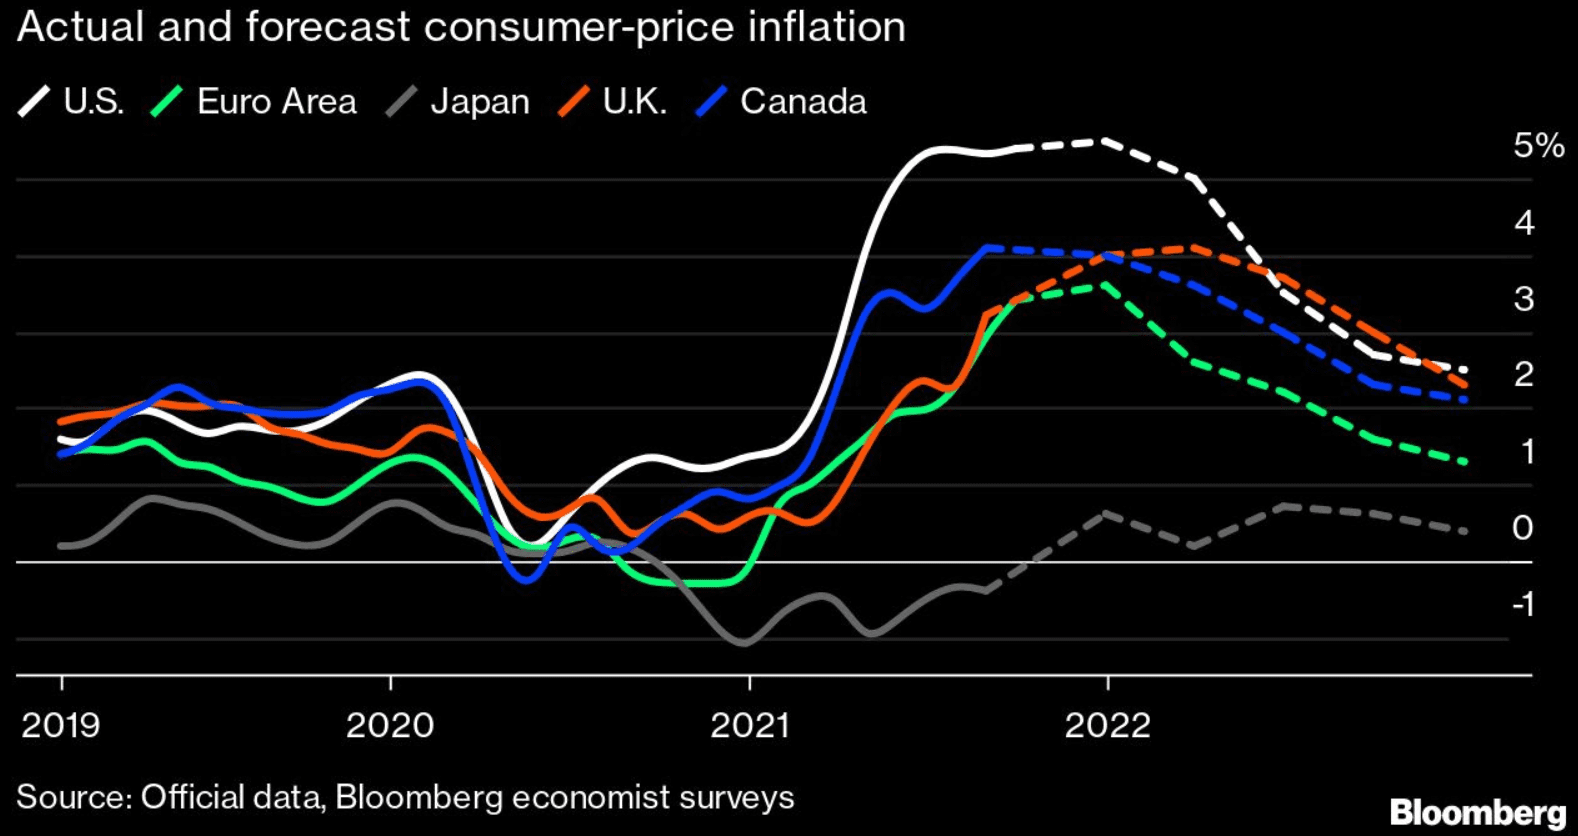
October 19 2021
They see global inflation peaking late 2021 before falling back to a level of around 2.5% by the 2023
And whilst this is largely inline with the 5-year breakevens above – let"s keep an eye on expectations.
My guess is this chart will be revisited…
Putting it All Together…
From mine, the bond market is telling us inflation is more than "transitory" (a term used far less by Powell & Co.)
We see this via the higher breakeven rates (with the 5-year breakeven at ~2.71%)
As I say, this is near a 20-year high and almost certainly expected to move further.
But with respect to the all-important yield-curve (e.g. 10-year treasury yield less the 2-year) – generally if inflation is expected to increase, the yield curve should steepen sharply.
However, that"s not what we see… or at least not to the level we should expect.
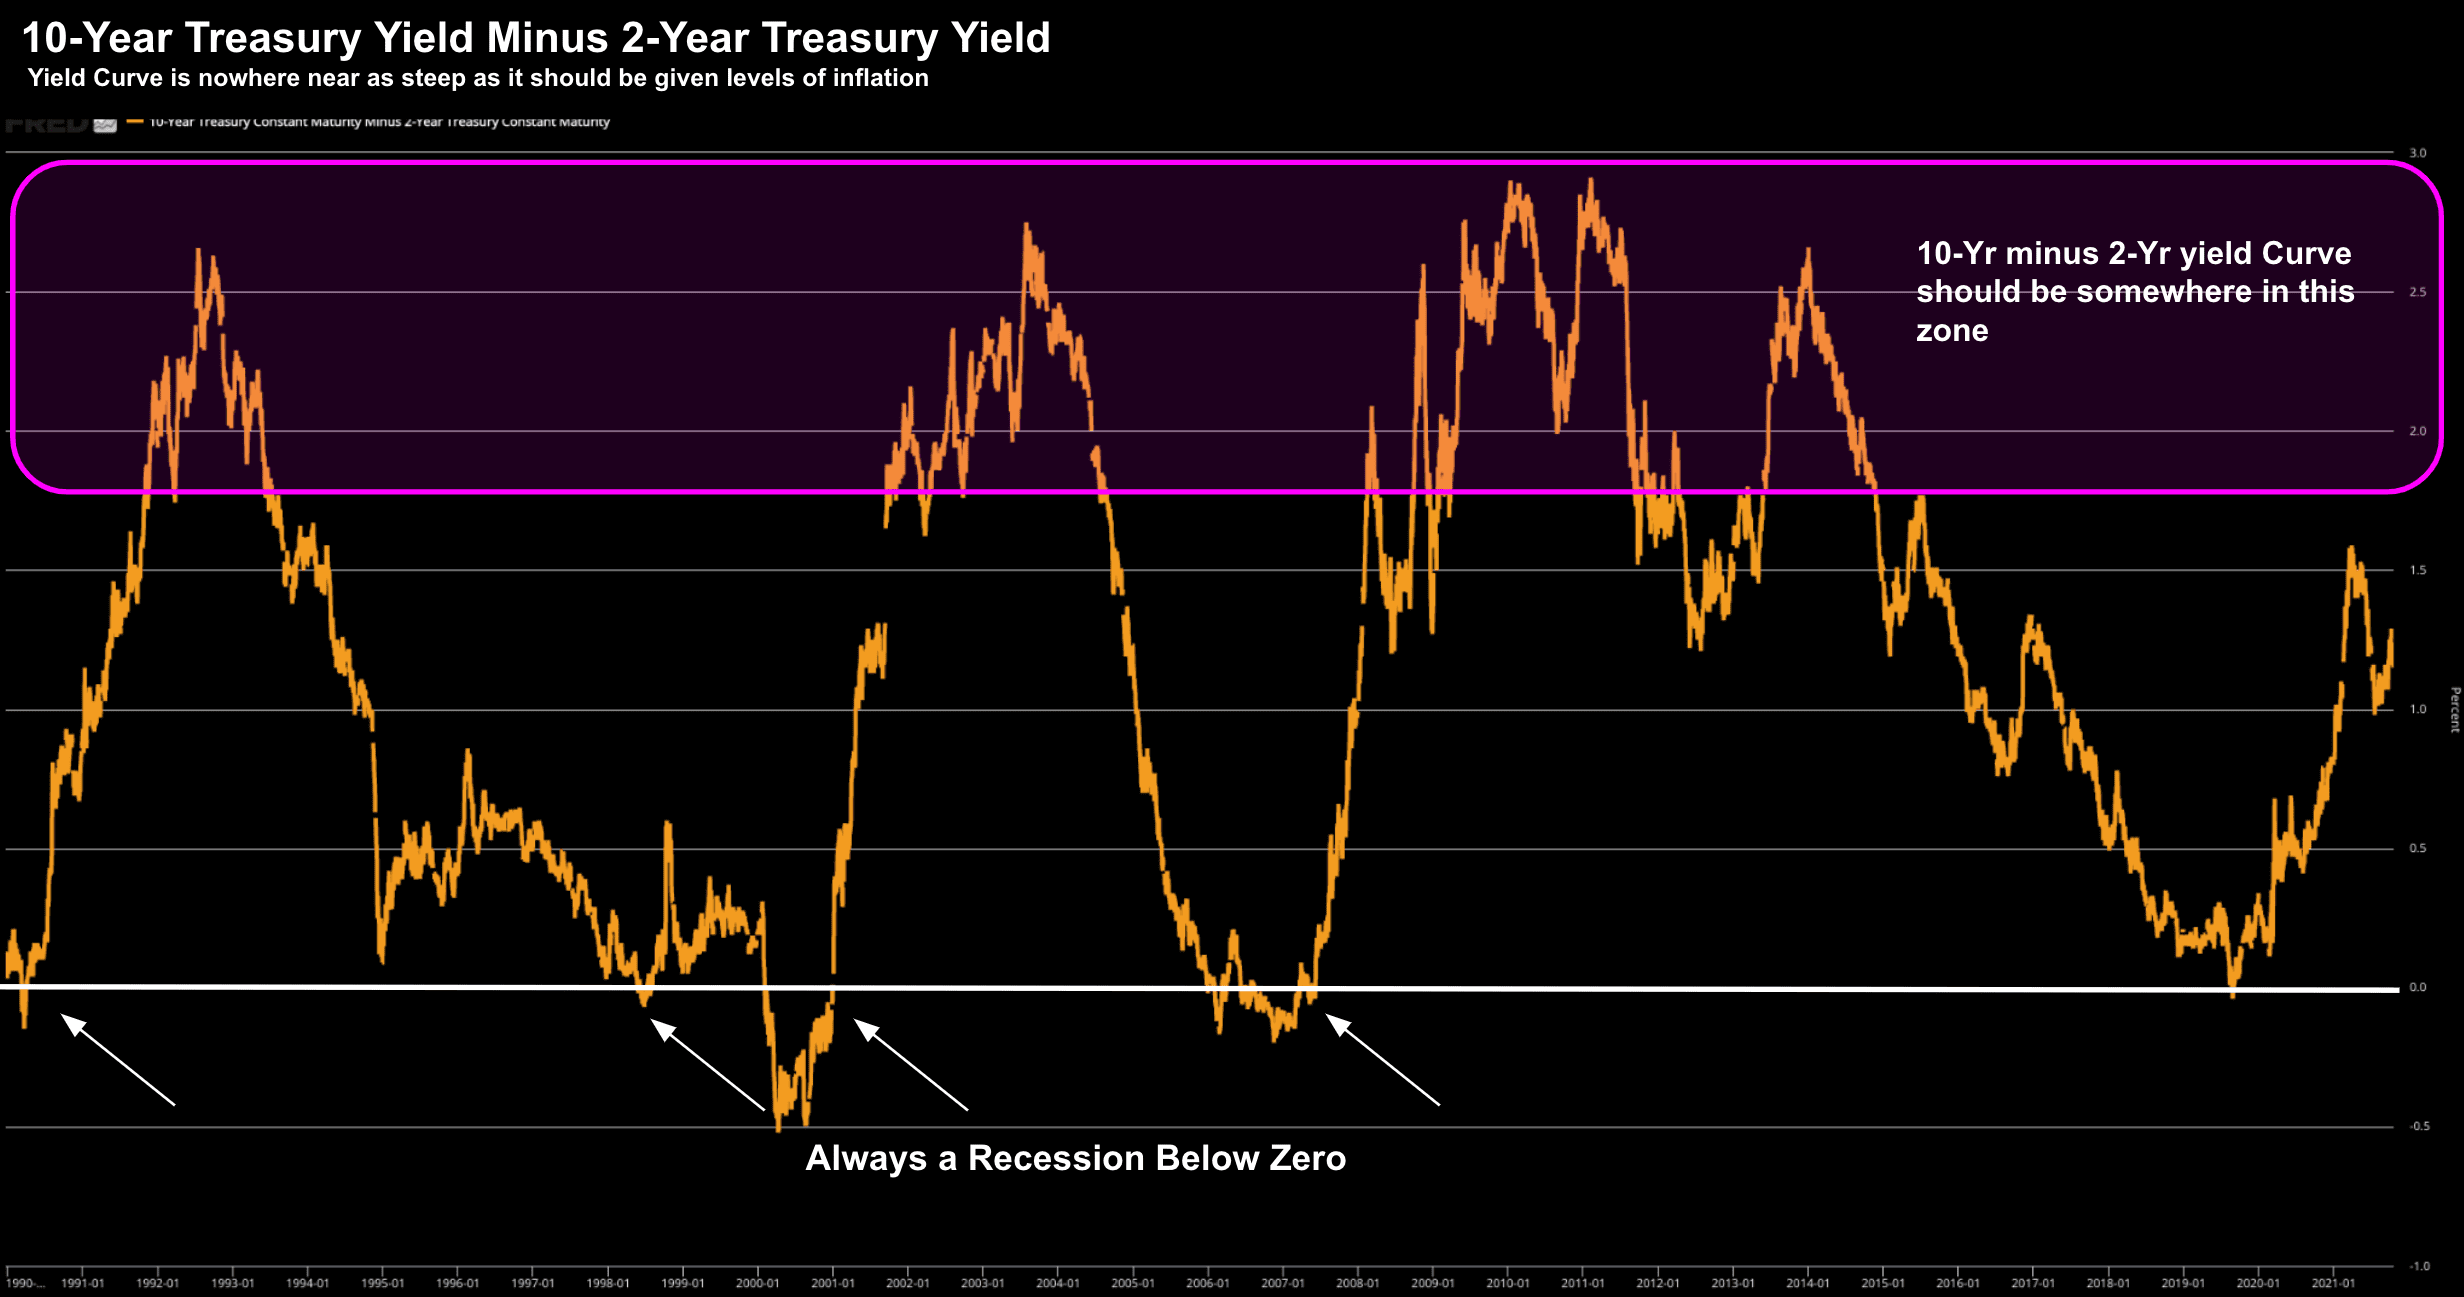
October 19 2021
From mine, this curve should be much steeper to compensate for all the inflation that will happen in between now and then (i.e. at 5% and above).
So what does this potentially mean?
One plausible explanation is the bond market feels the Fed will most likely hike too far to manage inflation risks (which would be consistent with their past behaviour)
And if that proves to be true… they will hike into a slowing economy in turn choking economic growth (as I posited last week).
From there, if growth is to recede, it"s likely inflation will ease as well as demand falls.
Of course, all of this is pure speculation on my part…
Like you, I"m simply trying to connect some of the inflation (and Fed) dots… based on what we see in bond markets.
Today equities don"t seem too bothered… not yet… however any shift in the Fed"s tone could change that.
I suspect more "hawkish undertones" over the coming weeks and months.
Let"s see what that does to equity valuations… and yield breakevens.