The 100bp Neutral Rate Rule: Why Underlying Inflation Challenges the “Goldilocks” Narrative
- Headline inflation eased, but underlying price pressures remain elevated
- Disinflation driven by anomalies, not broad-based structural improvement
- Policy crosscurrents shift inflation risk, rather than eliminate it
I"ve just returned from three relaxing days in Daylesford, Victoria.
For my U.S. friends: it"s a historic town where time seems to slow down — full of excellent restaurants, art galleries, and a genuinely restorative atmosphere.
Earlier this Monday morning I caught up on the (market) news from last week.
One headline was the latest U.S. inflation print – something I believe analysts could be underestimating in 2026 (as they price in aggressive rate cuts from the Fed).
Recent U.S. inflation data has surprised positively, with both headline and core CPI registering their lowest readings since the post-pandemic inflation cycle began in 2021. From our friends at Bloomberg Opinion:
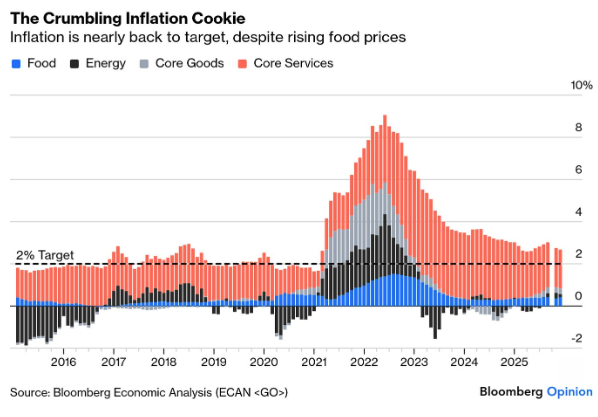
Markets saw this as a "Goldilocks" outcome — inflation easing without clear signs of economic weakness.
However, a deeper examination reveals meaningful crosscurrents beneath the surface.
For example, alternative inflation measures suggest underlying pressures remain closer to the Federal Reserve"s upper tolerance threshold.
Political and policy dynamics further complicate the outlook, creating a regime where inflation risk is not eliminated, but redistributed across sectors.
And whilst we are seeing disinflation in some sectors – I think this narrative remains fragile.
For example, while near-term inflation prints appear benign, structural pressures — particularly in services and labour-intensive sectors — suggest inflation is more likely to plateau around 3% (a long way above the Fed"s 2% target)
As investors – this has important implications for rate cuts, equity valuation assumptions, and sector allocation.
On the Surface: A Positive Surprise
The December CPI report came in softer than expected, defying consensus forecasts that anticipated a rebound as distortions from last year"s federal shutdown unwound.

Headline and core CPI declined to their lowest levels of the current cycle.
Notably, categories most exposed to tariffs — particularly core goods — remained subdued, with inflation running at approximately 1.4%.
This outcome challenged prevailing concerns that tariff adjustments would quickly translate into higher consumer prices.
As Carl Weinberg of High Frequency Economics noted, the anticipated post-tariff price surge has not yet materialised. Food inflation, often politically sensitive, also remained historically modest despite a monthly uptick.
In isolation, the data supports the view that the disinflation process remains intact. In turn, some may argue this reduces near-term pressure on the Federal Reserve to re-tighten policy (i.e., strengthen the rate cut narrative).
However, markets stopped short of embracing the data fully, reflecting unease about the quality and composition of the disinflation.
Stronger Under the Hood
Whilst the market cheered the headline report – several alternative inflation measures tell a more cautionary story.
Trimmed mean CPI, median CPI, sticky-price inflation, and the Fed"s "supercore" services inflation (excluding shelter) all suggest inflation is running near or above 3%.
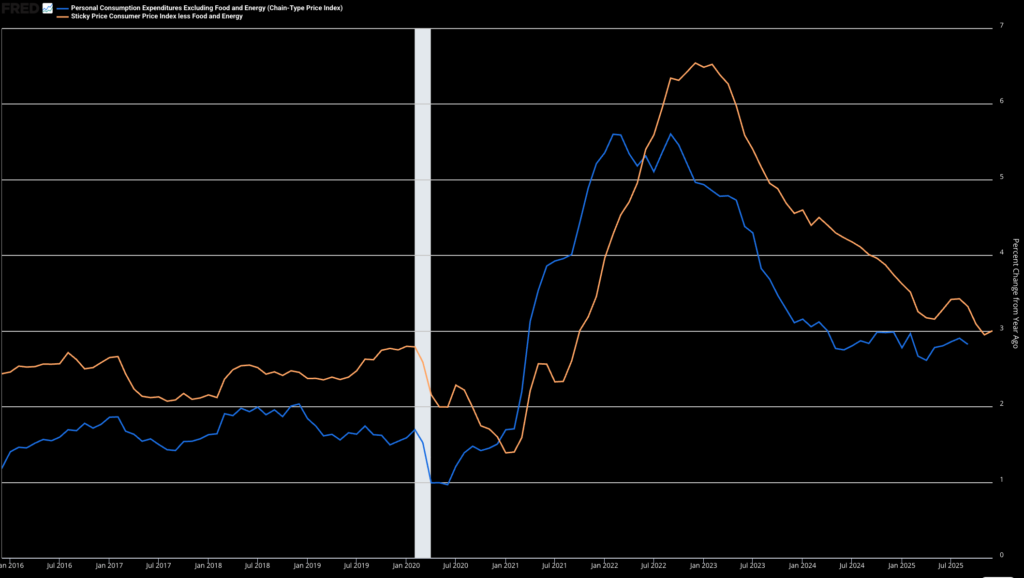
For example, core measures filter out volatile components and therefore provide a clearer signal of underlying price trends.
Omair Sharif of Inflation Insights characterises the report as "stronger under the hood," arguing that core inflation remains closer to 3.0%.
This assessment is supported by unusual monthly price movements that materially distorted the (lower) headline figure.
Sharp declines in categories such as wireless telephone services (down 3.3% month-on-month) and moving and storage (down 14.35%) alone reduced core inflation by roughly 10 basis points.
These price drops are difficult to explain using standard economic drivers and may reflect temporary pricing strategies, seasonal adjustments, or data noise rather than sustainable deflation.
The risk is that markets extrapolate transitory disinflation into longer-term assumptions about price stability.
Further complicating matters is the divergence between CPI and the Fed"s preferred inflation gauge, core PCE.
Core PCE is likely to run hotter due to its inclusion of food consumed away from home — a category that rose 0.7% in December.
This distinction matters materially for policy expectations, as the Fed sets policy based on PCE, not CPI.
Political and Policy Crosscurrents
Inflation dynamics are increasingly shaped by policy decisions that pull in opposing directions. For example:
- tariffs, labor market constraints, and industrial policy introduce inflationary pressures; however
- tighter immigration dynamics act as near-term disinflationary forces.
For example, under Trump"s MAGA policies – net U.S. immigration is approaching zero, coinciding with a growing supply of apartment completions.
This combination is likely to increase vacancy rates and place downward pressure on rents — historically one of the most persistent inflation components.
Shelter is typically the primary factor in the CPI barring wild swings in energy because shelter is over 35 percent of the CPI.
From Mike Shedlock"s MishTalk blog (who consistently provides a terrific "look through" analysis of inflation and employment trends):

This development may continue to weigh on shelter inflation in the near term
However, any potential increase in costs in labor-intensive service sectors such as restaurants, hospitality, leisure, and healthcare are more structurally embedded.
As a result, inflation risks may shift from housing toward services, rather than dissipate entirely. But for now the wage pressures are not there (with real-wages falling over the past 5 months).

This redistribution of inflation pressure complicates both monetary policy and market positioning. It also increases the risk of policy miscalibration if headline metrics are over-emphasised at the expense of structural indicators (like those above).
Investment Implications
Three things for investors to consider:
- Interest Rates: Markets still feel the Fed will cut between two and three times this year. However, the (inflation) data supports near-term stability in rates but challenges aggressive rate-cut expectations. For example, if core inflation stabilises near 3% (which appears to be the case) – the Fed may adopt a slower and shallower easing cycle than currently priced. Note – the Fed will typically set the neutral rate around 100 basis points above the inflation rate. At present, that is b/w 3.5% and 4.0% (with the current Fed funds rate at 3.64%). I would not expect the Fed to go much lower than 3.50% in 2026. Duration risk remains asymmetric.
- Equities: Valuations that assume a rapid return to 2% inflation may prove vulnerable. Margin pressure is likely to persist in labour-intensive sectors, while pricing power may remain uneven. High quality businesses with pricing flexibility and low labour intensity remain preferable (note: where quality refers to businesses with balance sheet strength and strong (consistent) free cash flows)
- Sectors: I tend to favour asset-light and price-power-rich businesses (i.e., those with strong defensible moats). On the other hand, businesses in consumer services, hospitality, and labour-heavy industries are exposed to wage inflation. I would also be cautious on residential real estate and REITs, where rent disinflation may help cash flows in the near term but slow nominal growth longer-term.
Putting it All Together
The latest inflation report did not offer us clarity.
And whilst headline disinflation is real – it remains fragile – influenced by volatile or politically driven factors.
Structural inflation — particularly in services — remains stubbornly elevated.
The most likely path is not a clean return to pre-pandemic price stability, but a prolonged period of inflation hovering near the Fed"s upper tolerance of around 3.0% .
For investors, the risk lies not in inflation re-accelerating sharply, but in complacency.
Markets may be underpricing the persistence of inflation and overestimating the scope for rapid monetary easing (e.g., two to three rate cuts).
And whilst there is a narrative the new (Trump appointed) Fed Chair will be "quick to cut rates" — remember the Chair is only one vote of 12 members.
The other 11 FOMC members will need to be convinced to aggressively cut rates. Today, the combination of inflation, employment and economic growth data simply does not support the narrative.
Question is – what does a Fed on hold mean for the equity bull case in 2026?