Inflation Soars – 7 Rate Hikes For 2022
CME forecasts 100% chance of 50bps hike in March
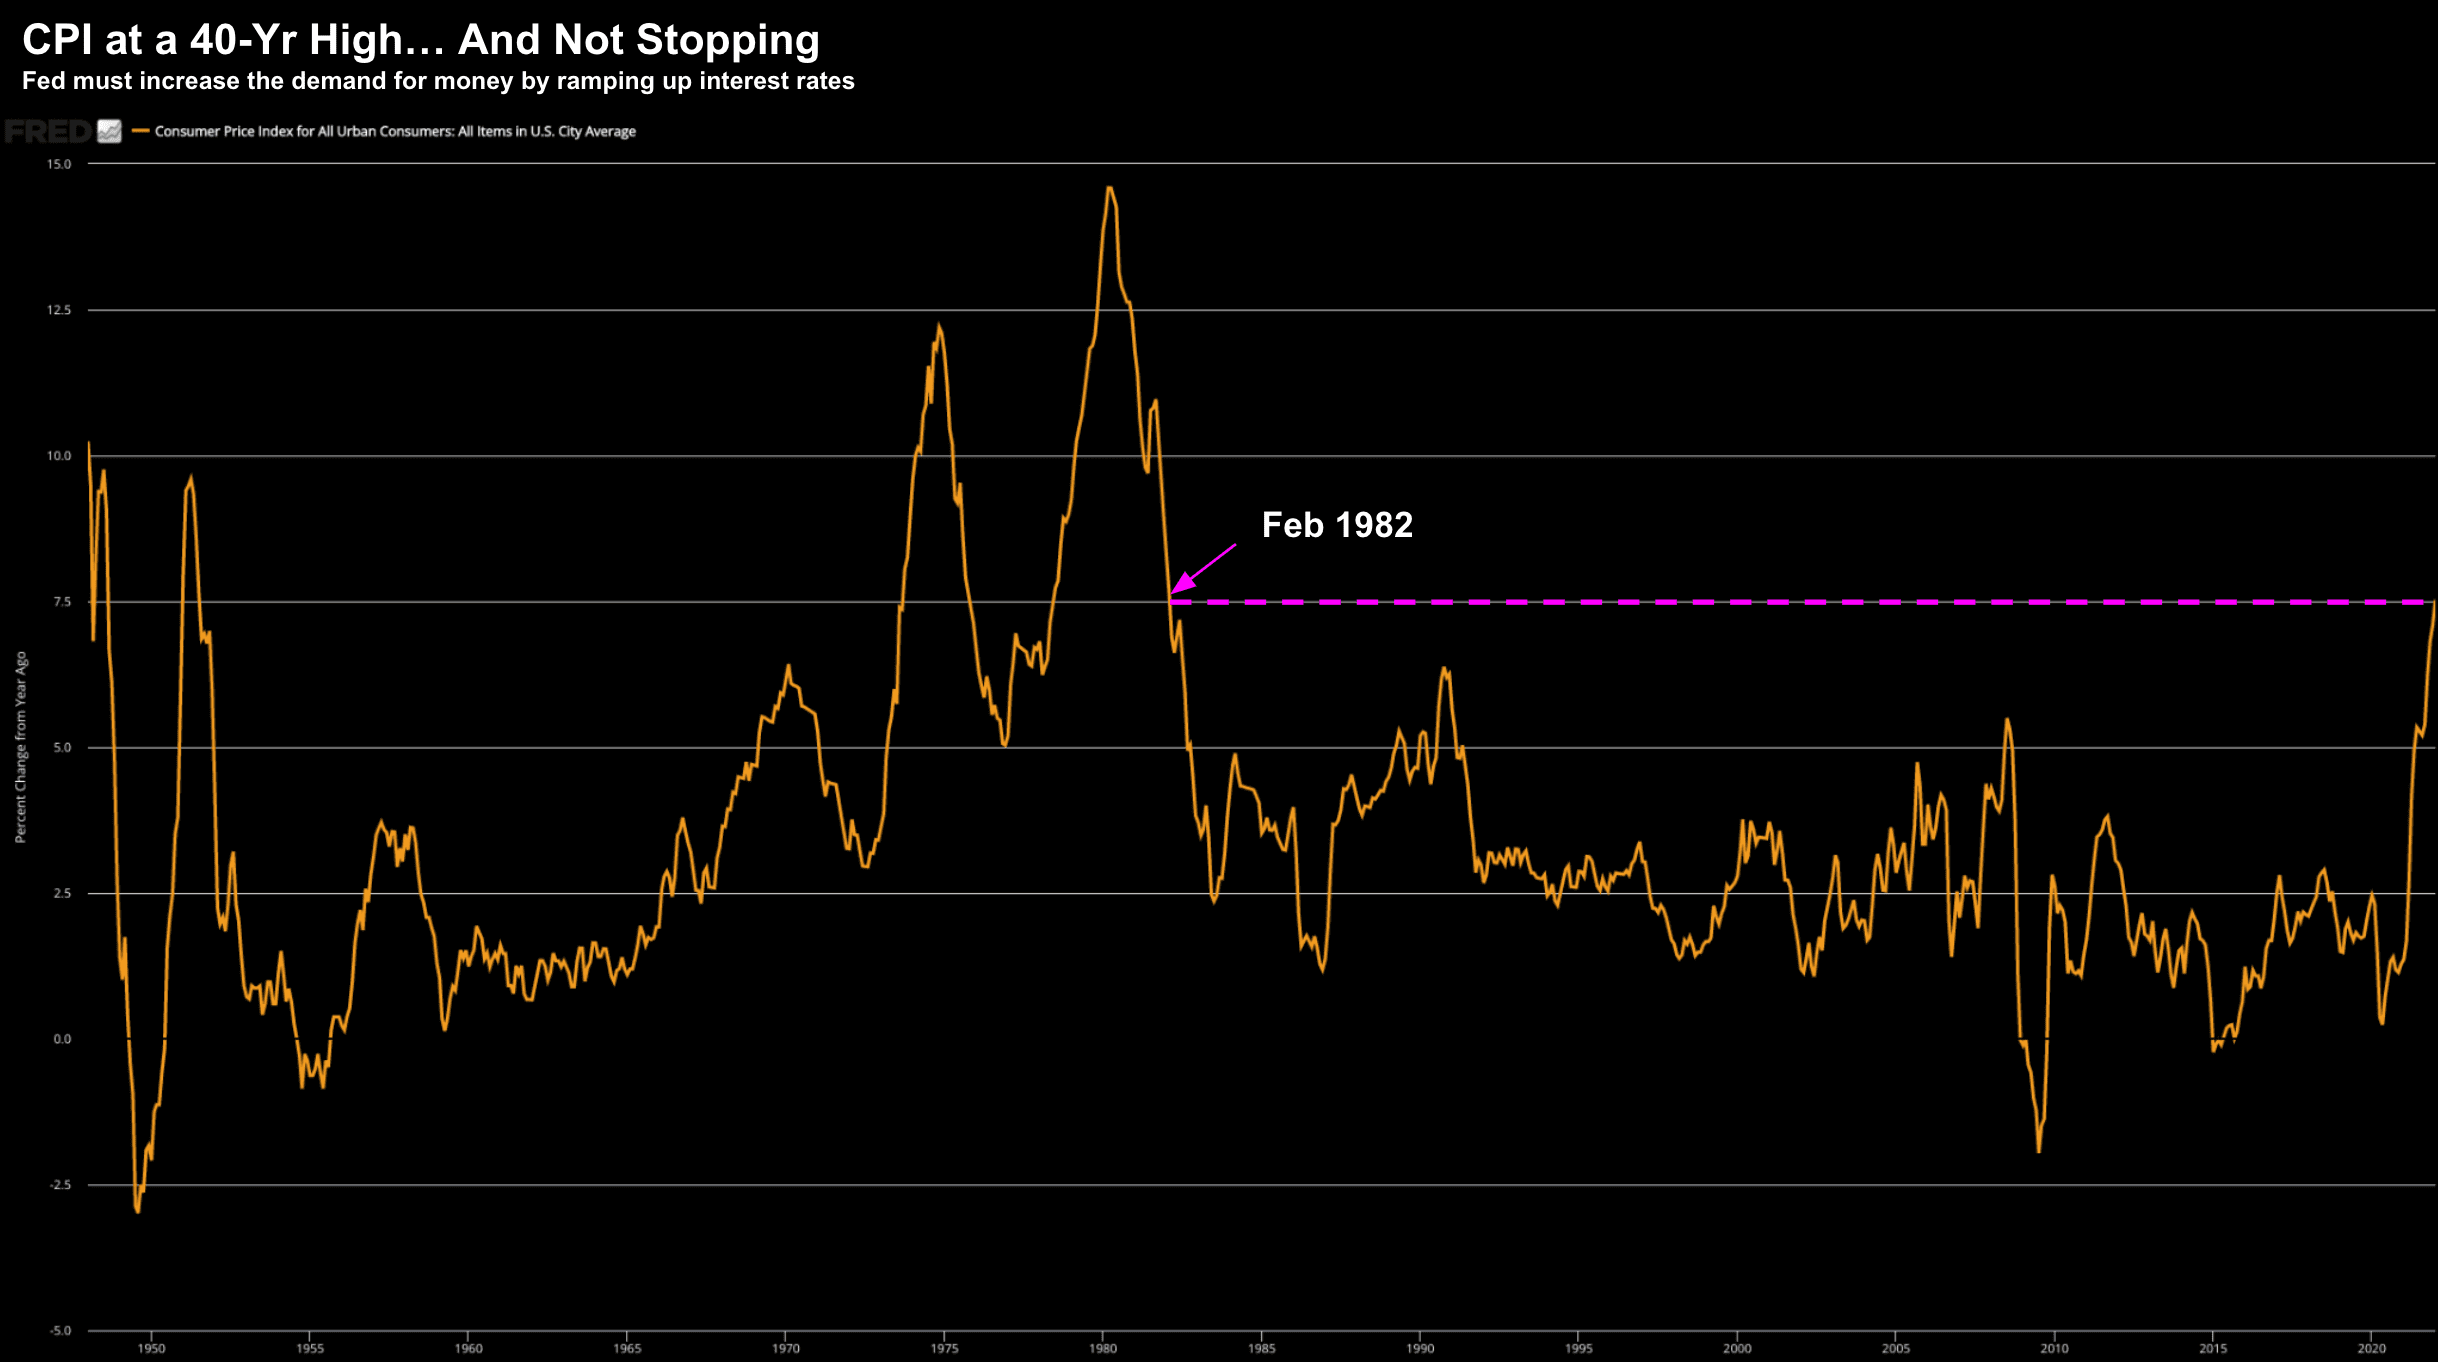
CPI hits highest level since Feb 1982 at 7.5%
5-year inflation expectations at 2.8%
Definition of inflation: excess money chasing too few goods.
It is entirely a monetary phenomenon.
Put another way, it can"t happen without excess money.
Yes, we can look to blame other things (e.g., reckless fiscal policy, oil prices, supply-chain snarls etc). And they all play a role…
But the underlying primary driver is the excess money created.
And that"s what is missing from the mainstream (inflation) narrative.
Why?
Let"s take a look at what needs to happen from central banks to curb inflation… and why that poses a longer-term risk to stocks.
It"s All About Money Supply…
Below is a chart that I've shared often in the past… as it tells a great story
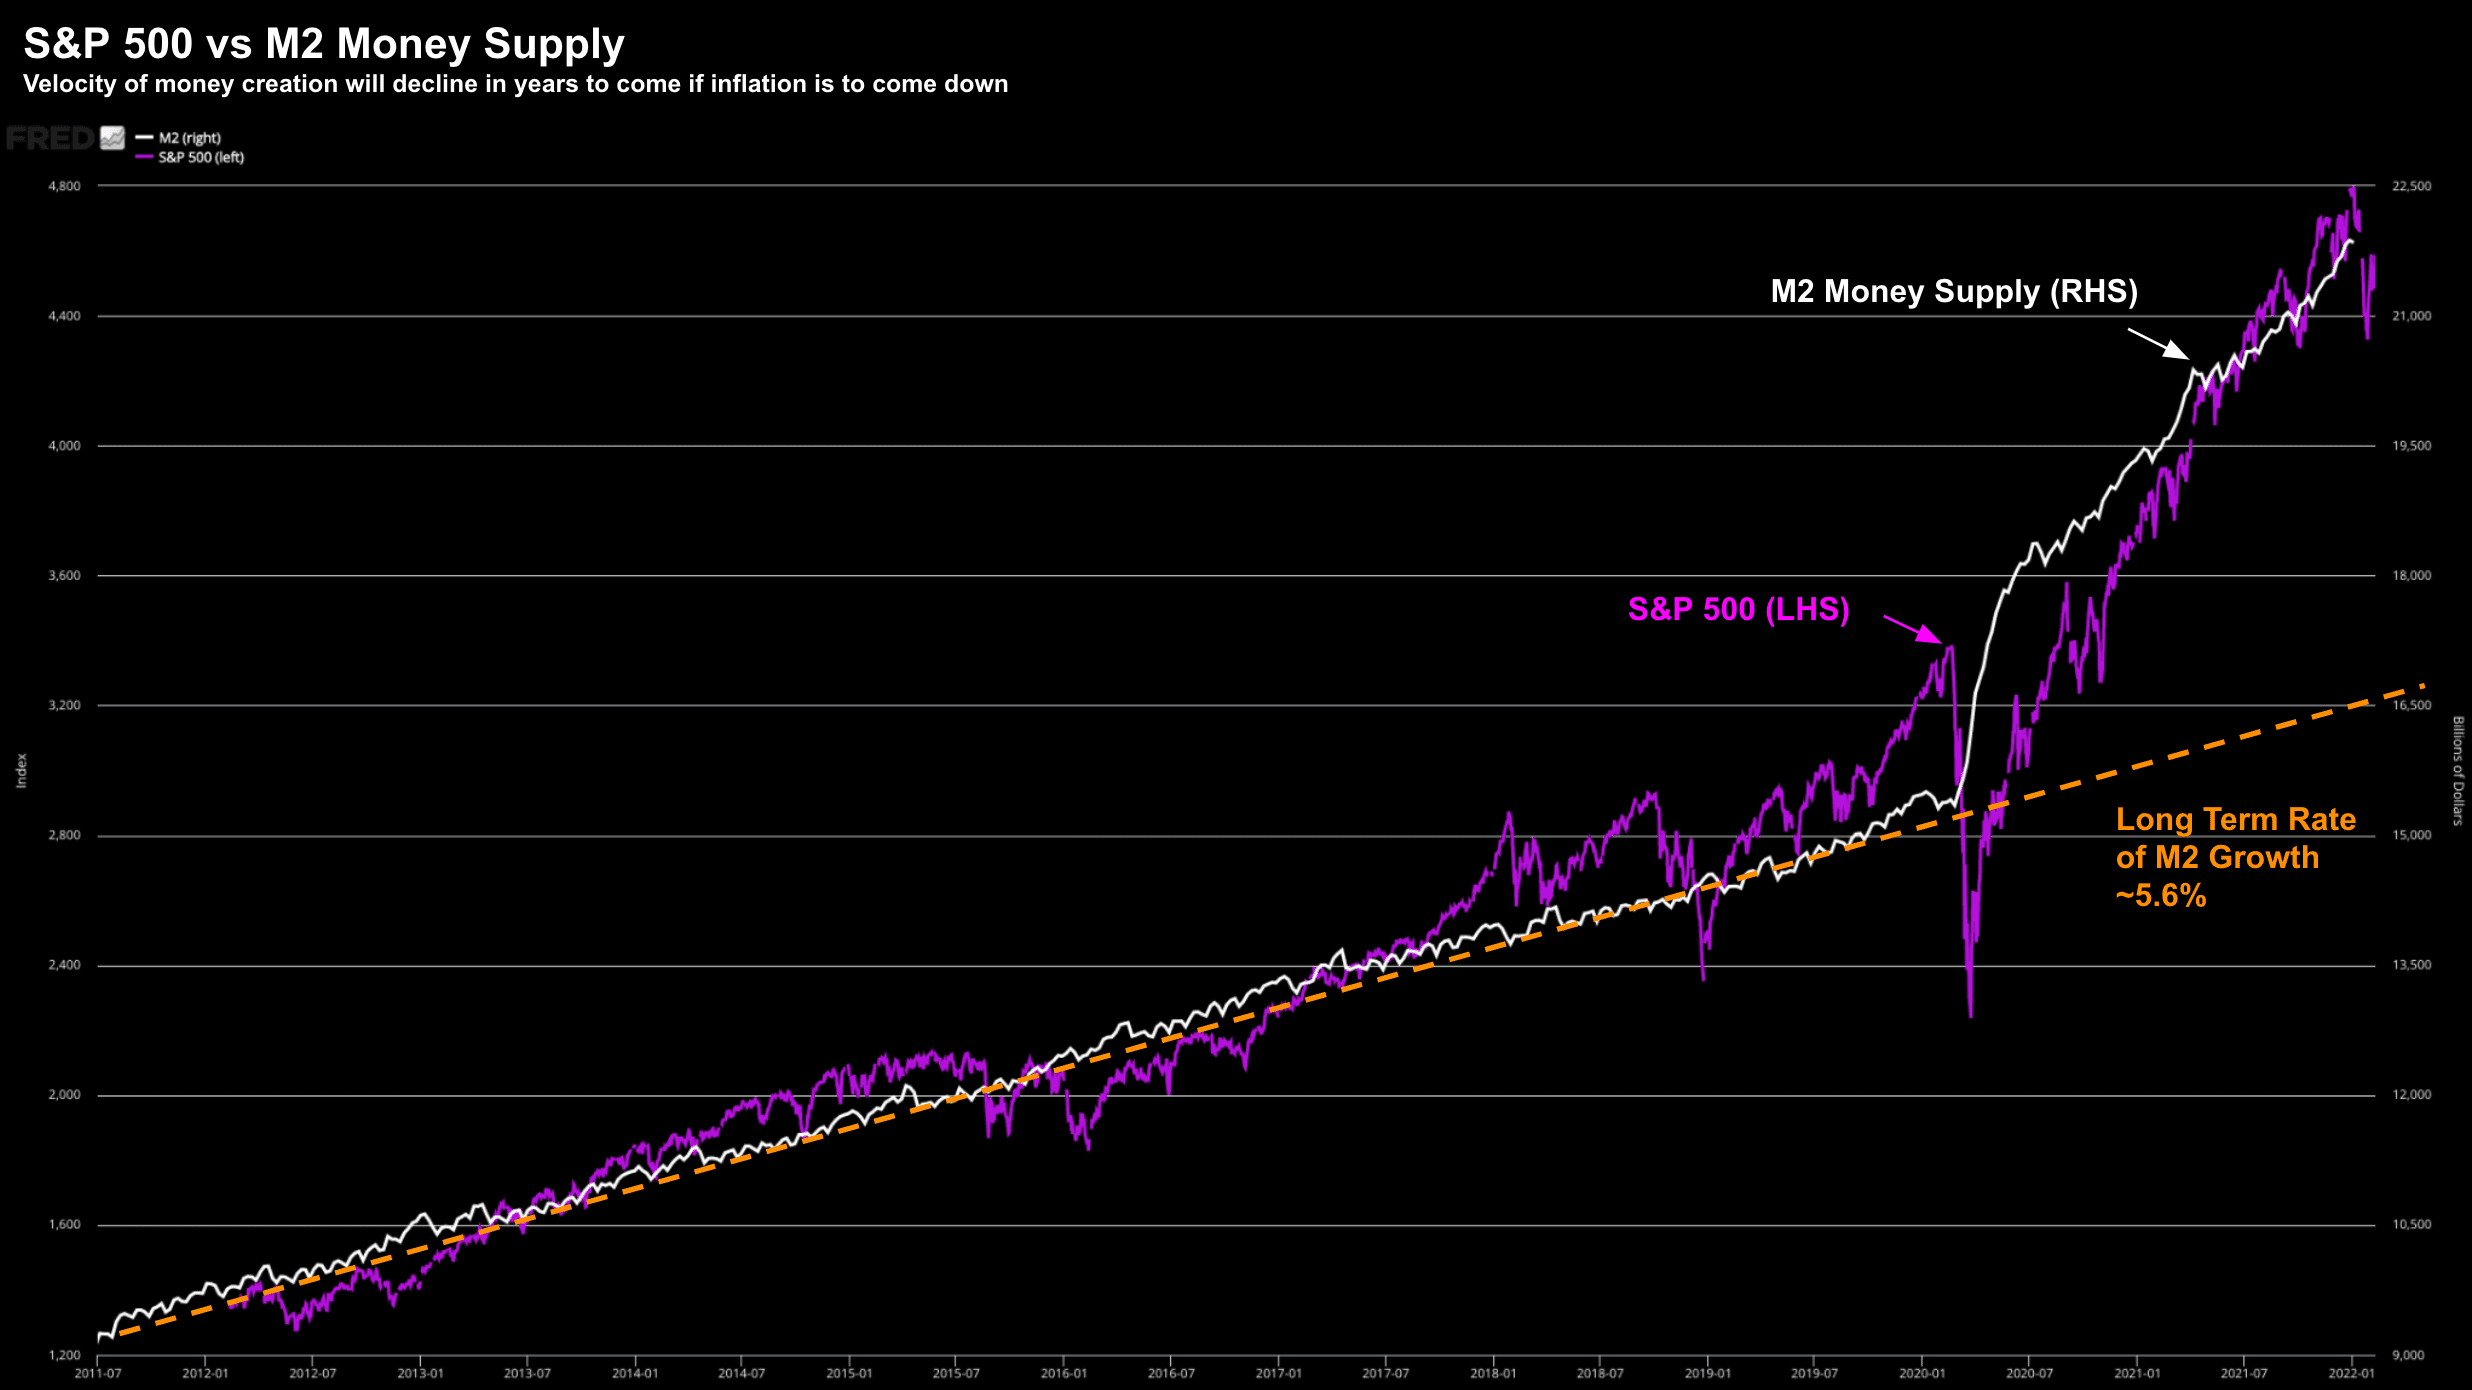
In white (right-hand axis) is M2 Money Supply.
The orange dashed line shows the average annual rate of growth from 2012 (~5.6%)
But look at what happened post March 2020…
Early in 2020 M2 was ~$15.4 Trillion.
Fast forward two years and it"s just shy of $22.0 Trillion.
That"s a ~43% increase in less than two years (or an increase of over $6 Trillion)
And some think it should be increased further!
But the correlation between money supply and risk assets (in this case the S&P 500) is clear.
Stocks (and houses) are typically the primary beneficiaries of money creation.
But it"s not only risk assets…
As we heard today, the price of everything has gone up.
Fuel prices over 40%. Hotels 25%. Used cars 40%. Meat over 25%. Coffee 20%. It"s a long (and painful) list.
Call it a poor man"s tax.
The TL;DR is the Fed has let the supply of money far exceed its demand.
Econ 101 tells us prices will increase.
So how do "we" fix this mess?
Two things:
– Reduce the supply of money (i.e. Fed selling assets); and
– Make holding money more attractive (increase demand)
In the short-run – the Fed are going to pull the lever on the latter.
That will try and improve demand.
Increasing interest rates makes holding money more attractive.
Today, there is almost zero demand for holding money as it offers a negative return of ~7.5% ("Your Cash Really is Trash")
But let"s say the Fed increases rates maybe 8 times over the next 12 months (as many now forecast) – which will see the cash rate hit ~2.0%
Now if inflation is still north of 2.0% (and I"m sure it will be at least double that) – the real rate is still negative.
But this is where the Fed finds itself…
They are well behind the curve… and now are being forced to pull the supply / demand levers.
Because if they don"t… inflation will only escalate.
Inflation – Highest Since 1982
The last time inflation was this high I was 11.
Back then you could buy a Paddle Pop for 20c.
Today they are over $1 each.
Quick math tells me that"s an increase of ~4% per year.
Today that rate is approaching 8%.
A rise of 7.5% YoY CPI wasn't a surprise for anyone who fills their car up with gas or goes to the supermarket each week to buy Paddle Pops!
Now the bond market is starting to pay attention…
For example, if we look at 5-year breakevens, they are now above 2.80%
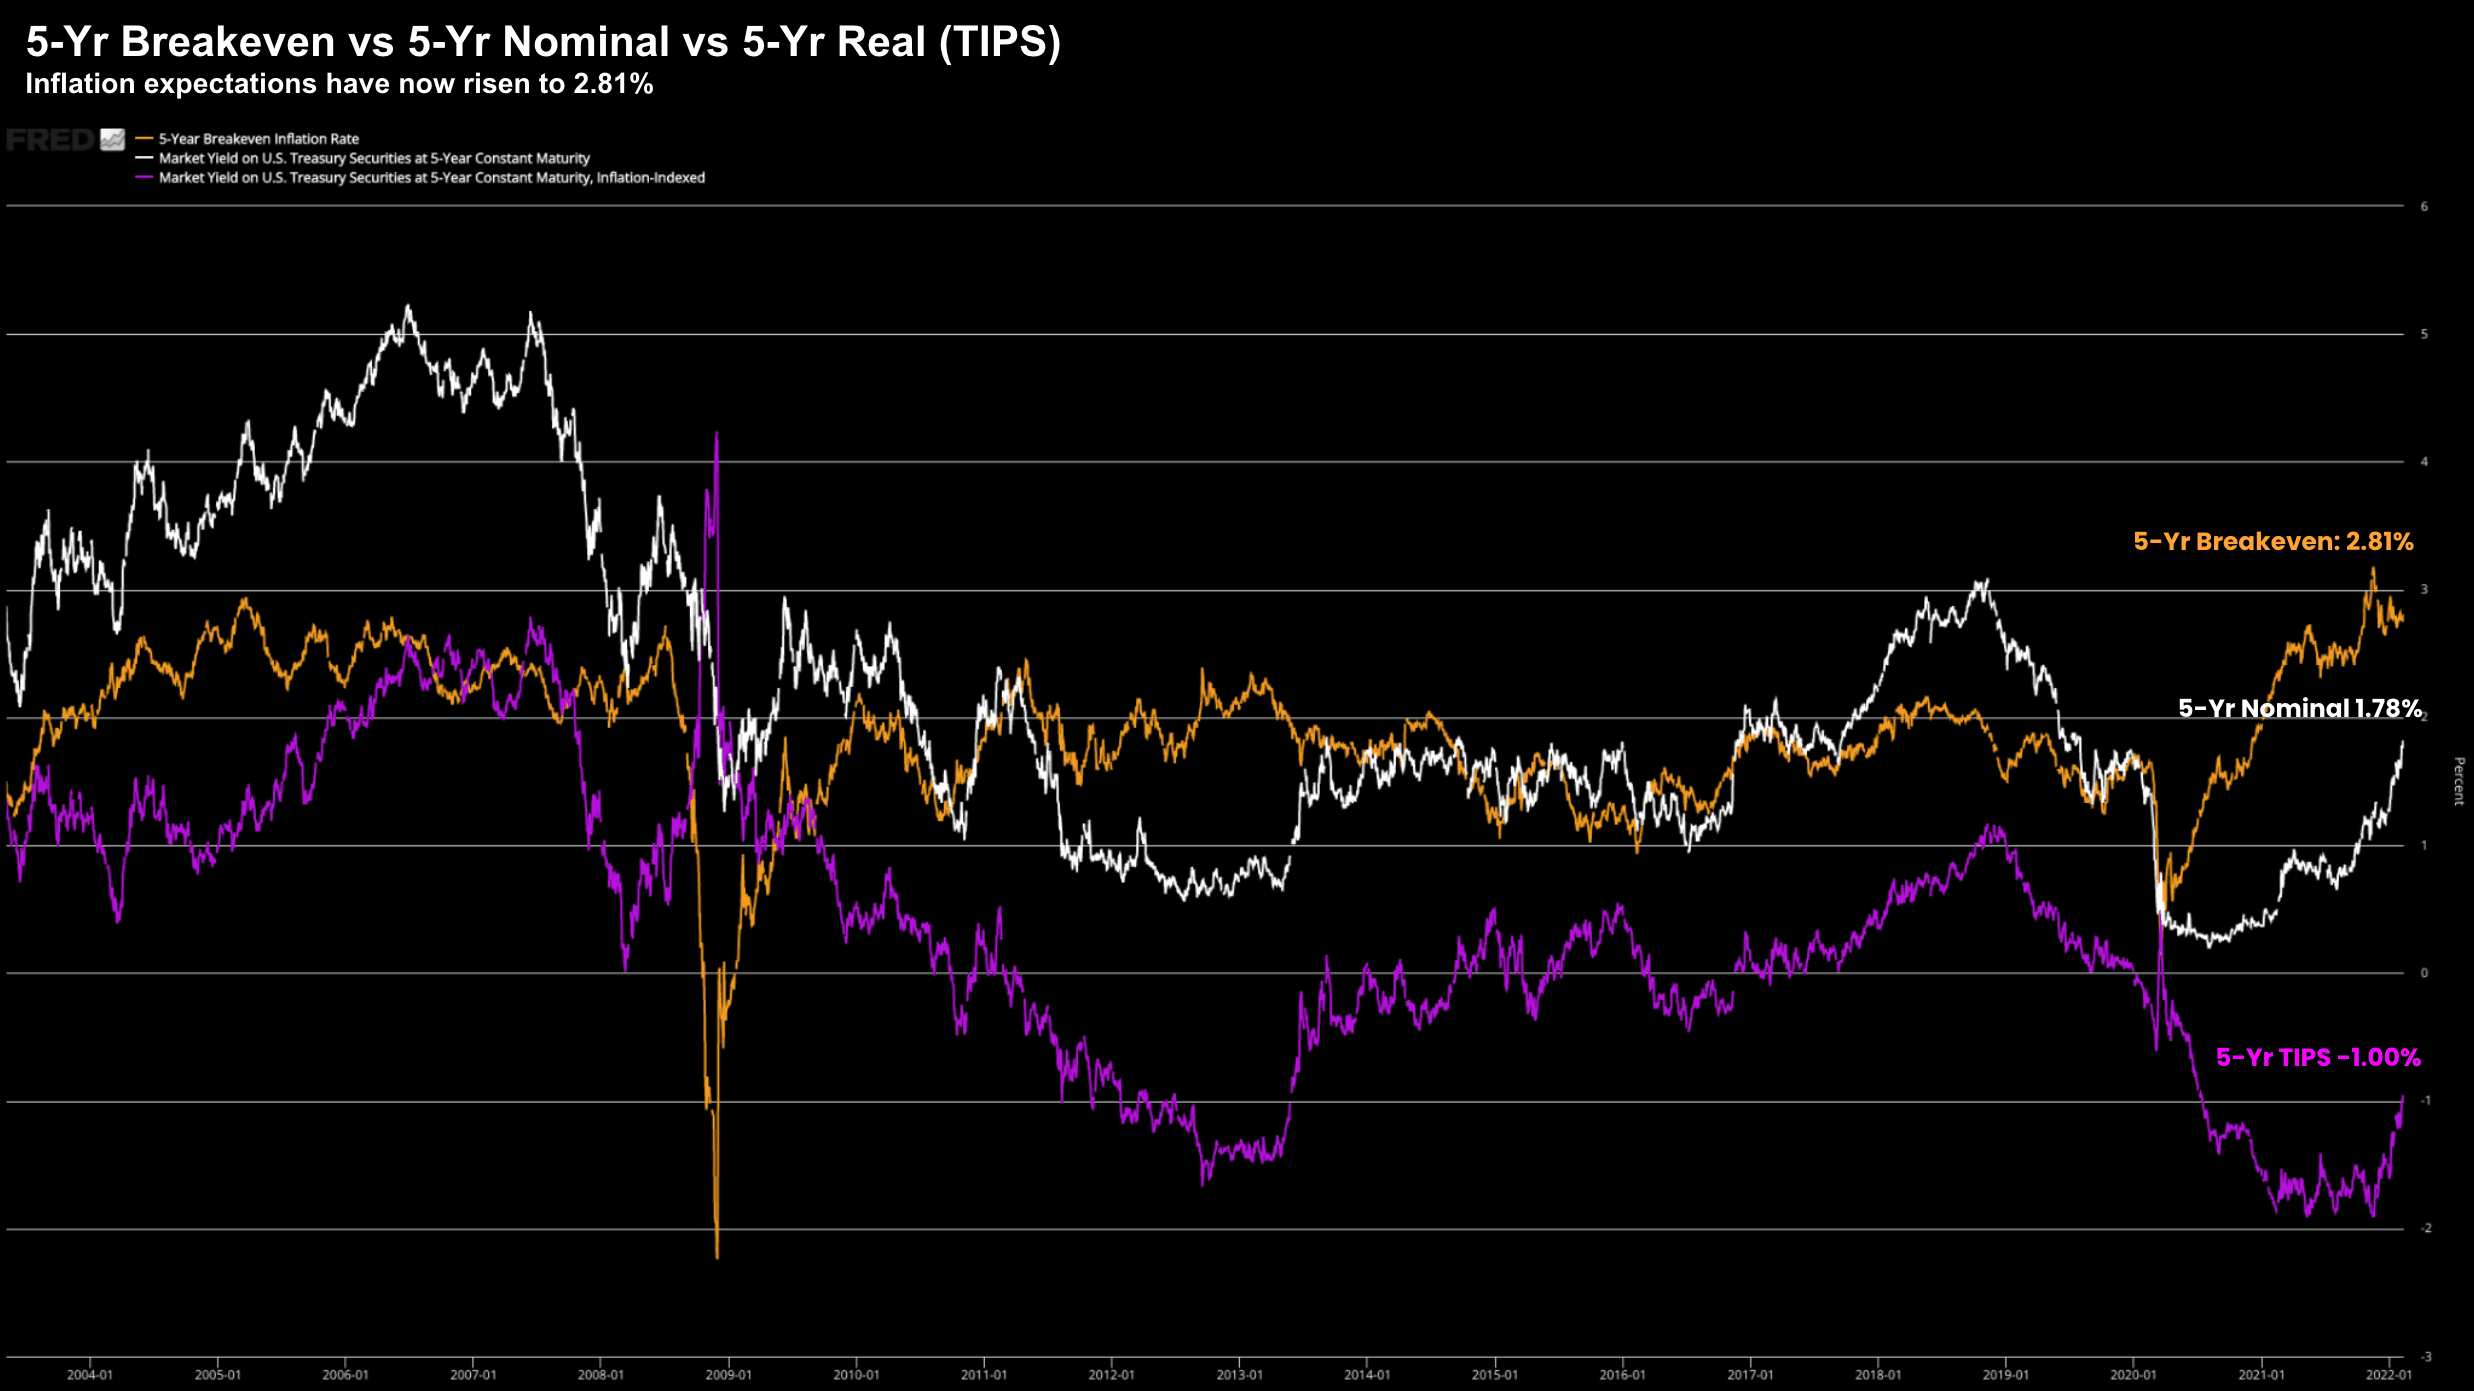
The orange line is what the bond market sees 5-years from now…. marginally above the Fed"s target of 2.0%
Put another way, the (bond) market knows inflation is with us for the next few years.
What"s more, it also believes that inflation will ease.
That puts a lot of faith in the Fed getting things under control… and maybe they will.
However, that also means restoring balance in the supply and demand equation for money.
Fed to Hike 7 Times in 2022
My final chart is the strong move in US 10-year treasuries…
Yields have now moved beyond 2.0%… a strong sign they see aggressive moves from the Fed.
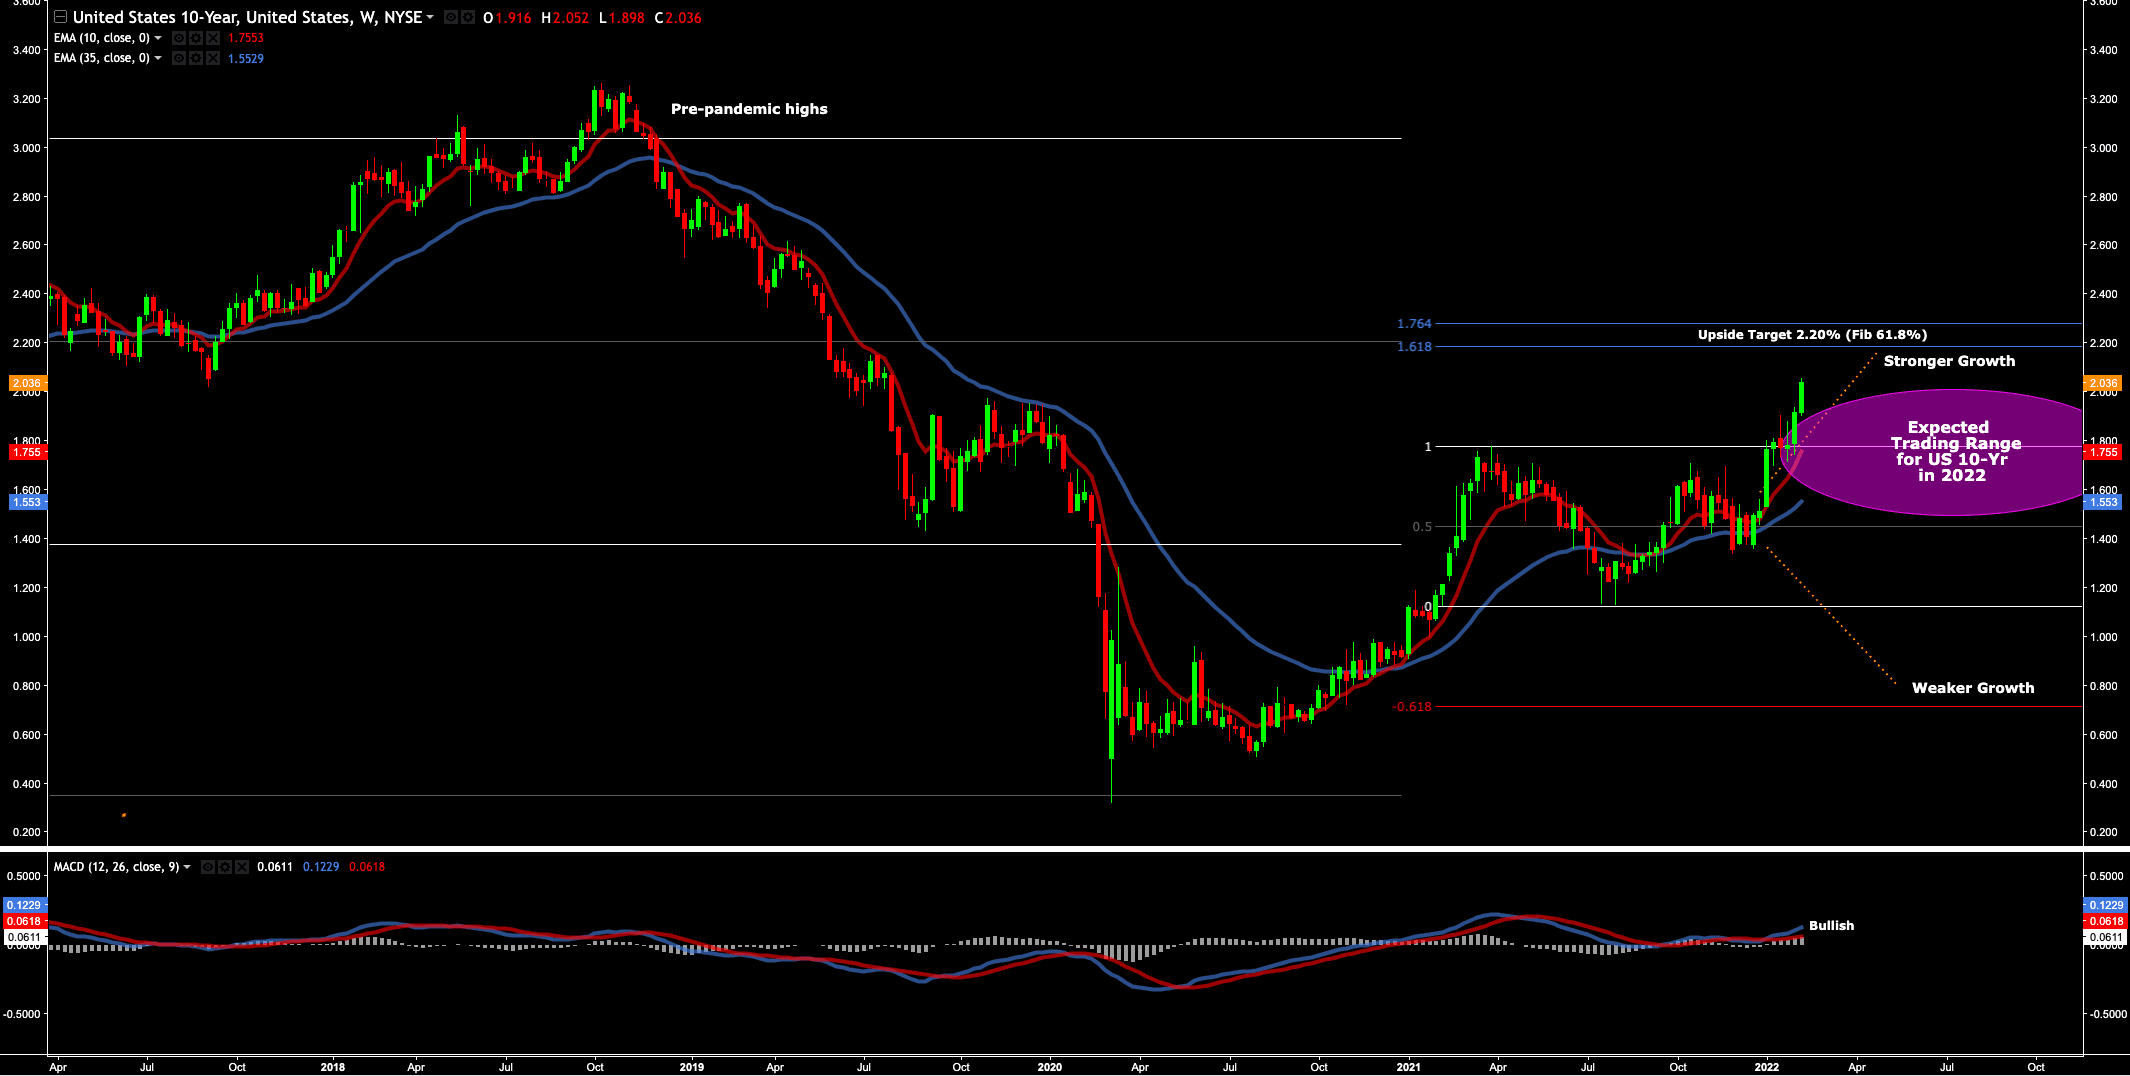
This is the first time that the benchmark rate reached 2% since August 2019.
Yields move inversely to prices and 1 basis point is equal to 0.01%.
The yield on the 2-year Treasury bond, the most sensitive duration to interest rates, surged 26 basis points to top 1.6%.
It marked its biggest single day move since 2009.
But what"s important here is this puts the all-important "2/10 yield curve" at ~40 basis points.
Should this fall below zero… we can start talking about the "R" word.
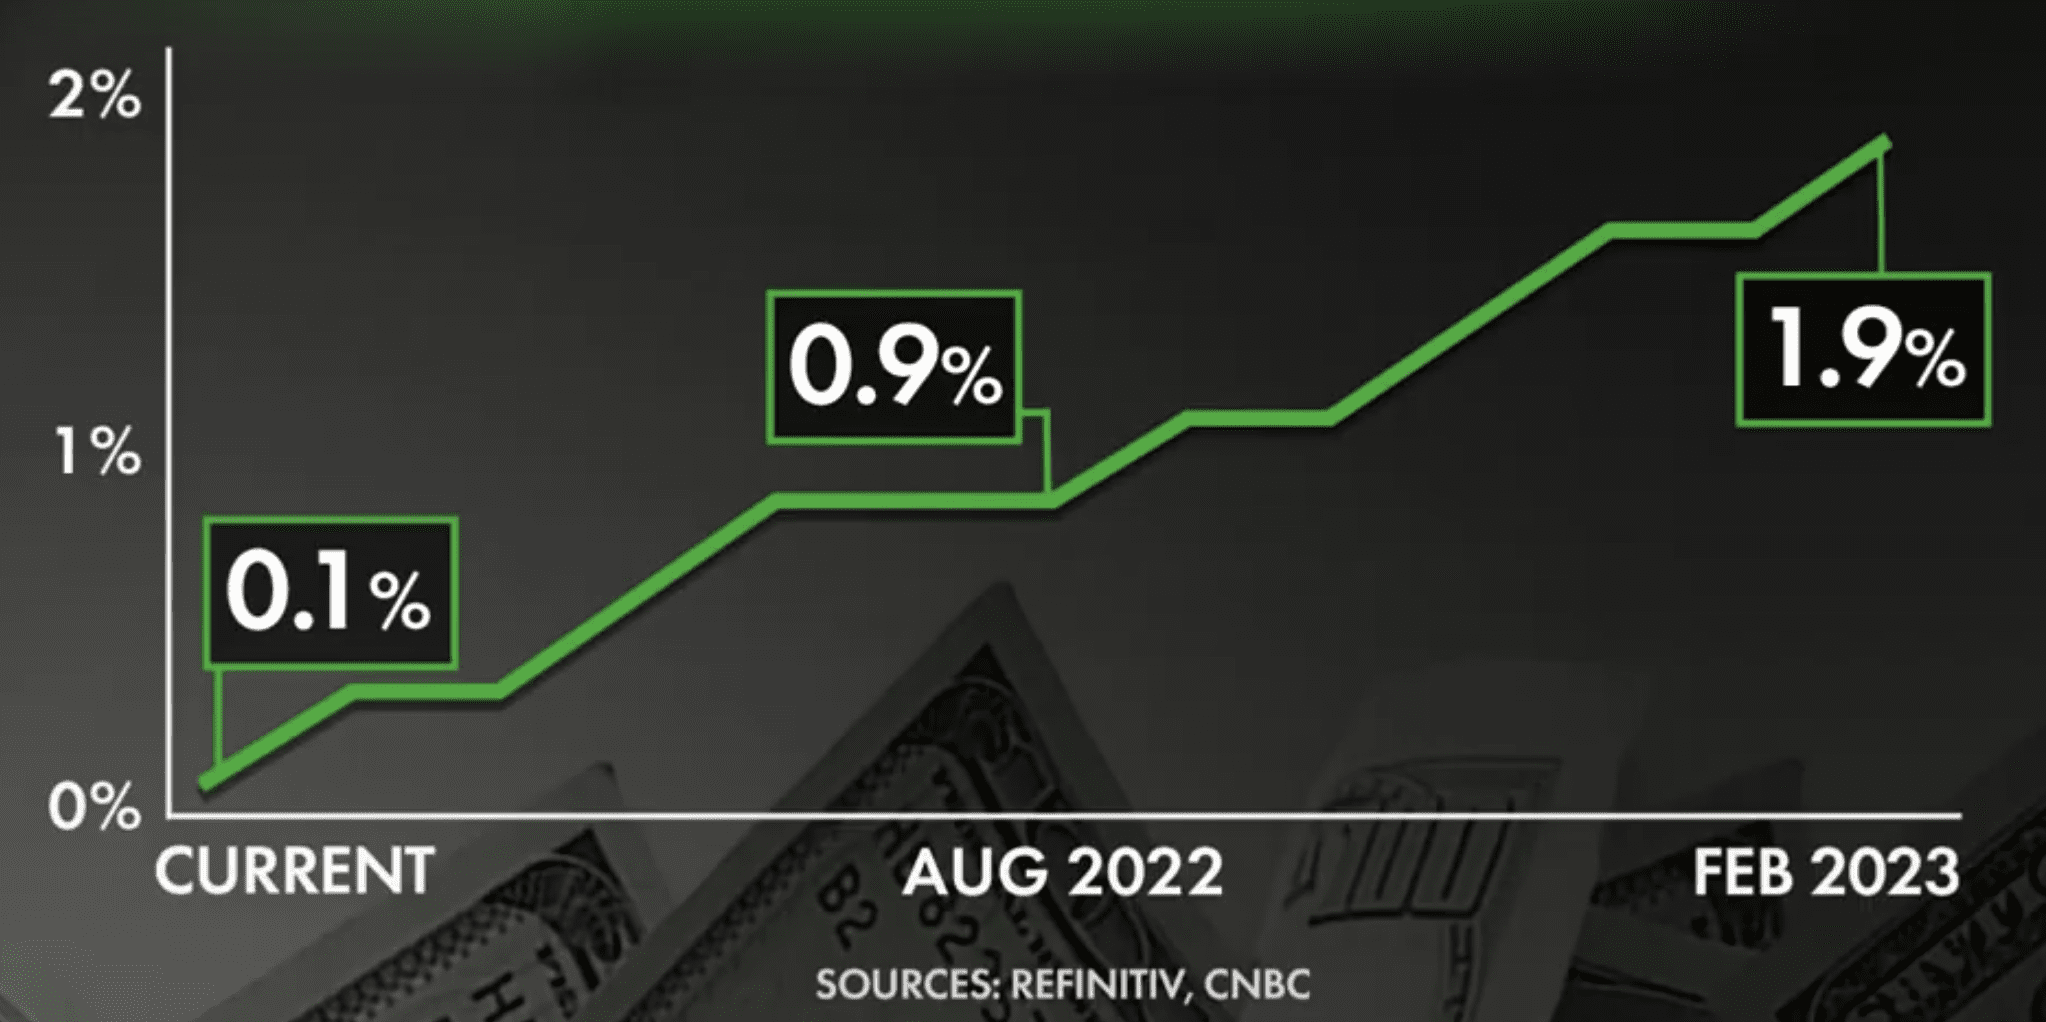
Finally, futures trading as gauged by the CME pointed to a near-100% chance of a 50-basis-point increase at the March meeting.
What"s more, we find a 61% chance that the Fed will hike seven times this year.
If true, this would imply a hike of 25 basis points at every meeting through the end of 2022.
And whilst I think equities are still largely okay with that… how will consumers react?
Putting it All Together…
The supply / demand equation for money is about to shift.
But there"s a lot of work to be done…
The current imbalance is seeing persistent unwanted inflation.
For the balance of 2022 – the Fed will move aggressively to increase (some) demand by raising rates.
However, even assume 7 rate hikes – the real rate will still be negative when adjusted for inflation.
Therefore, we should expect more hikes through 2023.
Increasing rates will take some money out of the system – but not enough.
Balance sheet reduction is coming.
When is the question…
Now I don"t think stock prices will "crash" as a result of the Fed"s tightening this year – as the overhang of QE is still significant.
There"s simply too much liquidity available – and rates are still extremely accommodative by any measure.
However, as we move further into 2023 (or maybe late 2022?) – and we find:
- an inverted yield curve (i.e. 2-year yield exceeds that of the 10-year)
- real short-term rates are above 2.5%; and
- credit spreads start to widen…
… then the risk/reward equation shifts.
And that point, the bar-tab will be closed.
Regards
Adrian Tout