The Big Tech Guidance Gap: Navigating AI CapEx & The Psychology of Valuations
Words: 1,563 Time: 7 Minutes
- Guidance Hesitation: Why the market"s largest players are reluctant to forecast the second half.
- The AI Pivot: Analyzing the first quarterly decline in Microsoft"s CapEx since 2022.
- Psychology vs. Analysis: How to navigate "Mr. Market"s" predictable mood swings with a margin of safety.
Equity markets are experiencing a renewed sense of optimism as trade tensions appear to be de-escalating and Mega-cap technology firms deliver "solid" performance for the recent quarter.
Microsoft (MSFT) surged 8.8%, while Meta Platforms (META) rose 5.4% following robust earnings beats. However, beneath the headline numbers, the details regarding capital allocation tell a more nuanced story.
With respect to MSFT, the critical metric remains Capital Expenditure (CapEx), particularly as it relates to the infrastructure required for Artificial Intelligence (AI). MSFT"s quarterly CapEx was approximately $21.4B—a 5.3% decrease quarter-over-quarter. This represents the first Q/Q decline in their CapEx since 2022.
This raises a pivotal question: are we entering a phase of "AI indigestion" where companies must first solve for efficiency before they can justify further scaling?
Amazon (AMZN) saw a slight decline in post-market trading despite beating expectations across revenue, EPS, and operating income. While cloud growth remained steady (+17% YoY), the real standout was advertising revenue, which grew 19% YoY.
Advertising has become a structural tailwind for Amazon"s bottom line, lifting overall margins by leveraging high-traffic surfaces like Prime Video. This high-margin revenue helps offset the slowing retail segment, where consumers are becoming increasingly cost-conscious. Despite this quality, Amazon"s cautious forward-looking guidance weighed on the share price.
Then we have Apple (AAPL). While iPhone sales exceeded estimates at $46.84B, their high-margin Services division—the primary justification for Apple"s current premium multiple—came in slightly light. Gross margins held at 47.1%, a clear testament to the company"s pricing power and moated ecosystem.
However, the lack of definitive guidance troubled the market. CEO Tim Cook noted that predicting performance beyond the current quarter is difficult given the shifting tariff landscape. As we begin to feel the "lag effects" of policy indecision from earlier in the year, the second half of the year remains clouded by uncertainty. Investors should remain vigilant; while Apple is diversifying its supply chain through India and Vietnam, the cost of transition is a non-negligible headwind.
The Analytical vs. Psychological Guardrails
To be successful in this environment, one must focus on downside protection and the careful weighing of risks. When the S&P 500 was trading above 6,100 earlier this year, many institutions were forecasting a push toward 7,000. However, those projections often lacked a sufficient margin of safety.
History suggests that years following massive rallies often see drawdowns in the 10-15% range as valuations mean-revert. In the current cycle, we are seeing two distinct sources of market misjudgment:
1. Analytical Misweighing: Applying incorrect data or flawed processes to valuation, often ignoring the historical ceiling for price-to-earnings multiples.
2. Psychological Bias: Succumbing to a "Lollapalooza effect" of greed, social proof (conformity), and over-optimism, which drives prices far beyond intrinsic value.
When herd psychology is at its peak, we see short-run outcomes diverge violently from long-run probabilities. This results in "multiple expansion," where the price paid for a stock grows significantly faster than the underlying earnings. The following FactSet chart illustrates this growing gap:
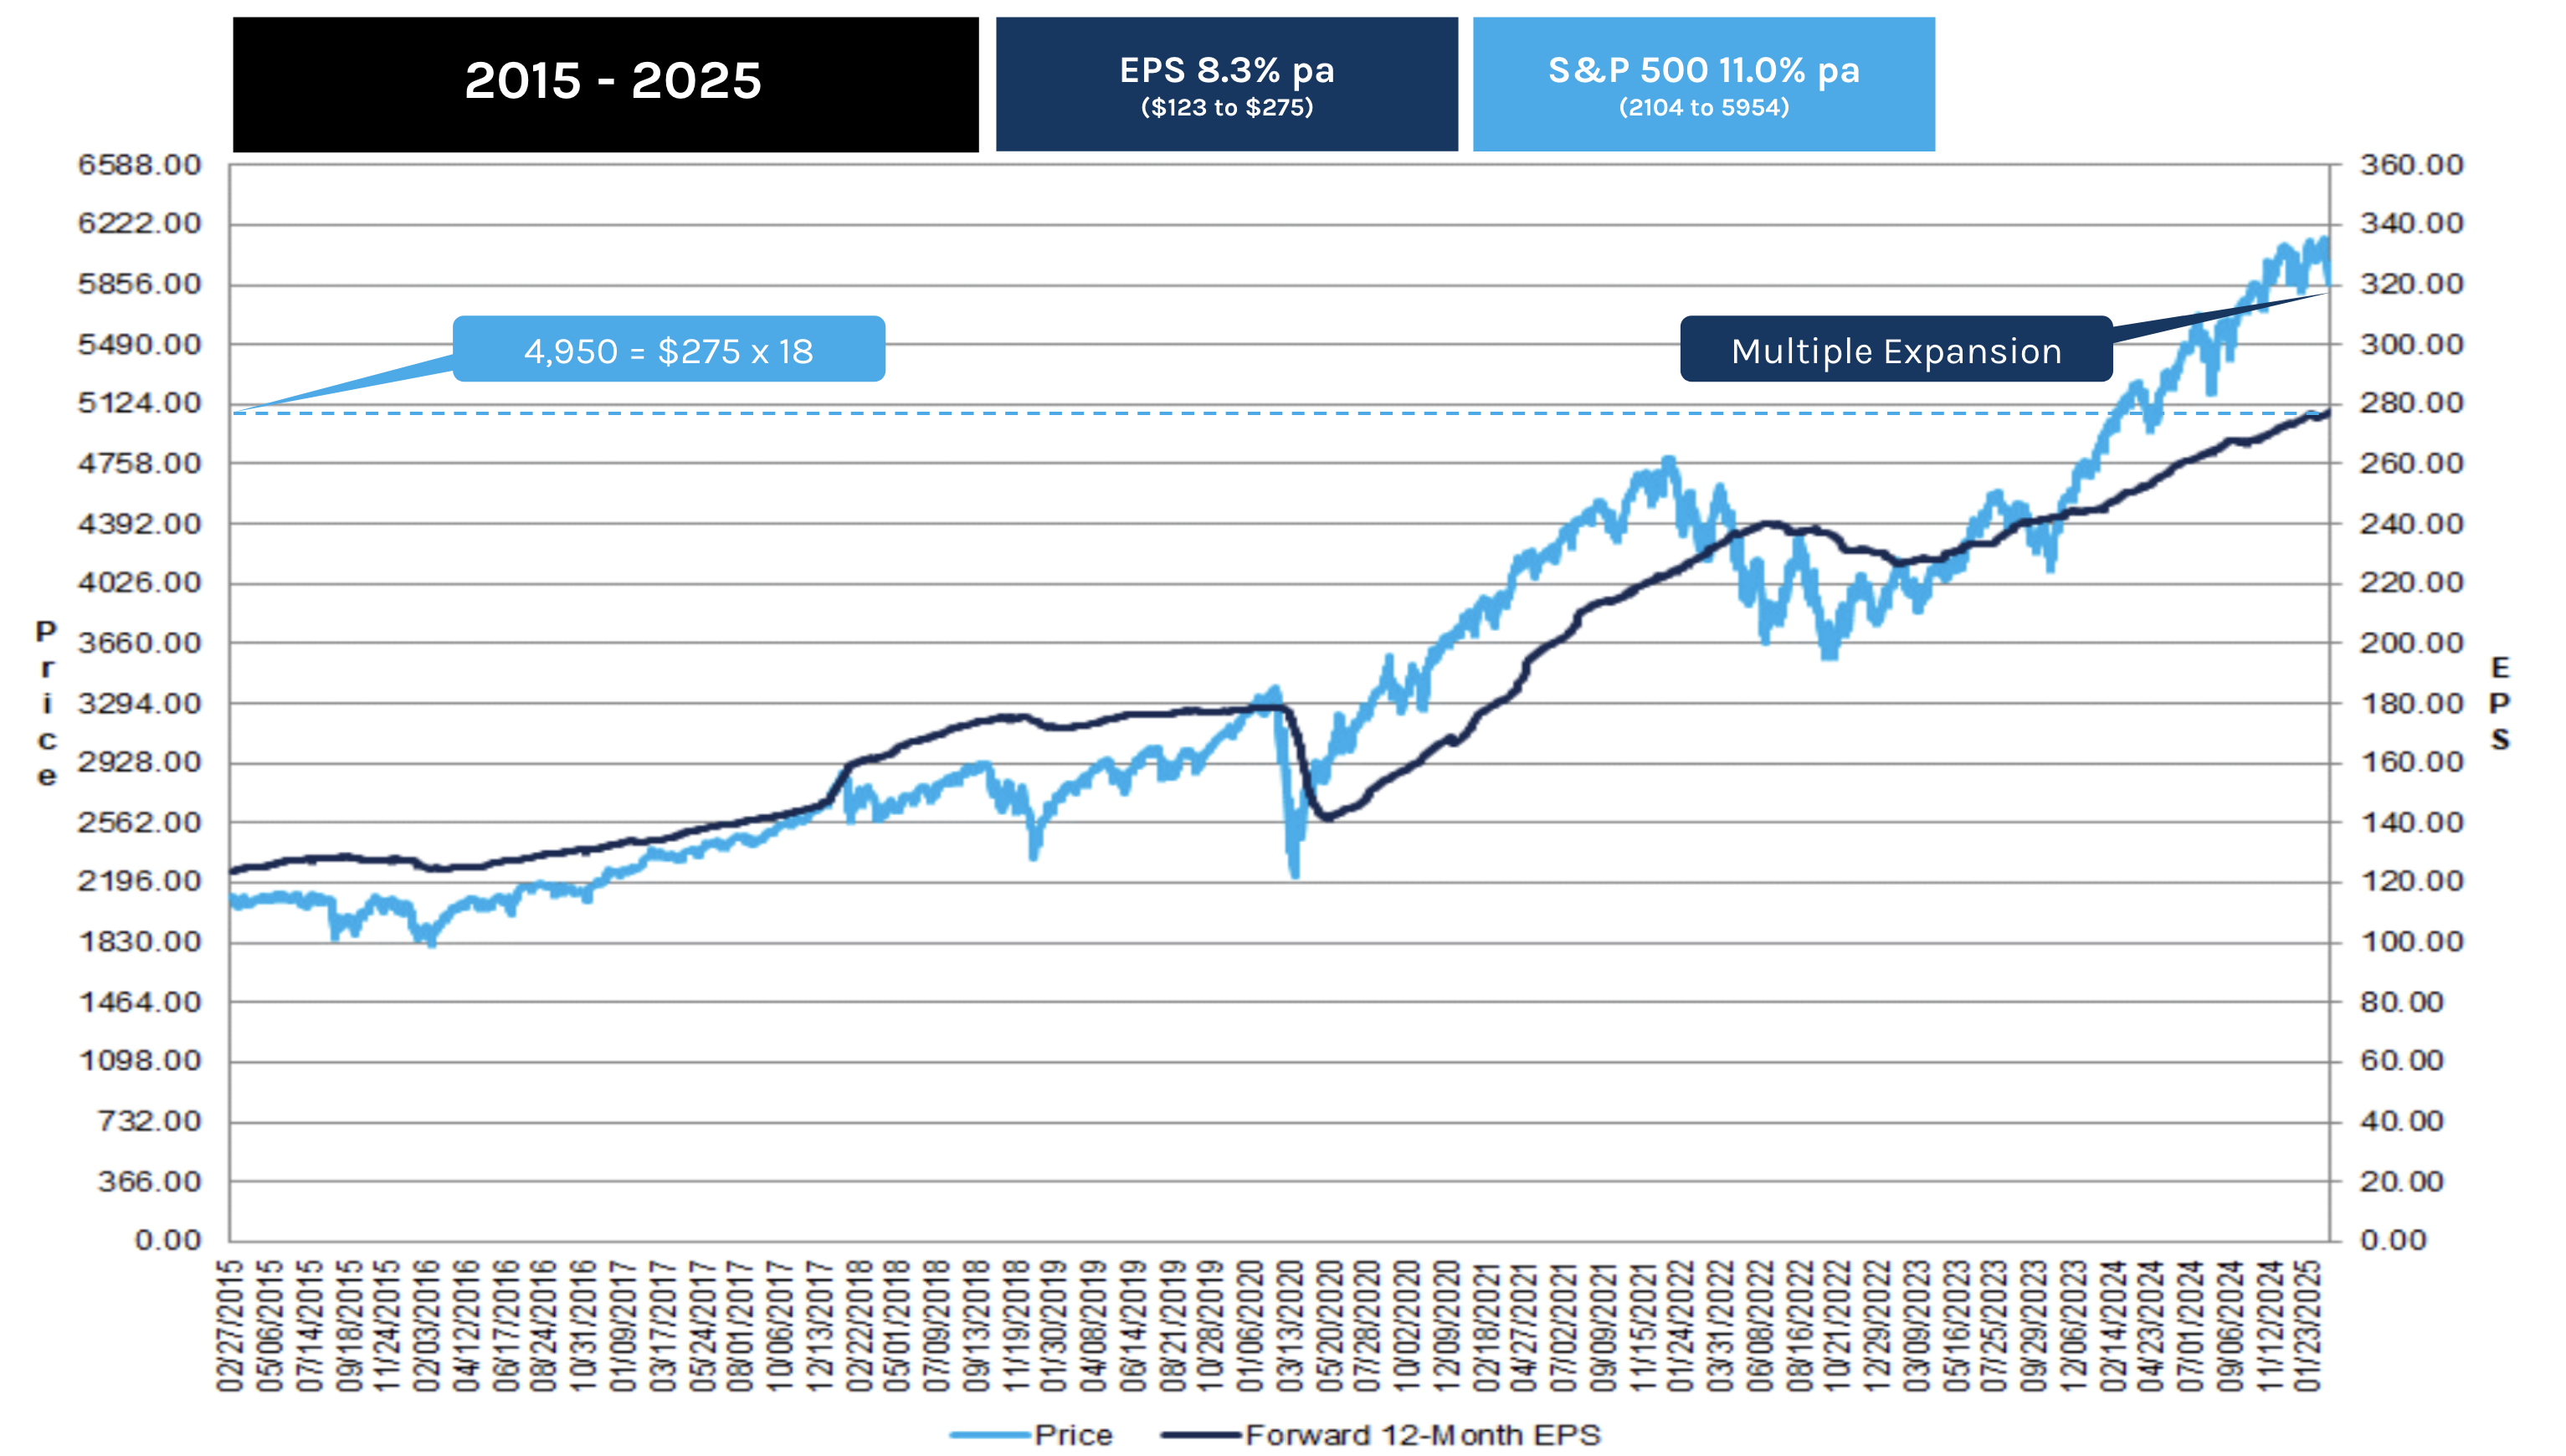
Market corrections, like the recent dip below 4,900, are simply the mechanism by which price attempts to reconnect with the reality of the earnings trend.
Mastering "Mr. Market"s" Mood Swings
Successful investing is arguably 20% analytical and 80% psychological. While basic financial literacy (understanding the 55/30/25 margin model or ROIC) is a prerequisite, the ability to maintain a rational temperament is what separates superior investors from the average.
Earlier this year, the push to 6,100 was not driven by rising earnings estimates—in many cases, estimates were being revised downward. Instead, it was driven by multiple expansion. Investors were willing to pay a massive premium for the same dollar of earnings.
As Howard Marks notes in "The Most Important Thing":
"Average investors are fortunate if they can avoid pitfalls, whereas superior investors look to take advantage of them."
When fear drives prices below intrinsic value—such as a high-quality, moated asset like Alphabet trading at 15x-16x forward earnings—the superior investor looks to capitalize. Conversely, when greed pushes the market to pay 33x for the same quality, the superior investor seeks to reduce exposure or actively hedge. Recognizing this gap between price and value is the only way to generate alpha over the long term.
S&P 500: The Long-Term Monthly Perspective
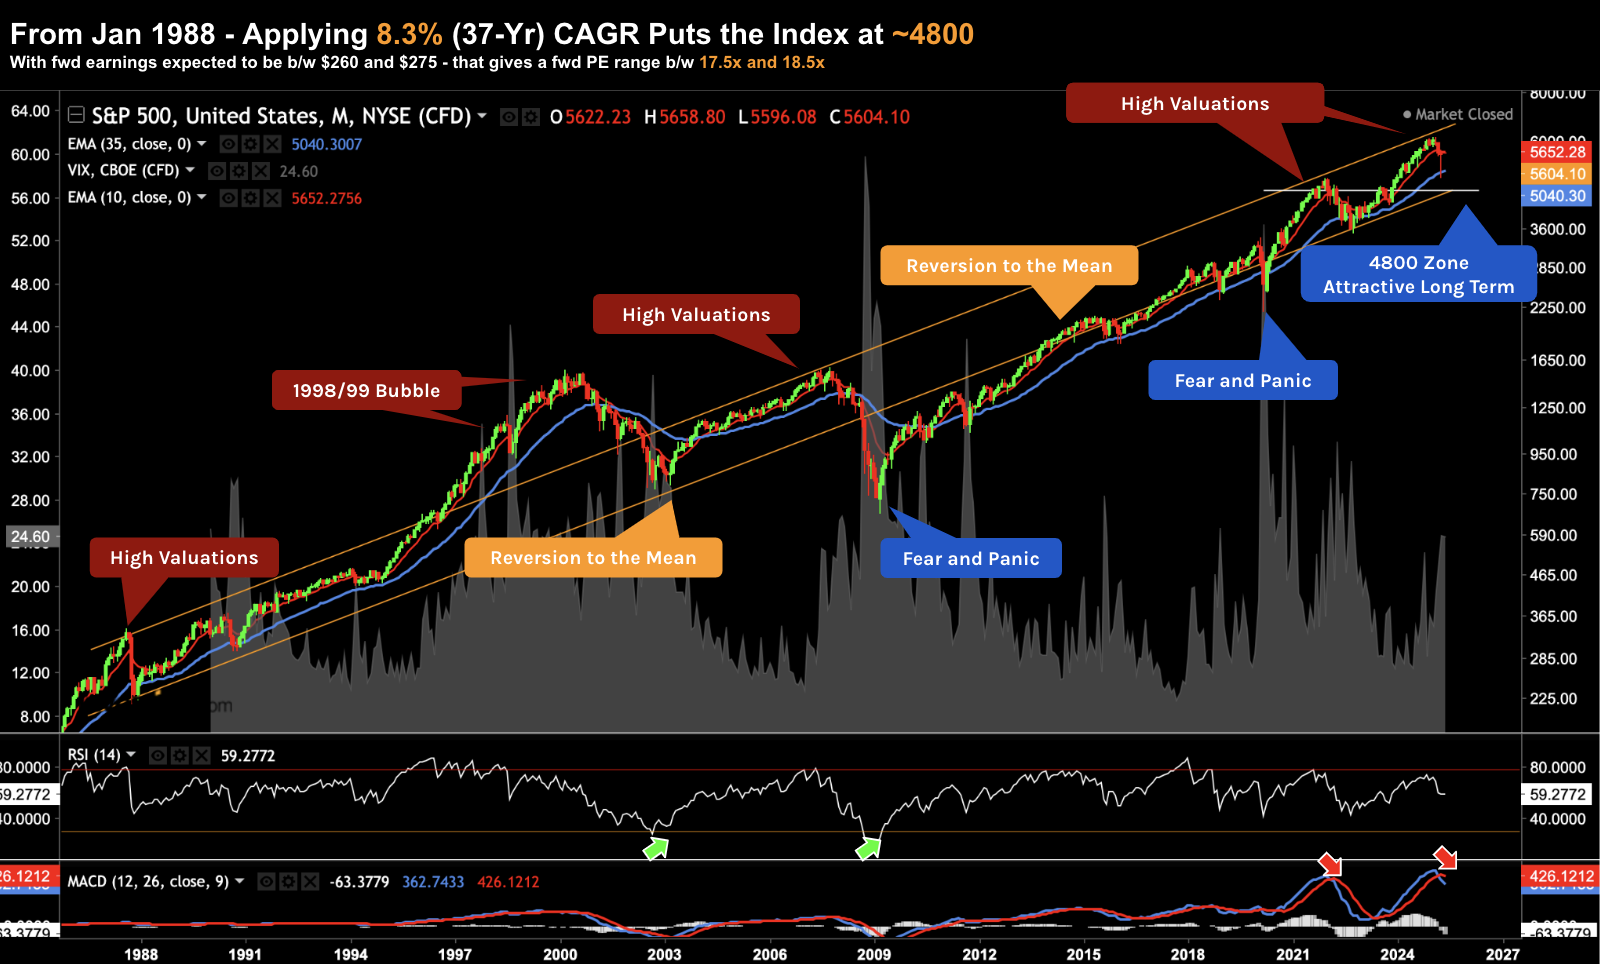
Reviewing the monthly chart is essential for filtering out short-term noise and understanding the larger cycles of market inefficiency. If we apply an 8.3% CAGR (the long-running mean) to the S&P 500 from 1988, we arrive at a current fair-value estimate of roughly 4800.
When combined with the average 2.0% dividend yield, this aligns with the index"s historical total return of approximately 10.3%. As the chart below indicates, the market frequently oscillates above and below this mean:
Technical Analysis: May 2025
The lower orange trend line represents that 8.3% CAGR baseline. When the market exceeds the upper band—as it did during the 1999 bubble and again late last year—investors are overpaying for growth. At the start of this year, Forward PE ratios were stretched toward 23x.
A return to the 4800–4900 zone represents a test of the long-running mean, offering a much more attractive risk-reward profile. Should a recessionary event push the index toward 4500, it would represent a significant discount to the mean—providing a major opportunity for those with the firepower to act.
Strategic Conclusion
Rationality is the bedrock of investment success. Being rational means refusing to pay 33x forward earnings for a company—no matter the quality—when the historical average is closer to 18x. It also means refusing to sell high-quality assets during a plunge when the forward multiple drops to a compelling 15x-20x range.
Superior investors operate strictly within their circle of competence and maintain the discipline to:
- Avoid the herd-driven panic of selling at the bottom by ensuring they reduced exposure when others were greedy.
- Maintain buying power to capitalize on high-quality moated assets when they trade at or below their long-term mean.
While we were recently given a brief window to add exposure below 4,900, the high level of uncertainty surrounding H2 guidance suggests another opportunity may be on the horizon. Always remember: the price you pay determines your ultimate return, far more than the quality of the asset itself.