Nothing Changes after Today’s Surge Higher
- Expect sharp rallies – but will they stick?
- Market still has a lot to prove technically; and
- Why I "nibbled" at a classic falling knife?
The major averages staged a sharp rebound today as commodities cooled their heels…
At the time of writing – WTI crude trades at $108 a barrel.
It topped $130 just two days ago… that"s a 17% decline.
That didn"t stop gas prices rising again today.
In San Rafael (California) – pump prices went from US$5.60 yesterday to US$6.00 a gallon (~AUD $2.15 per litre)
I believe the national average across the US is closer to $4.00 a gallon… expected to reach $4.50 in the coming months.
The S&P 500 rallied 2.5% for its best day since June 2020.
However, the "oversold" Nasdaq Composite surged 3.6% for its best day since November 2020.
And maybe tech will see more upside tomorrow with Amazon announcing a 20-for-1 stock split and a new $10B buyback.
Its stock was up around 6% after-hours on the news (despite nothing changing fundamentally)
Despite today"s rebound – major averages are still in the red year to date.
To that end, they have plenty of work to do.
My quick take is sharp bounces like today are not unexpected in (bearish) markets.
Nothing rises or falls in a straight line.
And these furious rallies can last for 3 or 4 days… with many people thinking the bottom is in.
From mine, until the technical damage is repaired…. the market will generally use these rallies to sell stocks.
Only time will tell if the bottom is really in.
Nothing Changes
From a fundamental lens – my best guess for a near-term market bottom in the zone of 4,000.
For example, at 4,100 the forward PE for the S&P 500 is around 18x (if we assume S&P 500 earnings of around $230)
And at 4,000 the forward PE falls to just 17x – a multiple we have not seen in many years.
Two things here:
- With interest rates likely to remain deeply negative over the next 12 months (at least); and
- ~$9 Trillion remaining on the Fed"s balance sheet for 2022…
… that is generally supportive of a forward PE ratio of 17x.
That"s not expensive…
However, if rates were to "normalize" at say 4-5% (and where they should be) – yes – a PE of 17x would be high.
Put it this way:
The equity risk premium for stocks will shift over time as the monetary policy tightens.
What you will find is that multiple contraction will continue – which is what we have seen this year.
For example, so far we have seen zero impact to earnings… but prices have come down.
Why?
This is not due to any change in the operational performance of the business (most are in phenomenal shape) – but rather the expectation of future earnings and what people are prepared to pay.
Last year paying 21x forward was not a problem.
Now that"s seen as a large premium in the face of less monetary accommodation.
Therefore, as an investor, your focus shifts very much to quality.
Can the Fed "Softly" Land the "QE" Plane?
Tomorrow we get the latest read on monthly CPI.
Consensus economists are looking for the headline CPI to accelerate to show a 7.9% year-over-year increase, rising further from January"s 7.5% rise, according to Bloomberg.
Such a result would set a fresh 40-year high rate of inflation.
Excluding volatile food and energy prices, the CPI is likely to rise 6.4%, compared to January"s 6.0% increase.
However as I wrote the other week – I see CPI exceeding 10% in the coming months given the Fed"s tepid approach on rate increases and quantitative tightening.
CPI above 7% is only going to force their hand.
But think about this for a moment…
If you look back at the past 25 years (essentially my entire working life) – the highest CPI ex food and energy print (i.e. Core PCE) was ~4-5% in 1988.
But it was fleeting (see green line below). For the most part, it was never really been above 3.0%

March 09 2022
Which begs the question:
When was the last time the Fed were forced to cool down a white-hot inflation scenario opposite slowing growth?
It was the late 70s and early 80s.
Here"s the chart for inflation vs short-term rates over 14 years from 1972:

March 09 2022
Interest rates (white) hit 19% (left-hand side axis) as CPI (orange) reached levels of almost 15% (right-hand side axis). Core PCE is shown in pink (right-hand side axis)
Not surprisingly – stocks didn"t react favourably to sharply higher rates:

For example, when rates peaked in 1974 at 13% – and CPI at 11.5% – stocks plunged 50%.
And in 1982 – stocks crashed to the tune of 28% – after rates peaked at 19% (above that of inflation)
Now I am not saying stocks are about to plunge 50%… not at all.
But I think over the next couple of years – as the Fed tries to softly land the "QE" plane – it"s going to be hard to do without some form of meaningful adjustment in asset prices.
And we have not seen that yet…
The other parallel of course is how growth is slowing (i.e. what we also saw in the 1970s)
This is the worst combination the Fed could want; i.e. slowing growth with higher (unwanted) inflation.
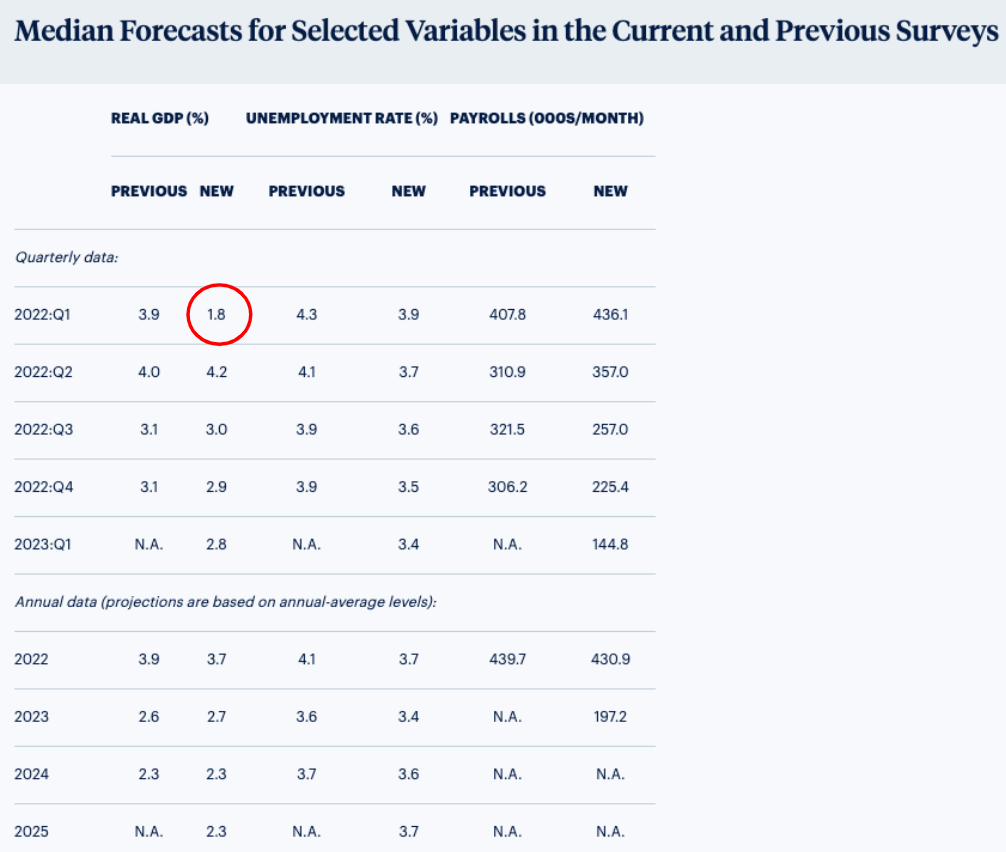
Take this (Feb 11) survey from the Philly Fed.
Growth revisions for Q1 have fallen from 3.9% to just 1.8%.

However, that was before the Russia / Ukraine conflict; massive implications across Europe and $100+ oil.
My guess – this quarter will be closer to 0.50 to 1.0% GDP growth.
Which brings me to earnings revisions (and risk)…
Earnings Likely to be Revised Lower
Given the growth outlook and impacts of inflation – it"s likely we see lower earnings estimates.
Combined with lower multiples due to Fed hikes – it follows that stock prices will adjust.
But the question is how much?
In the near-term I think 4,000 is a reasonable valuation for the the S&P 500 (and will attract money)
And anything south of 4,000 will remain a good long-term opportunity.
But we need to be mindful of the increasing equity risk premium should the market rally back to levels of 4800.
Putting it all Together
Before I close, one reader reached out and was curious as to why I would buy a "falling knife" like Shopify.
It"s a great question.
If I were to purely apply a technical lens to the trade – probabilities suggest we should expect more downside.
There is nothing bullish about the chart… where the next support level is perhaps $300 (~40% lower than my entry price)
But there are occasions where the fundamental picture and technical picture do not align.
Now ideally we get both to line up… but that"s going to be difficult in this climate.
For example, I would like to see a stock find support if trending lower – form a base – and show clear signs of a new emerging bullish trend.
In this case, I use the technical view to refine my entry.
And assuming it was a high quality stock (like SHOP) – I would have a higher conviction level on the trade (i.e., in turn risking more of my equity).
In this case, I felt strongly about the fundamentals of the business – but the technical picture wasn"t supportive.
And typically buying a "falling knife" will see prices go lower (as I indicated).
Therefore, I chose to allocate a small amount of capital (i.e. 1% of my total) on the expectation it was likely to fall further.
Note: I never risk losing more than 2% of my total capital on any single trade. Therefore, SHOP could fall to zero (which is most unlikely) – I have only lost 1% of my total capital.
Now maybe the 71% fall in Shopify from its peak will be the low?
I don"t know – it"s impossible to time a bottom.
In my case, it"s only luck if I do.
Today it closed up ~14% at $587 (after my post) – so perhaps a few folks followed my trade?
But tomorrow it could be back below $500 – it"s that kind of market with a VIX above 30.
In closing, ideally I want a larger position size in Shopify.
As I say, it"s a very strong business which is winning in the eCommerce market. It"s generating cash and strong margins and growth.
But I need to see the technical set-up support my conviction when it comes to allocating more capital.
Today that"s not the case..
And should the trend shift (and at some point it will) – I will most likely add to my position (even if it"s at a higher price)
