Can Consumers Continue to ‘Shop ’til they Drop’?

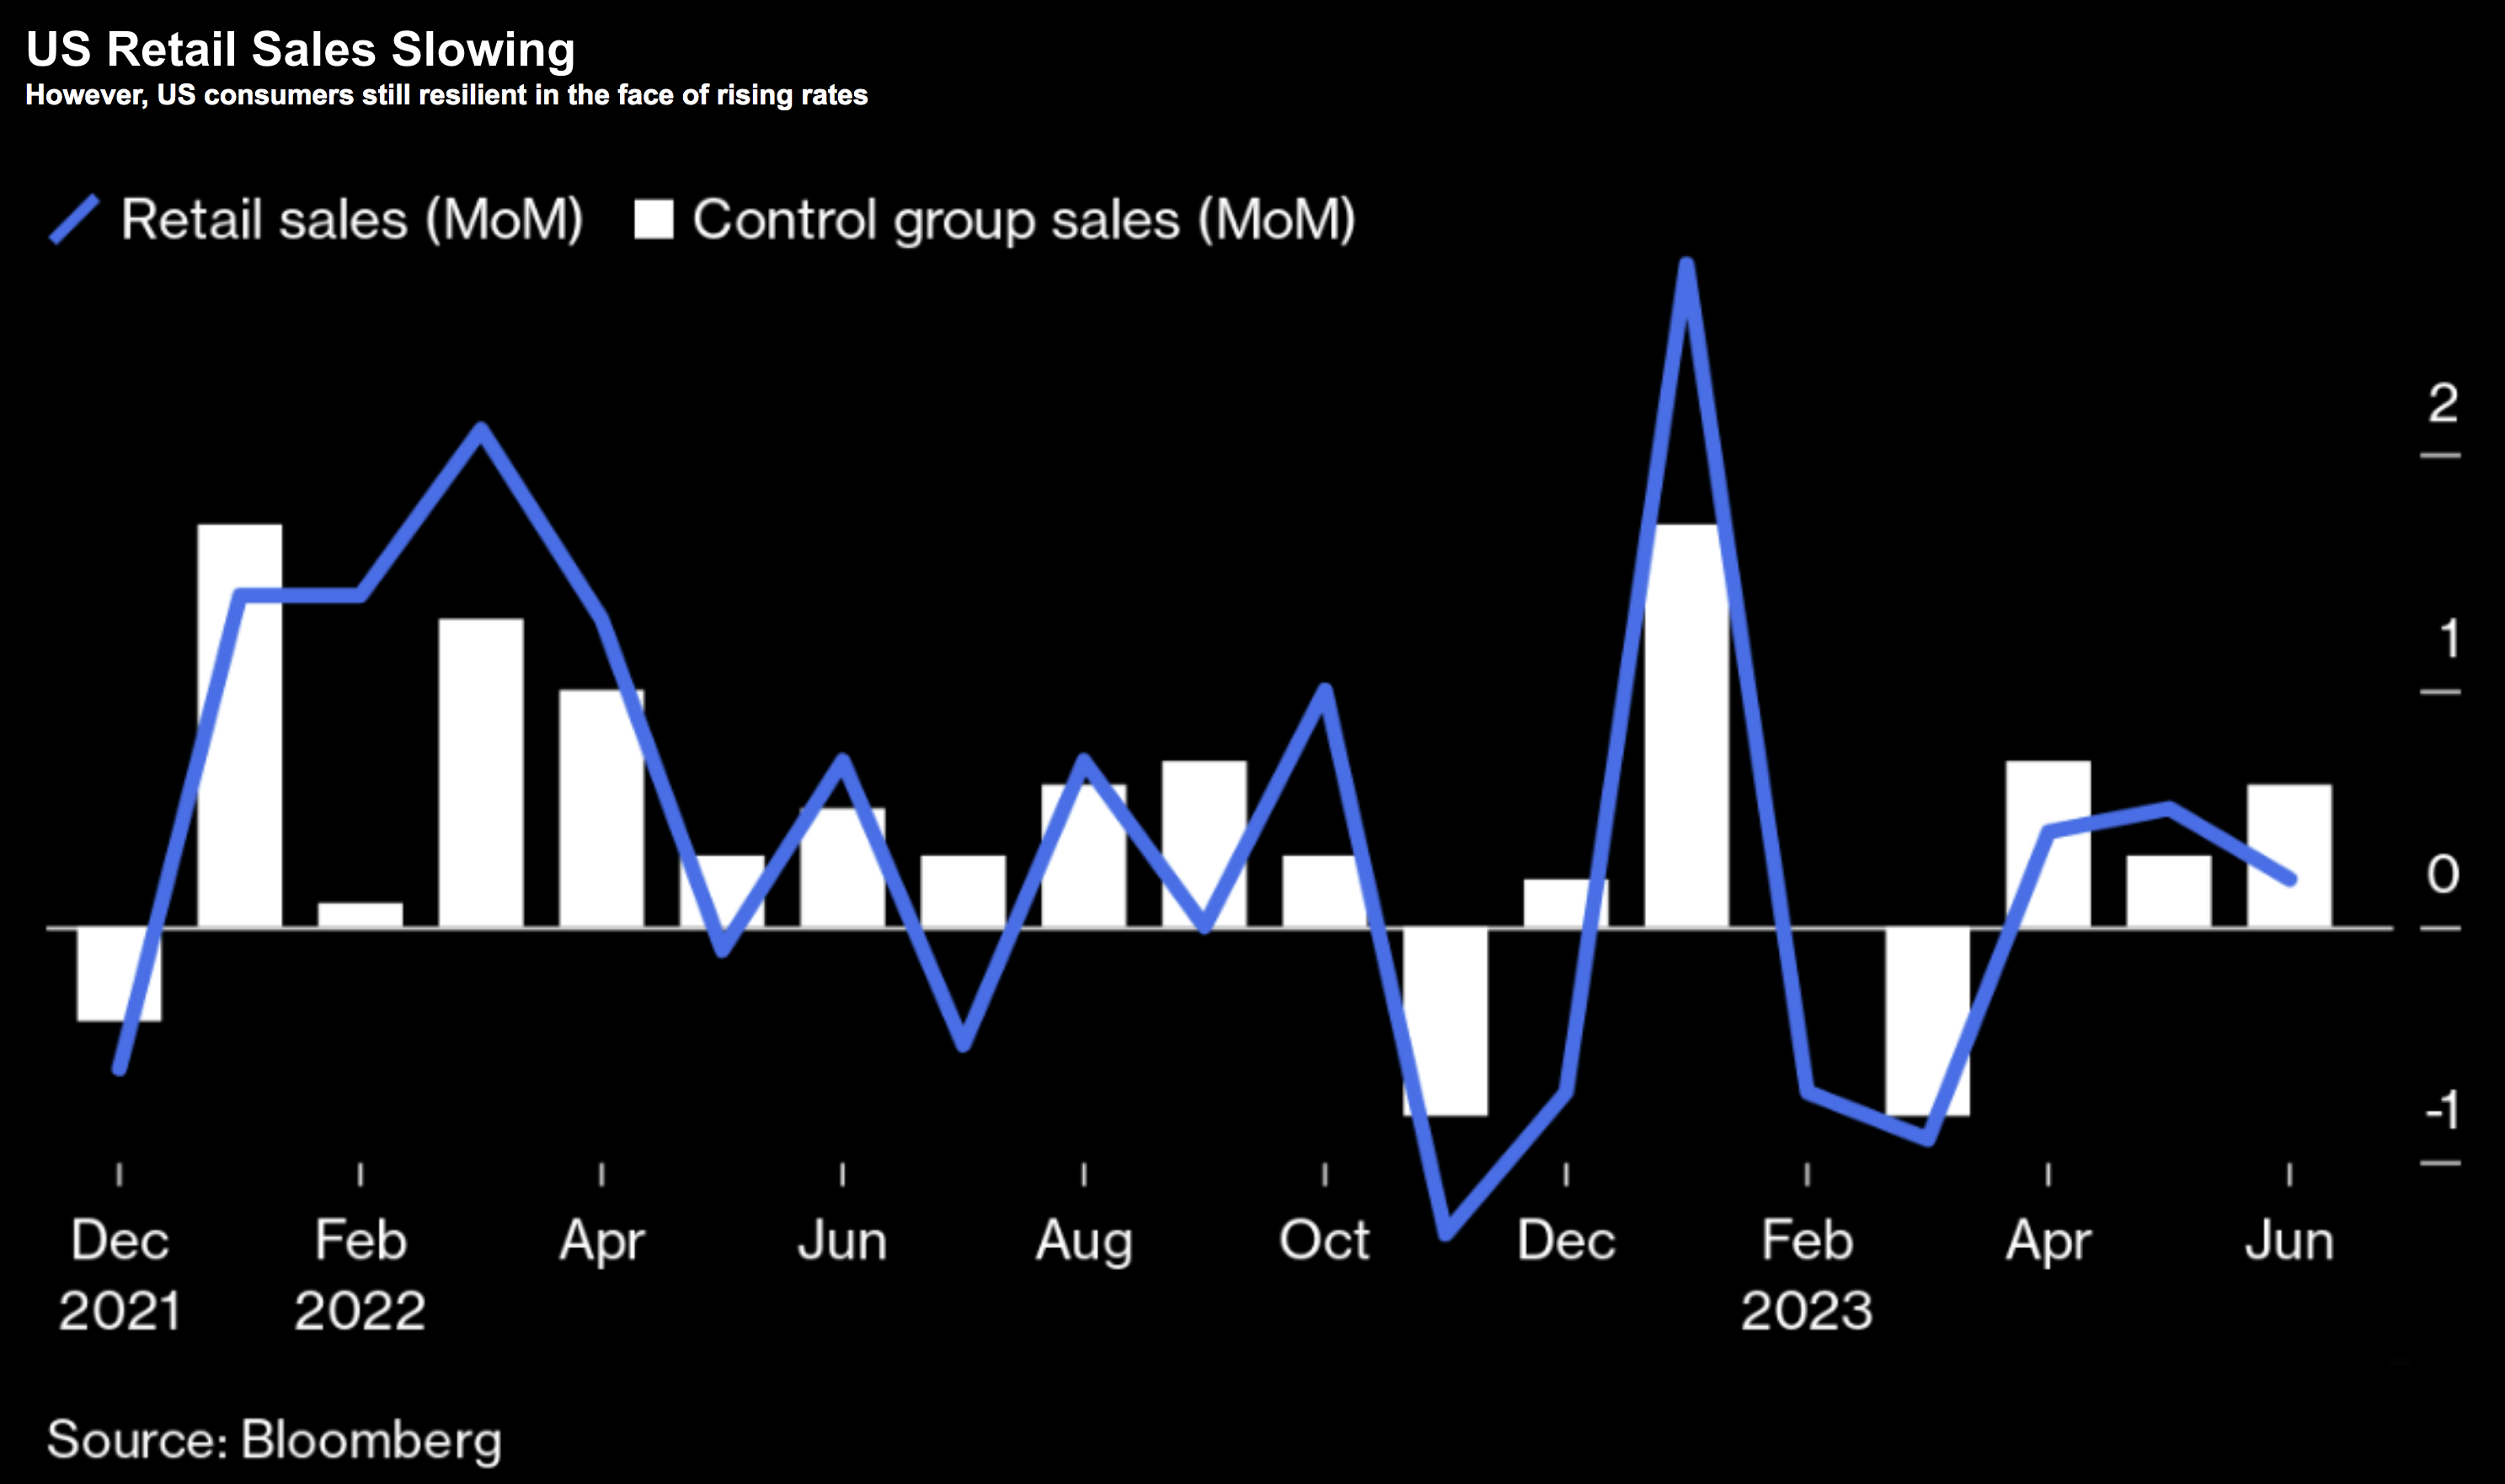
Never underestimate the US consumer's willingness to spend. And from mine, that's been the story of this year. Consumers have used whatever means available to spend, spend, spend. With ~70% of US GDP consumption based - that has also meant the economy managed to keep its head above water. But what does it look like going forward?Do consumers still have ultra-strong balance sheets to keep it up? And are rates eventually going to bite? I ask this because if US consumers are closer to maxing out their credit cards (with more than $1T in debt)... the odds of a recession sharply increase.
What Banking Crisis?

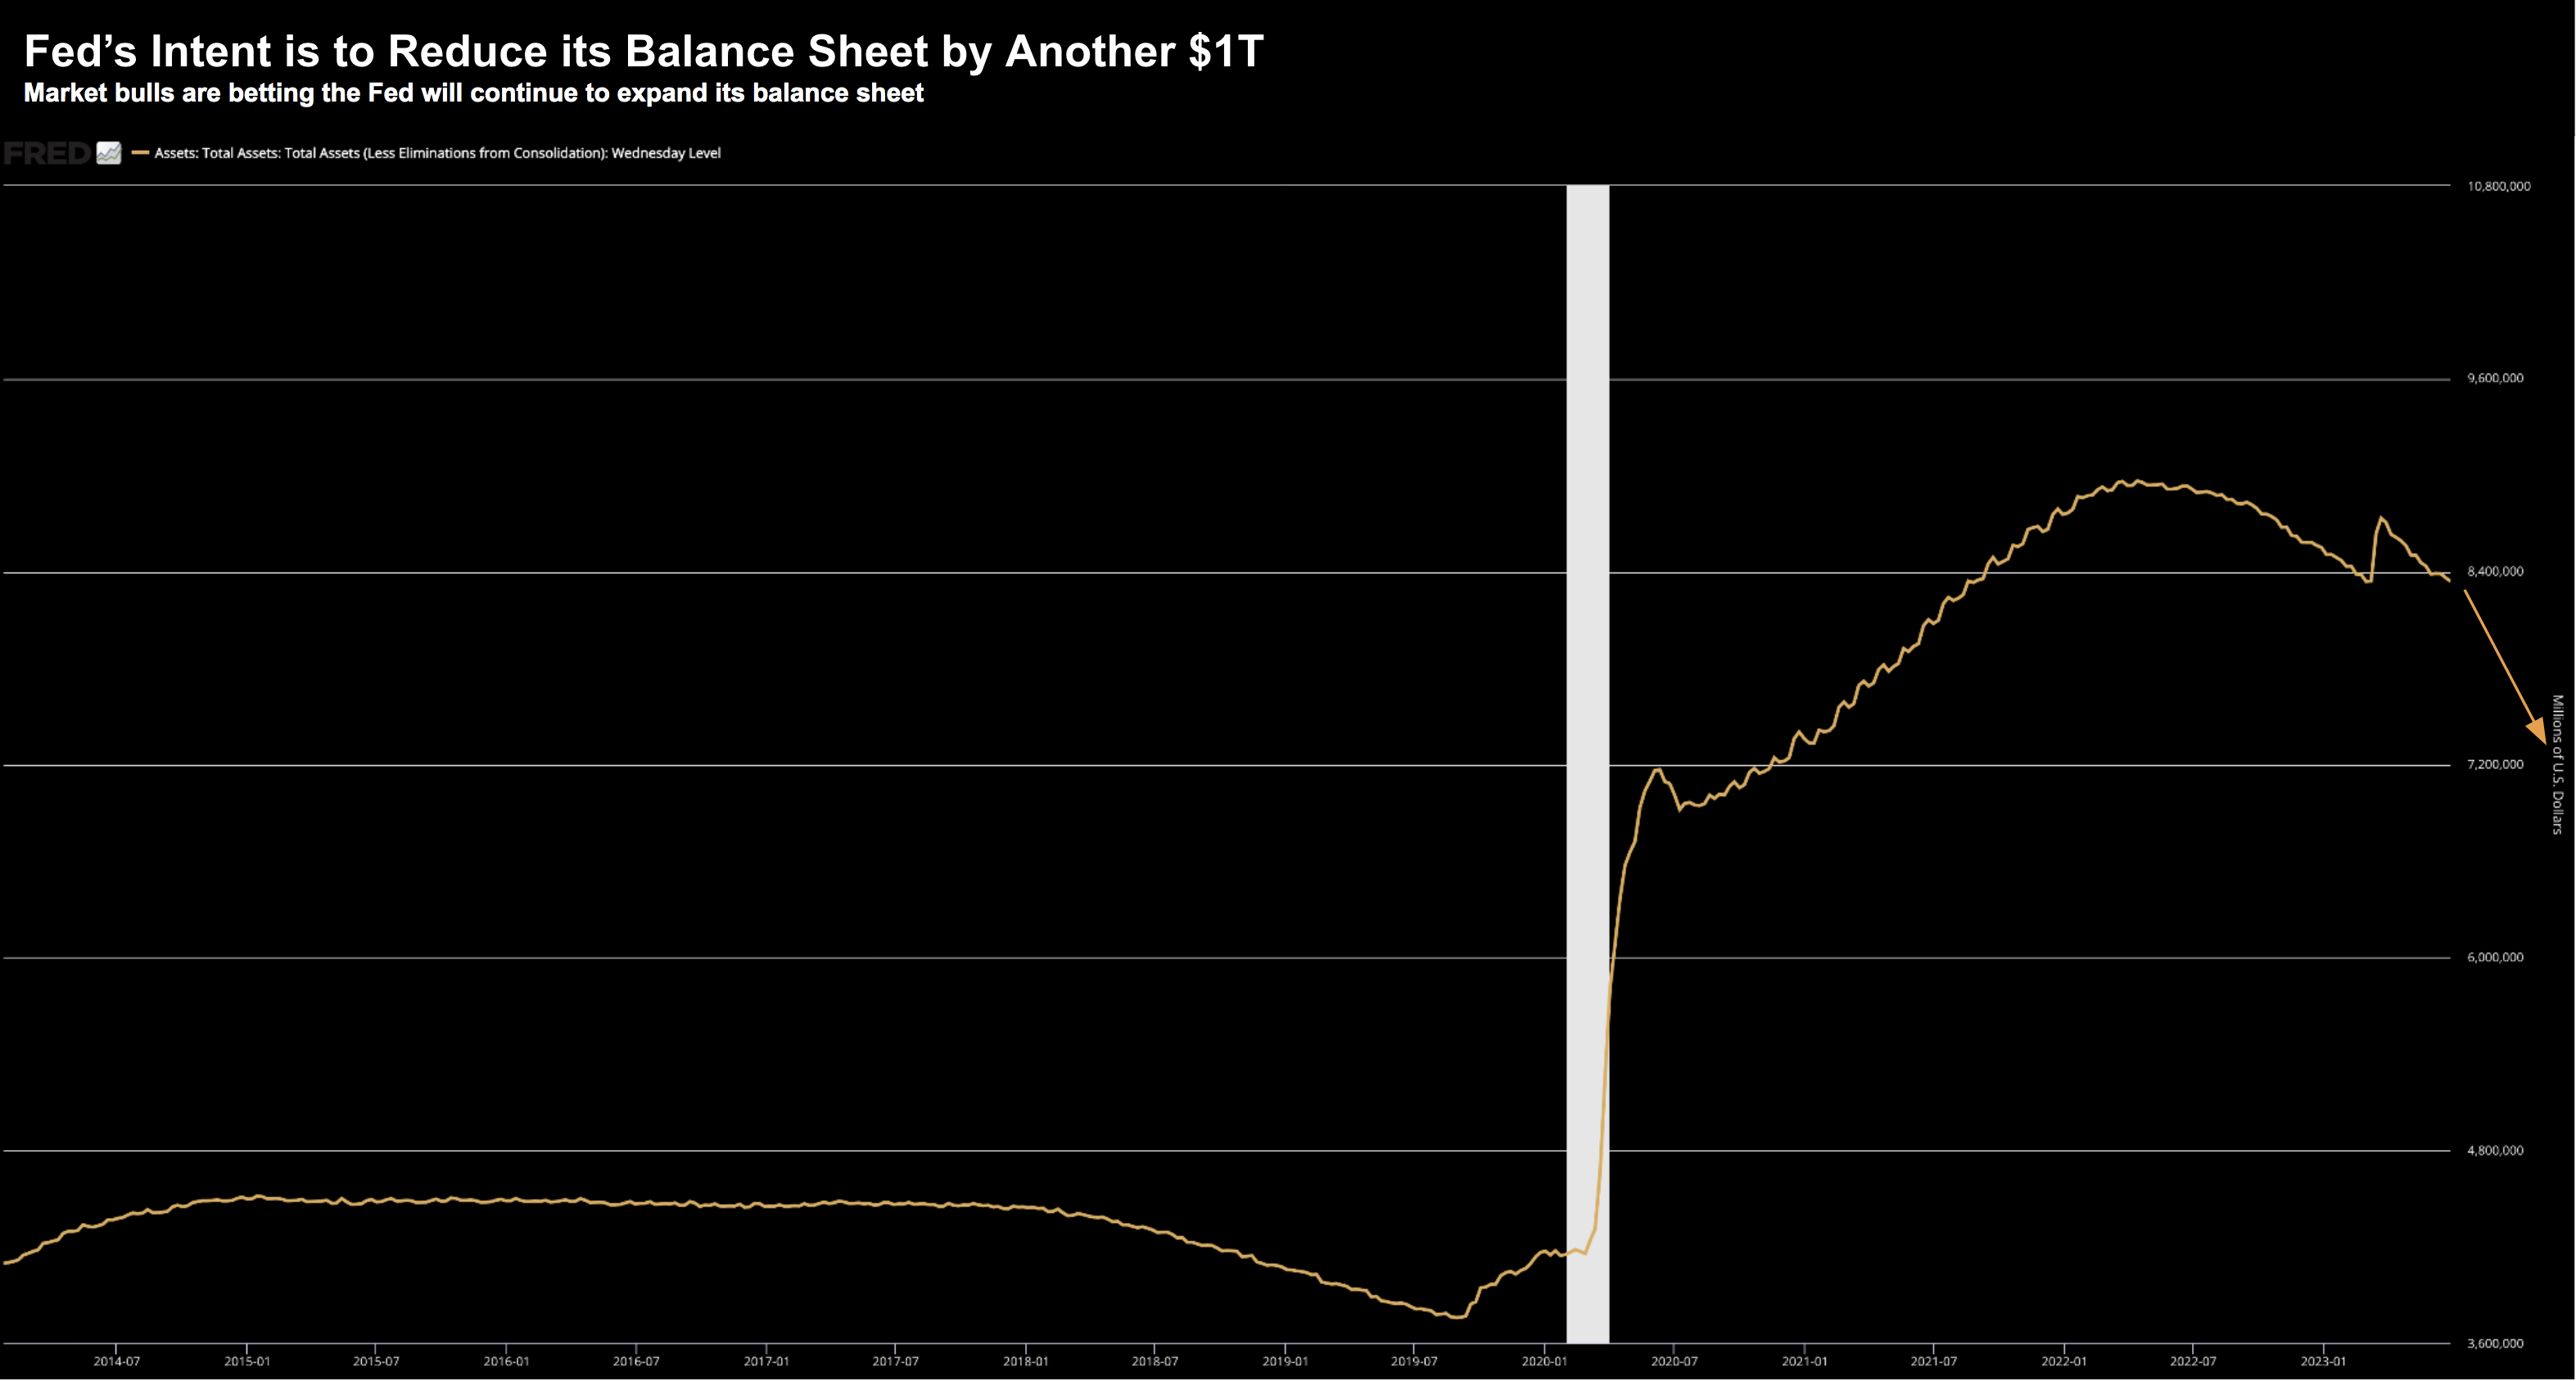
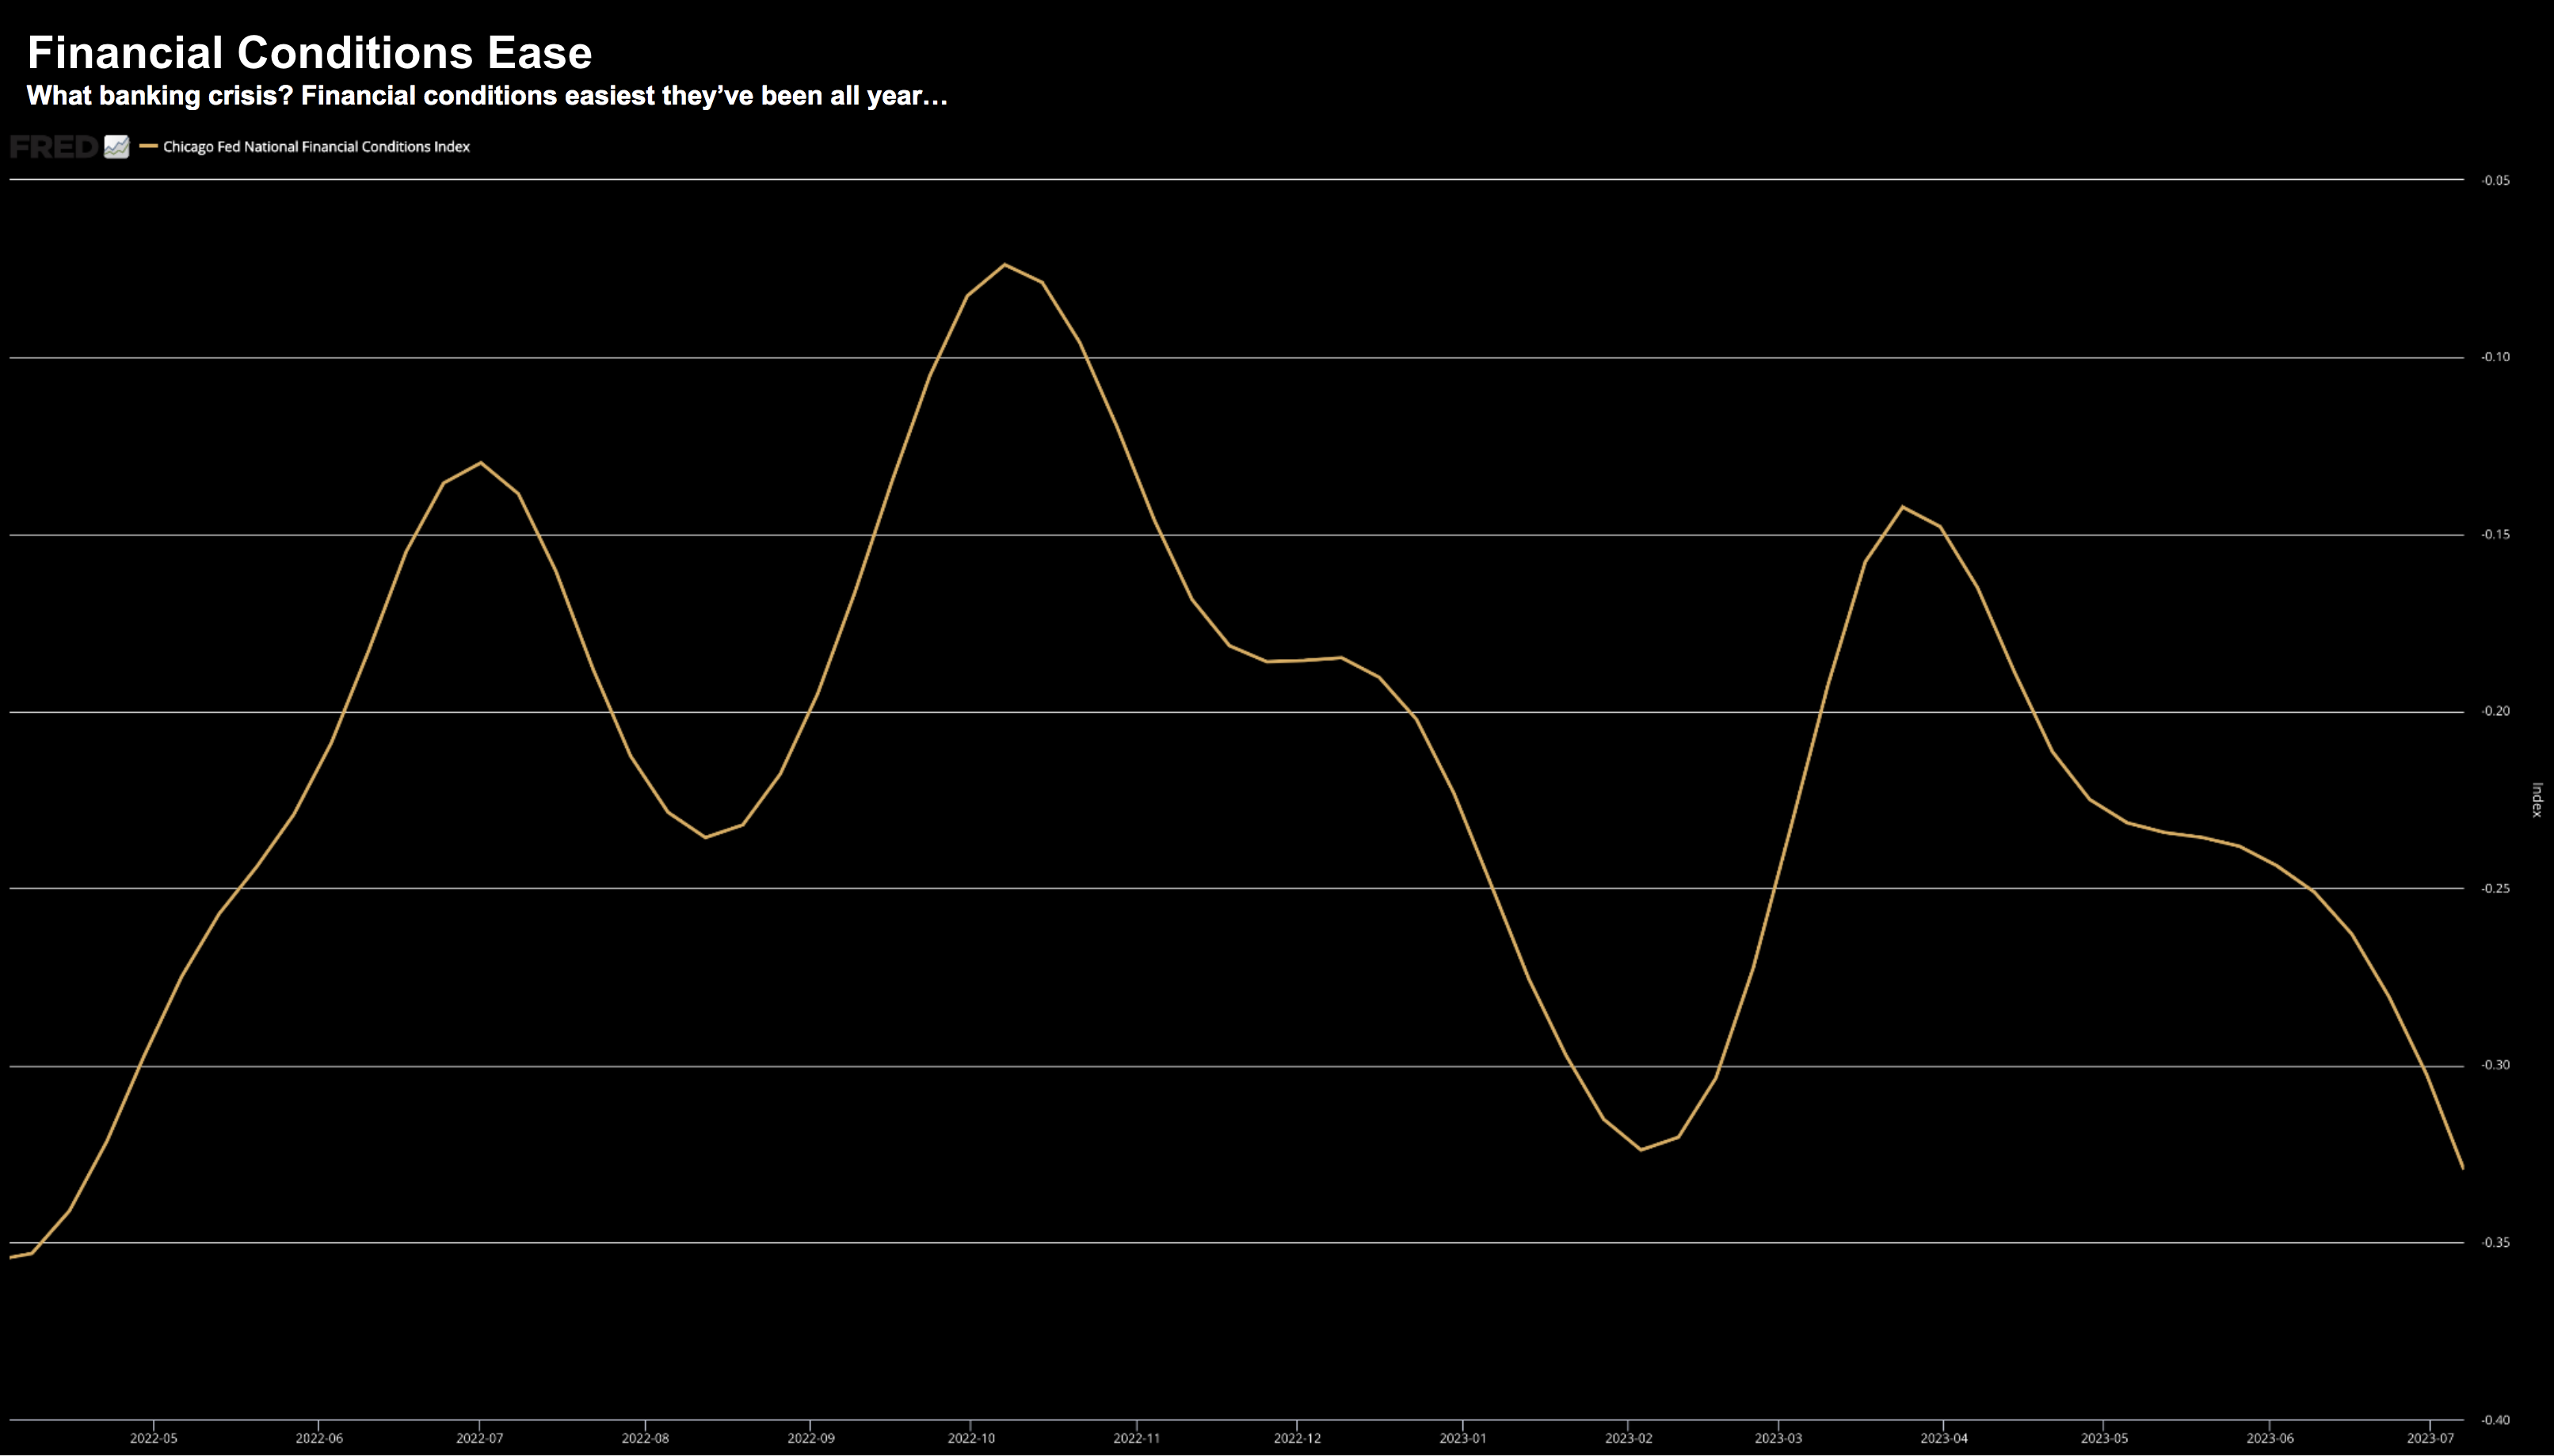
Are things actually looking up? If your measure is the equity market... you would say absolutely. Stocks continue to charge higher on the back of lower inflation and optimism the Fed is closer to the end of its hiking cycle. What's not to like? However, there's something else giving markets a boost. Easy money! Financial conditions are as easy as they've been all year. For example, it was only 4 months ago and we had a mini banking crisis... where funding was a lot tighter. That's now a distant memory.

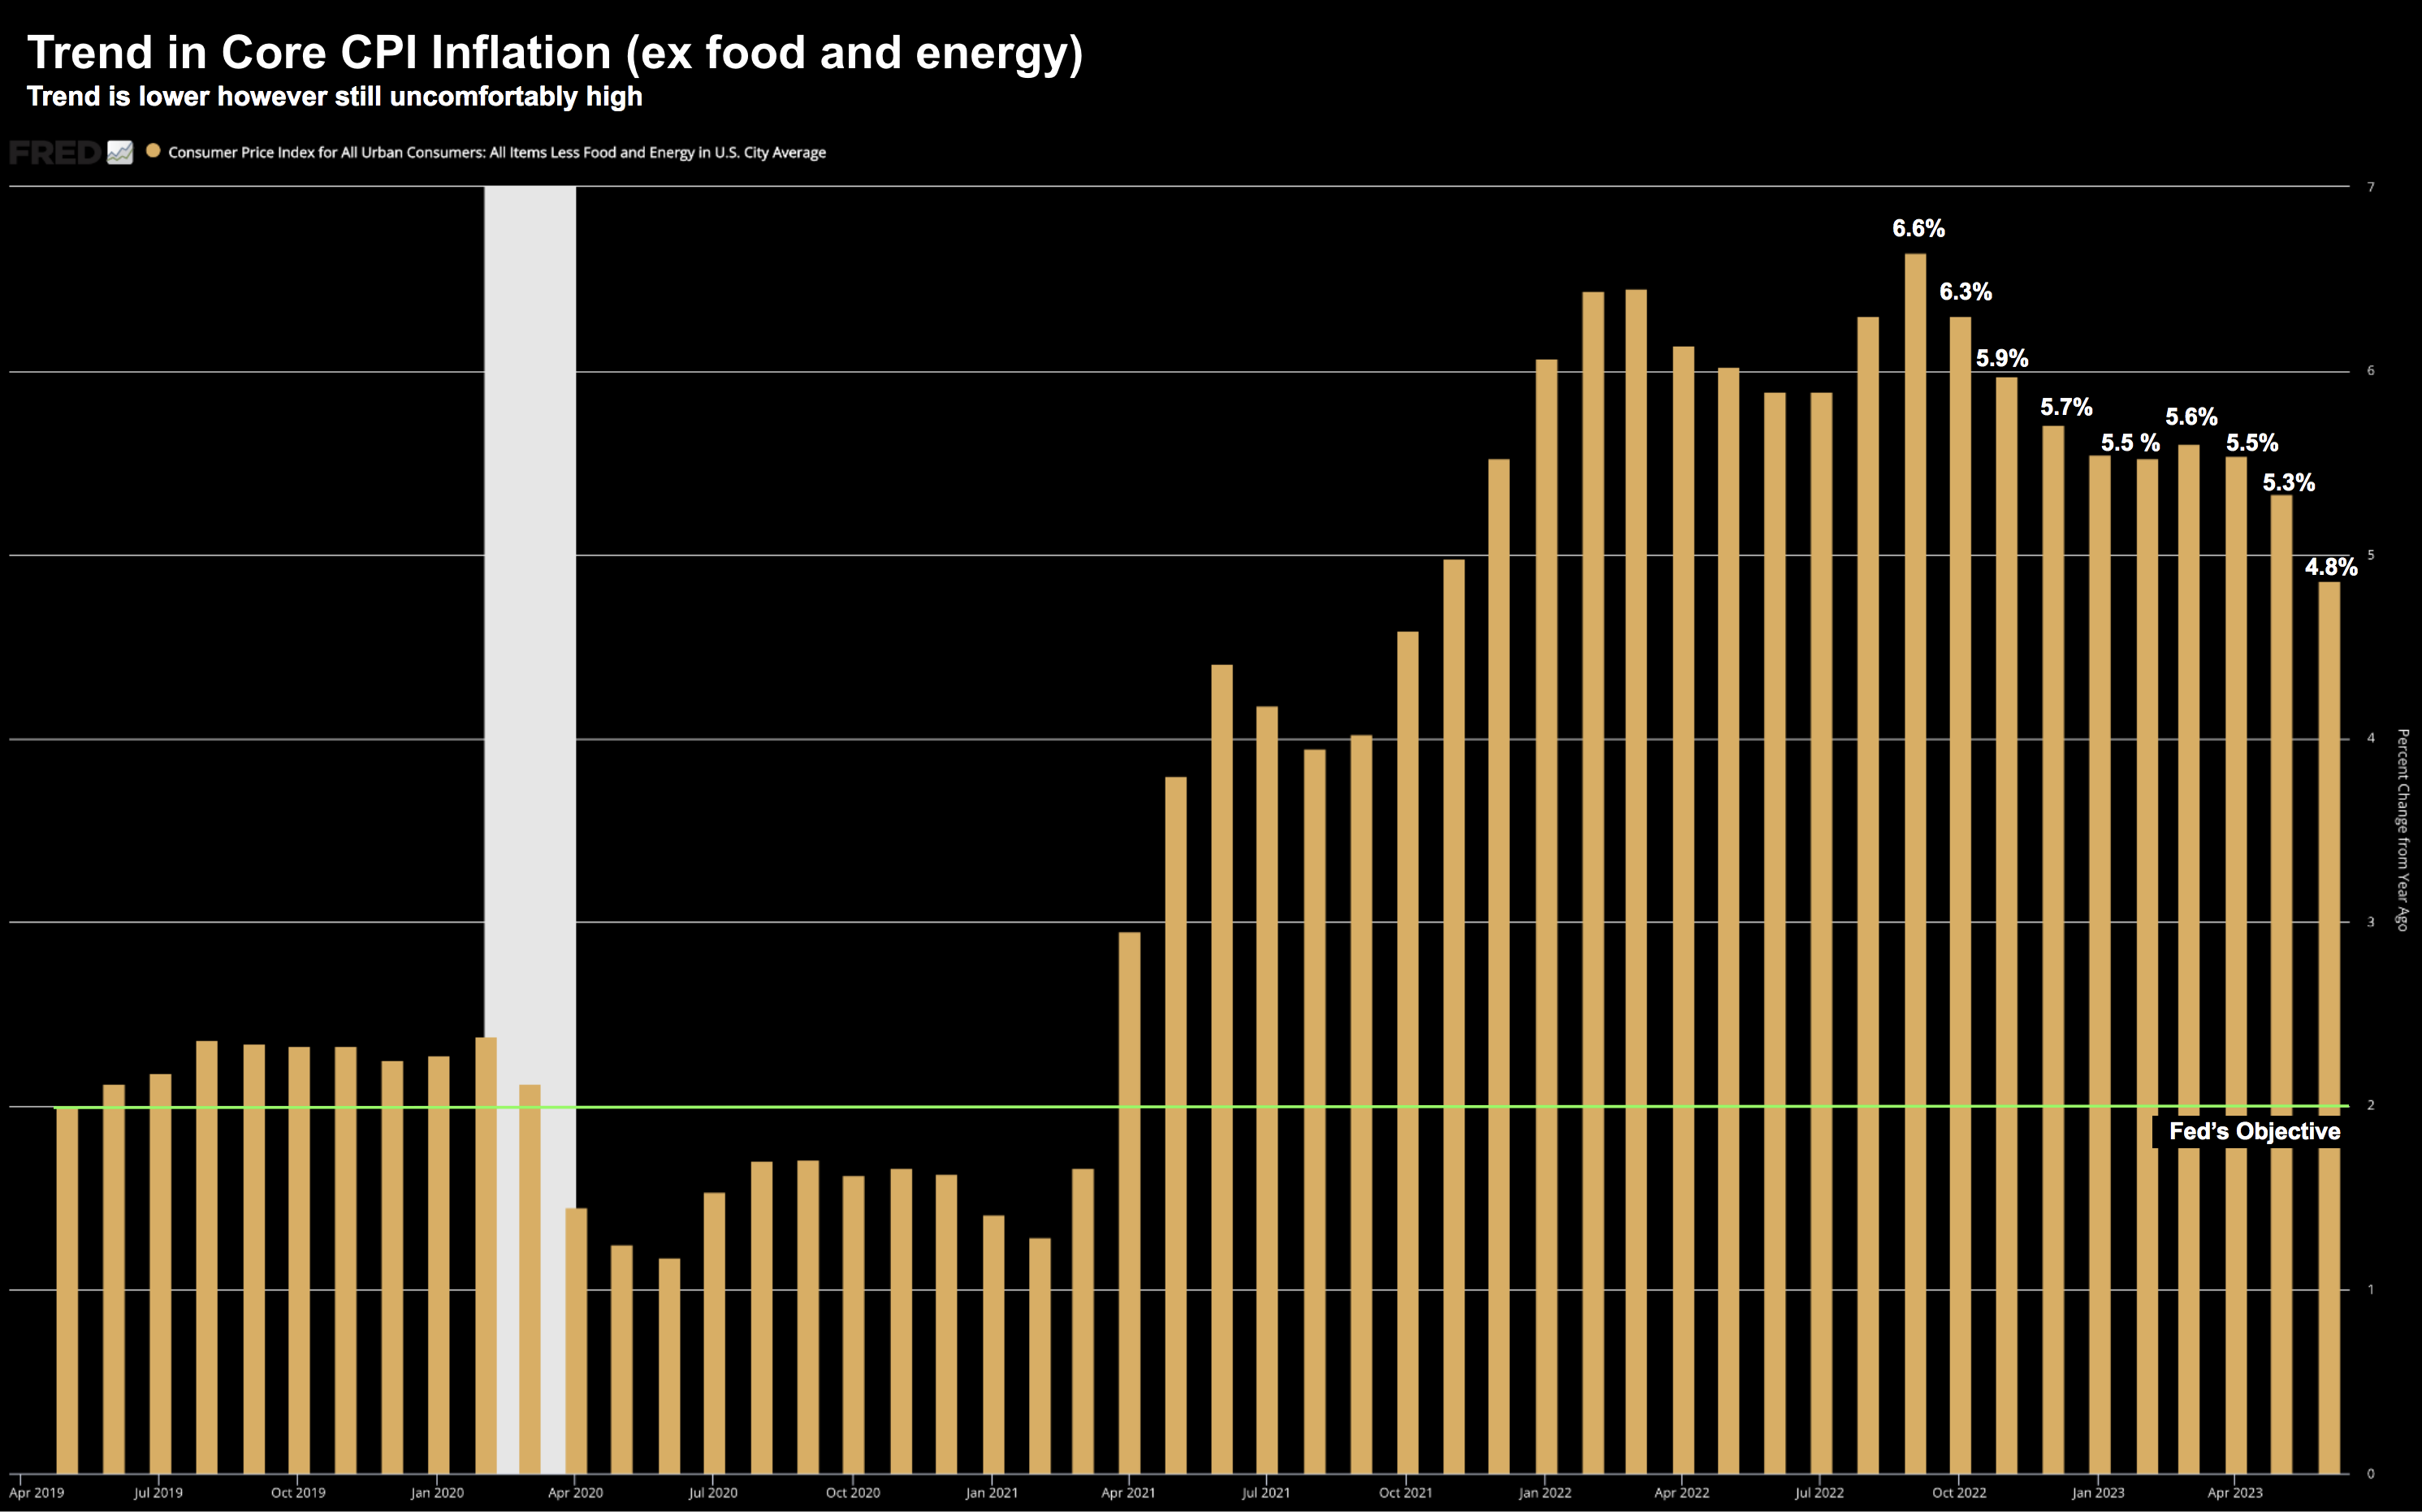
Fed Can Keep Raising w/Core CPI 4.8% YoY 

The market celebrated the June monthly CPI data. Headline CPI came in at just 3.0% YoY - and Core CPI fell to 4.8% YoY. Good news. However, with Core CPI still more than 2x the Fed's target - expect them to raise rates again at the end of the month. However, what surprises me is the market believes the war with inflation is basically done. Is it? I think that is presumptuous. The fight with Core inflation will be a long one. If correct, the Fed may not need to keep raising rates aggressively - however are likely hold them there until their objective is met.

Think About Adding Bonds

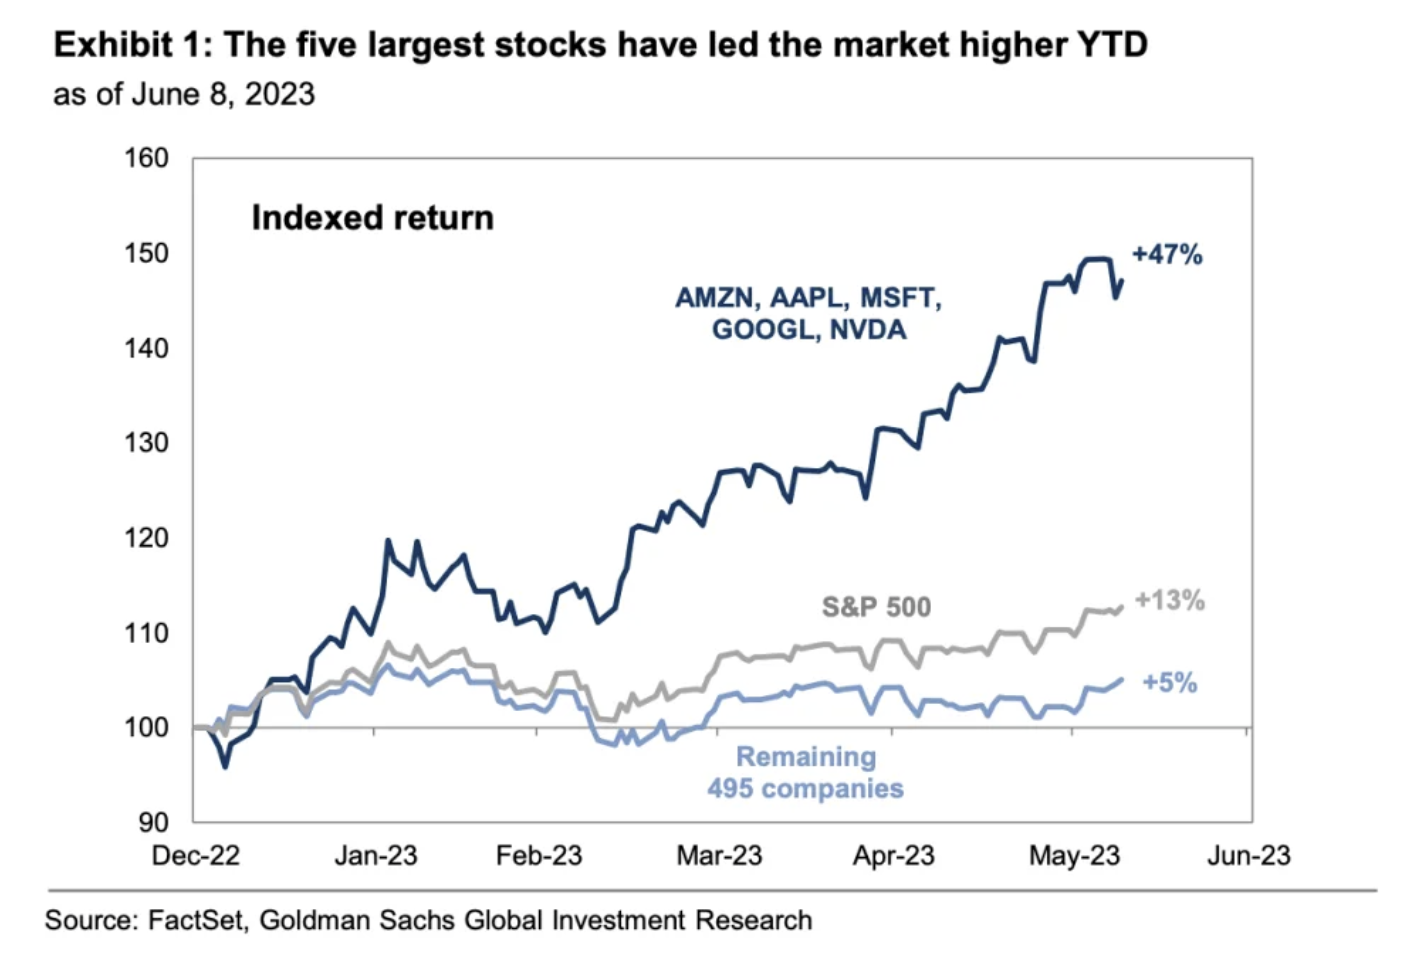
For me, 2023 has been a year of repositioning and managing risk. I lowered my exposure to large-cap tech (down to ~20% portfolio weight) and increased exposure to banks, energy and some industrials (which all trade at reasonable valuations). Today I will look at two bond ETFs - which I think could warrant exposure in your portfolio. In summary, with the US 10-Year yield back above 4.0% - it pays to add some longer-term duration.

Some Things Just Take Time

This week we received the latest monthly payrolls data. US employers added 209K jobs - a little lower than expected. However, the job market appears robust. One metric that deserves closer inspection are weekly hours worked. That is trending lower and could be a precursor to what's ahead. From my perspective, what we're seeing is the "Fed lag" effect of higher rates slowly tighten its vice. But these things take time and we may not see the full effects on the labor market for another 6-12 months (at a guess).

Fed Minutes Suggest More Hikes 

Today the Fed released this statement from their latest minutes "The economy was facing headwinds from tighter credit conditions, including higher interest rates, for households and businesses, which would likely weigh on economic activity, hiring, and inflation, although the extent of these effect remained uncertain". But here's the thing: the market could be underestimating how long the lag effect is. Typically it's between 12 and 24 months. However, with an extra $2+ Trillion in (perhaps wasteful) government handouts, that has softened the blow dealt from higher rates. But make no mistake - the lag effects from 500 bps of tightening will come - it's just longer than expected.

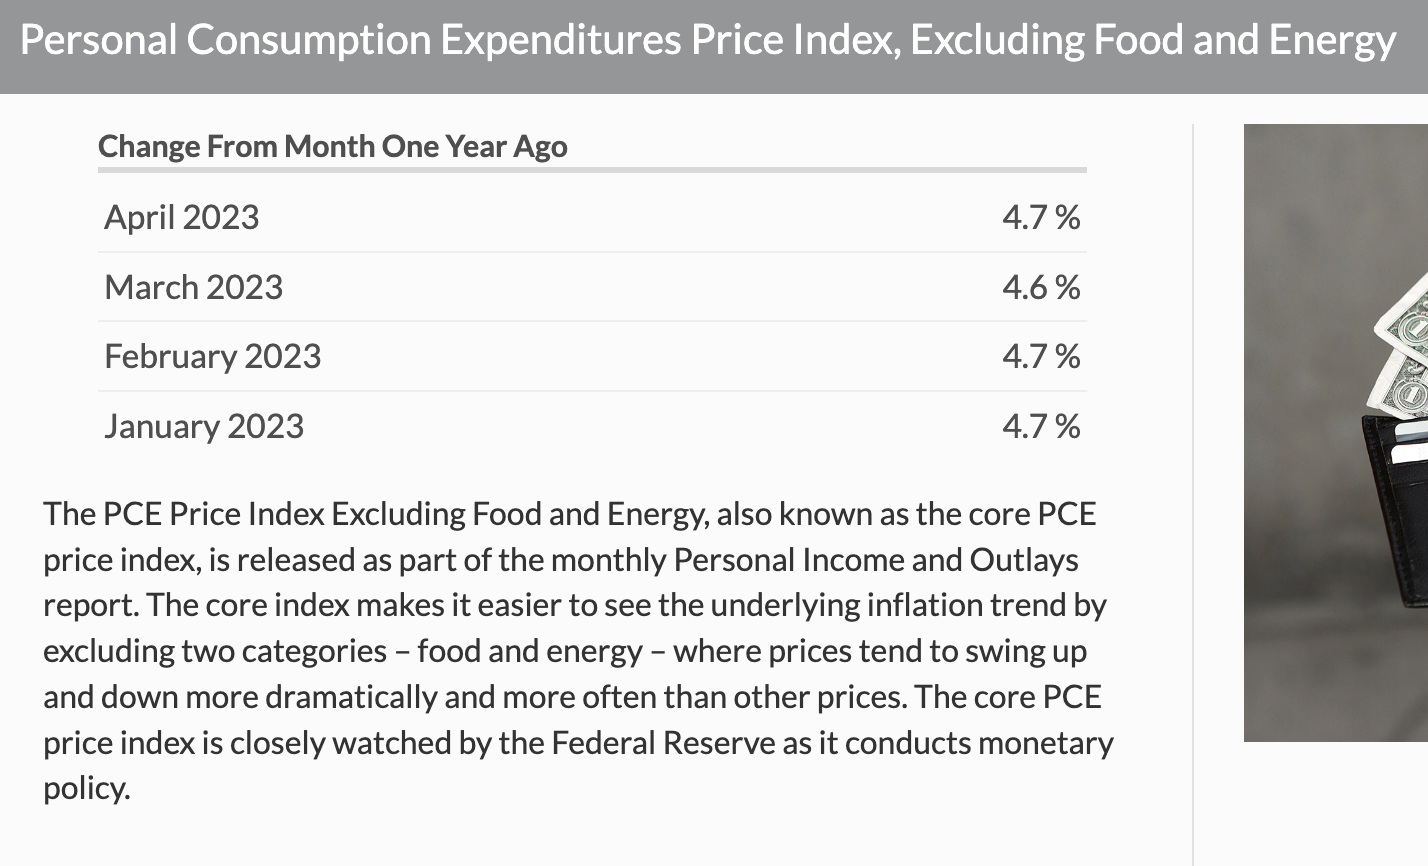
‘Higher for Longer’ after May Core PCE

May's print for Core PCE came in 4.6% YoY - still well above the Fed's objective of 2.0%. However, mainstream were quick to label the report as 'lackluster'. Why? Here's the thing - Core PCE has hardly changed the past few months. It dipped in May to 4.62%, from April (4.68%), but was above March (4.61%), and was exactly where it had been in December (4.62%). Put another way - we have made no ground since December - and yet it was now somehow 'lackluster'. But it gets better: core services inflation (without energy services) rose by 5.4% in May YoY. It was fractionally lower than April (5.5%) - but equal to what we see in both March and December (5.4%). Similar to Core PCE - it too is stuck in a tight range for 5 consecutive months. What does all this mean? Simple: rates will be higher for longer and markets don't get it.

Stocks Are Not Cheap

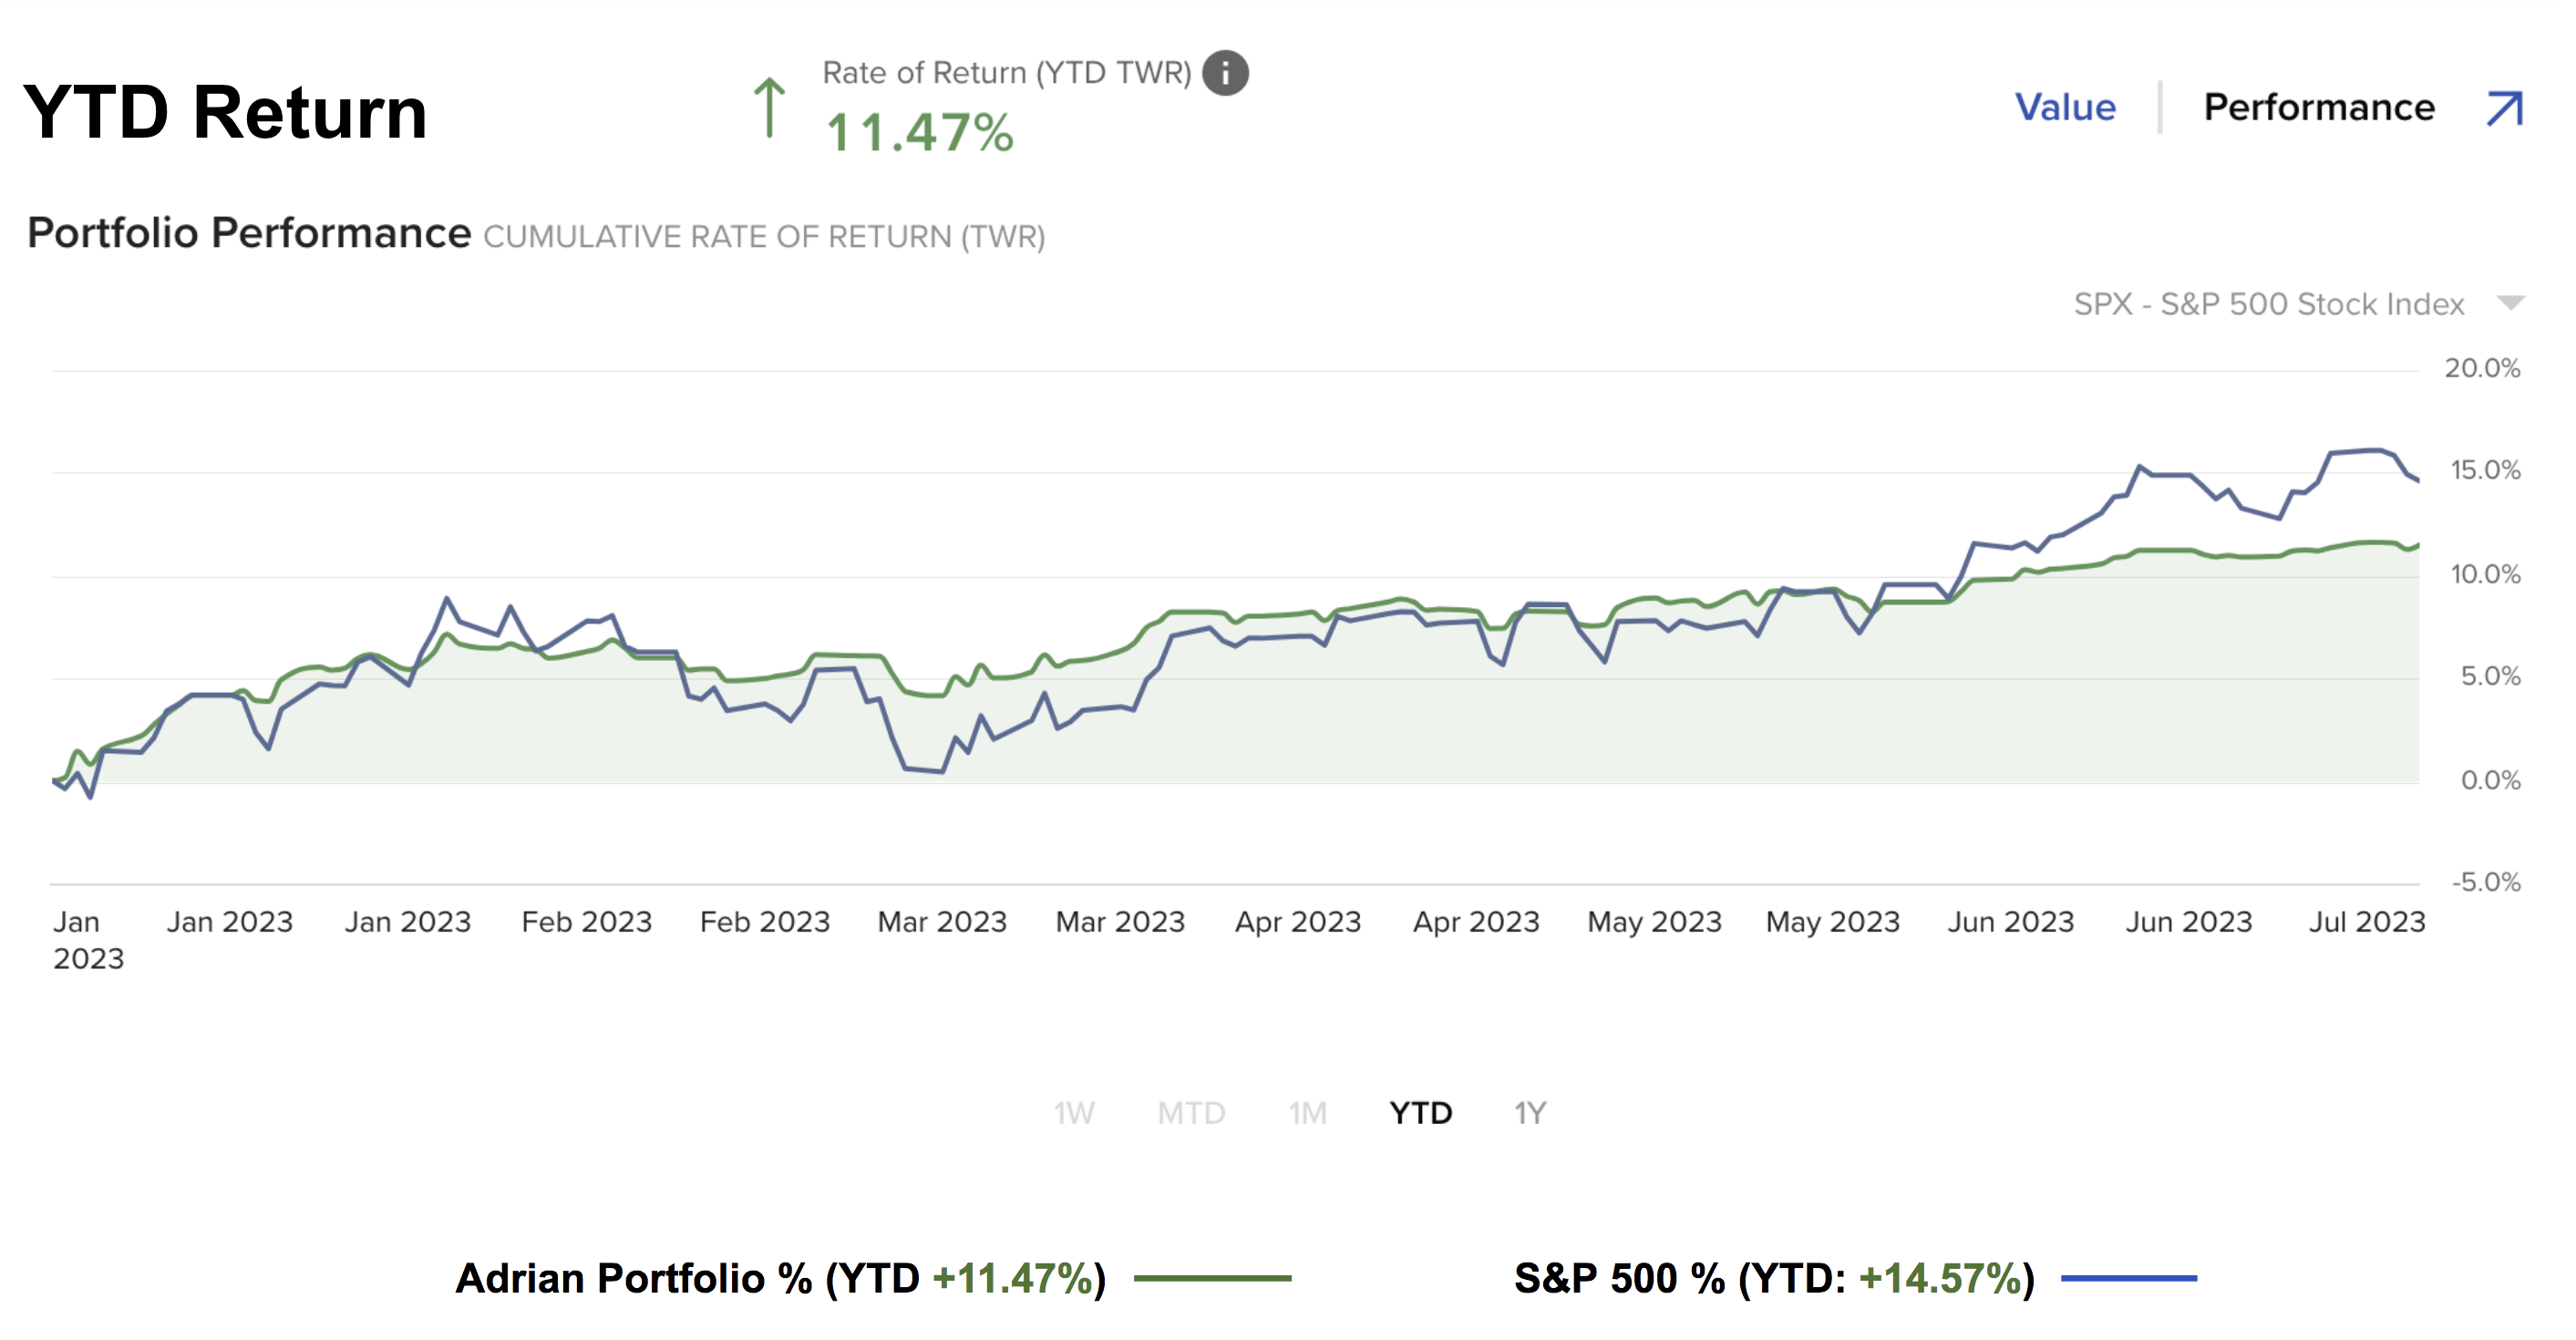
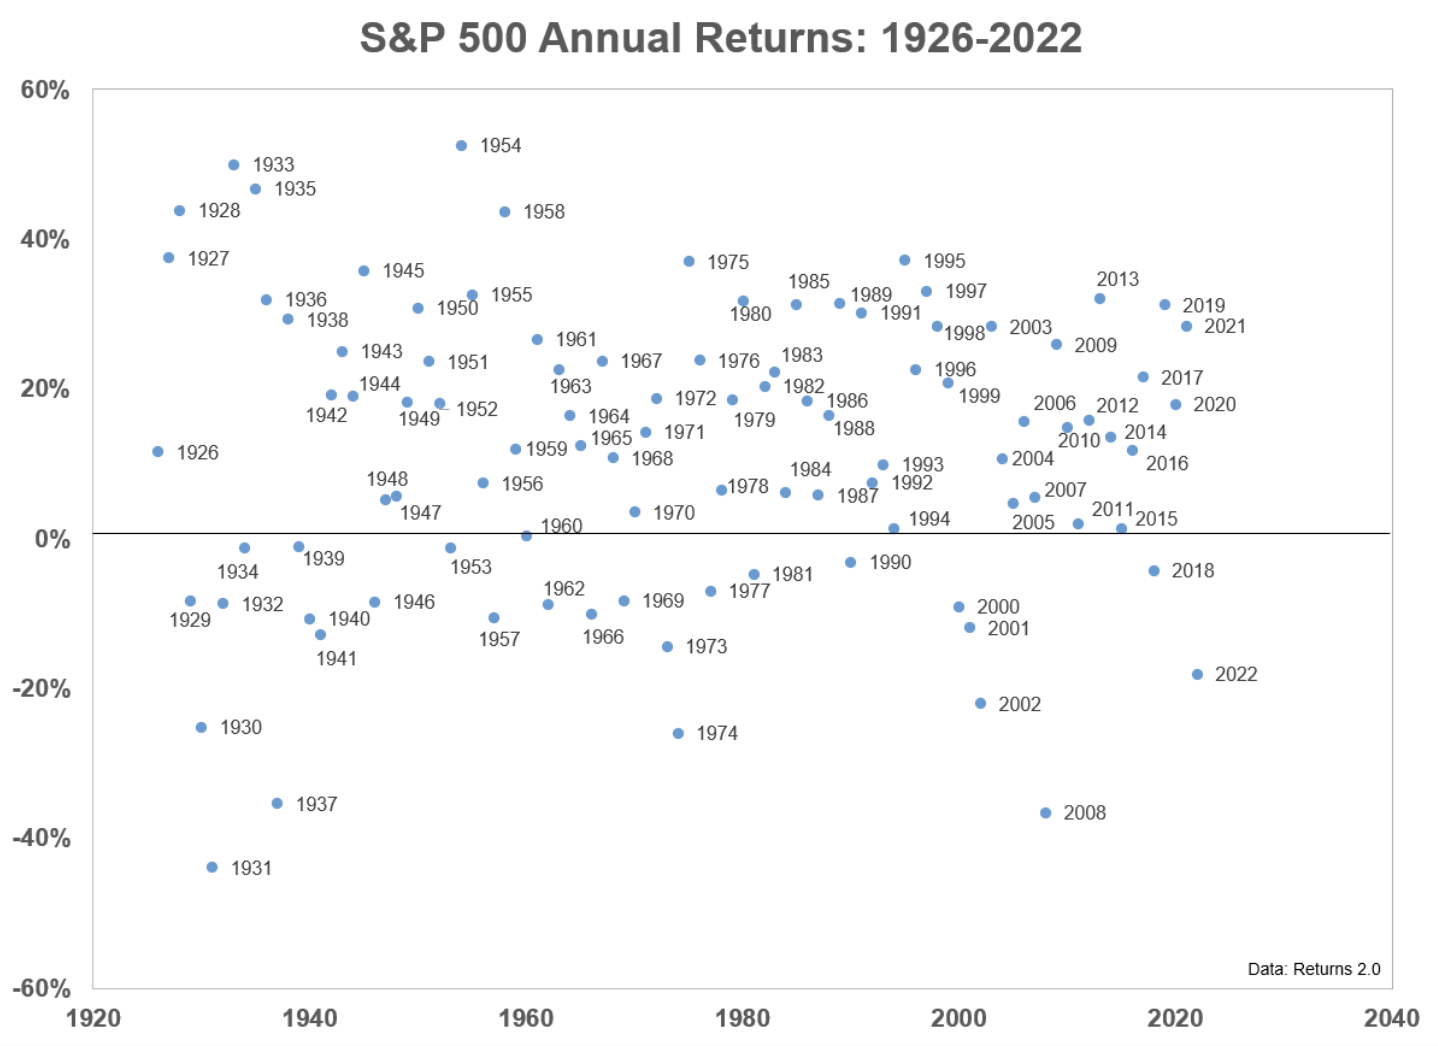
The S&P 500 has had a fantastic first 6 months of the year - up almost 15%. That's a welcomed relief from the miserable 2022. But are stocks now too expensive? What's the premium investors are being asked to pay? There are a couple of ways we can assess this. For example, we can compare the earnings yield against the risk free rate of return (currently around 5.5% and going up). And whilst it's always good to maintain some (long) exposure to the market - we need think carefully about how much (and where)

Why Is it Different This Time?

Whenever history looks like repeating - it's worth asking what's different this time? I say that because the past is never a guarantee of what's ahead. Put another way, if you are making decisions on that basis, you might be suffering from "confirmation bias". And that can be a blind spot. My (possible) blind spot is I think a recession is more than likely within the next 12 months. As such, I am only willing to put about 65% of my portfolio in risk assets. If I felt a recession was not likely - I would meaningfully increase my exposure. My bias is to lean into historical data (and leading indicators) which have reliably predicted recessions in the past. That feels logical. But I could be wrong.

S&P 500 Meets Resistance

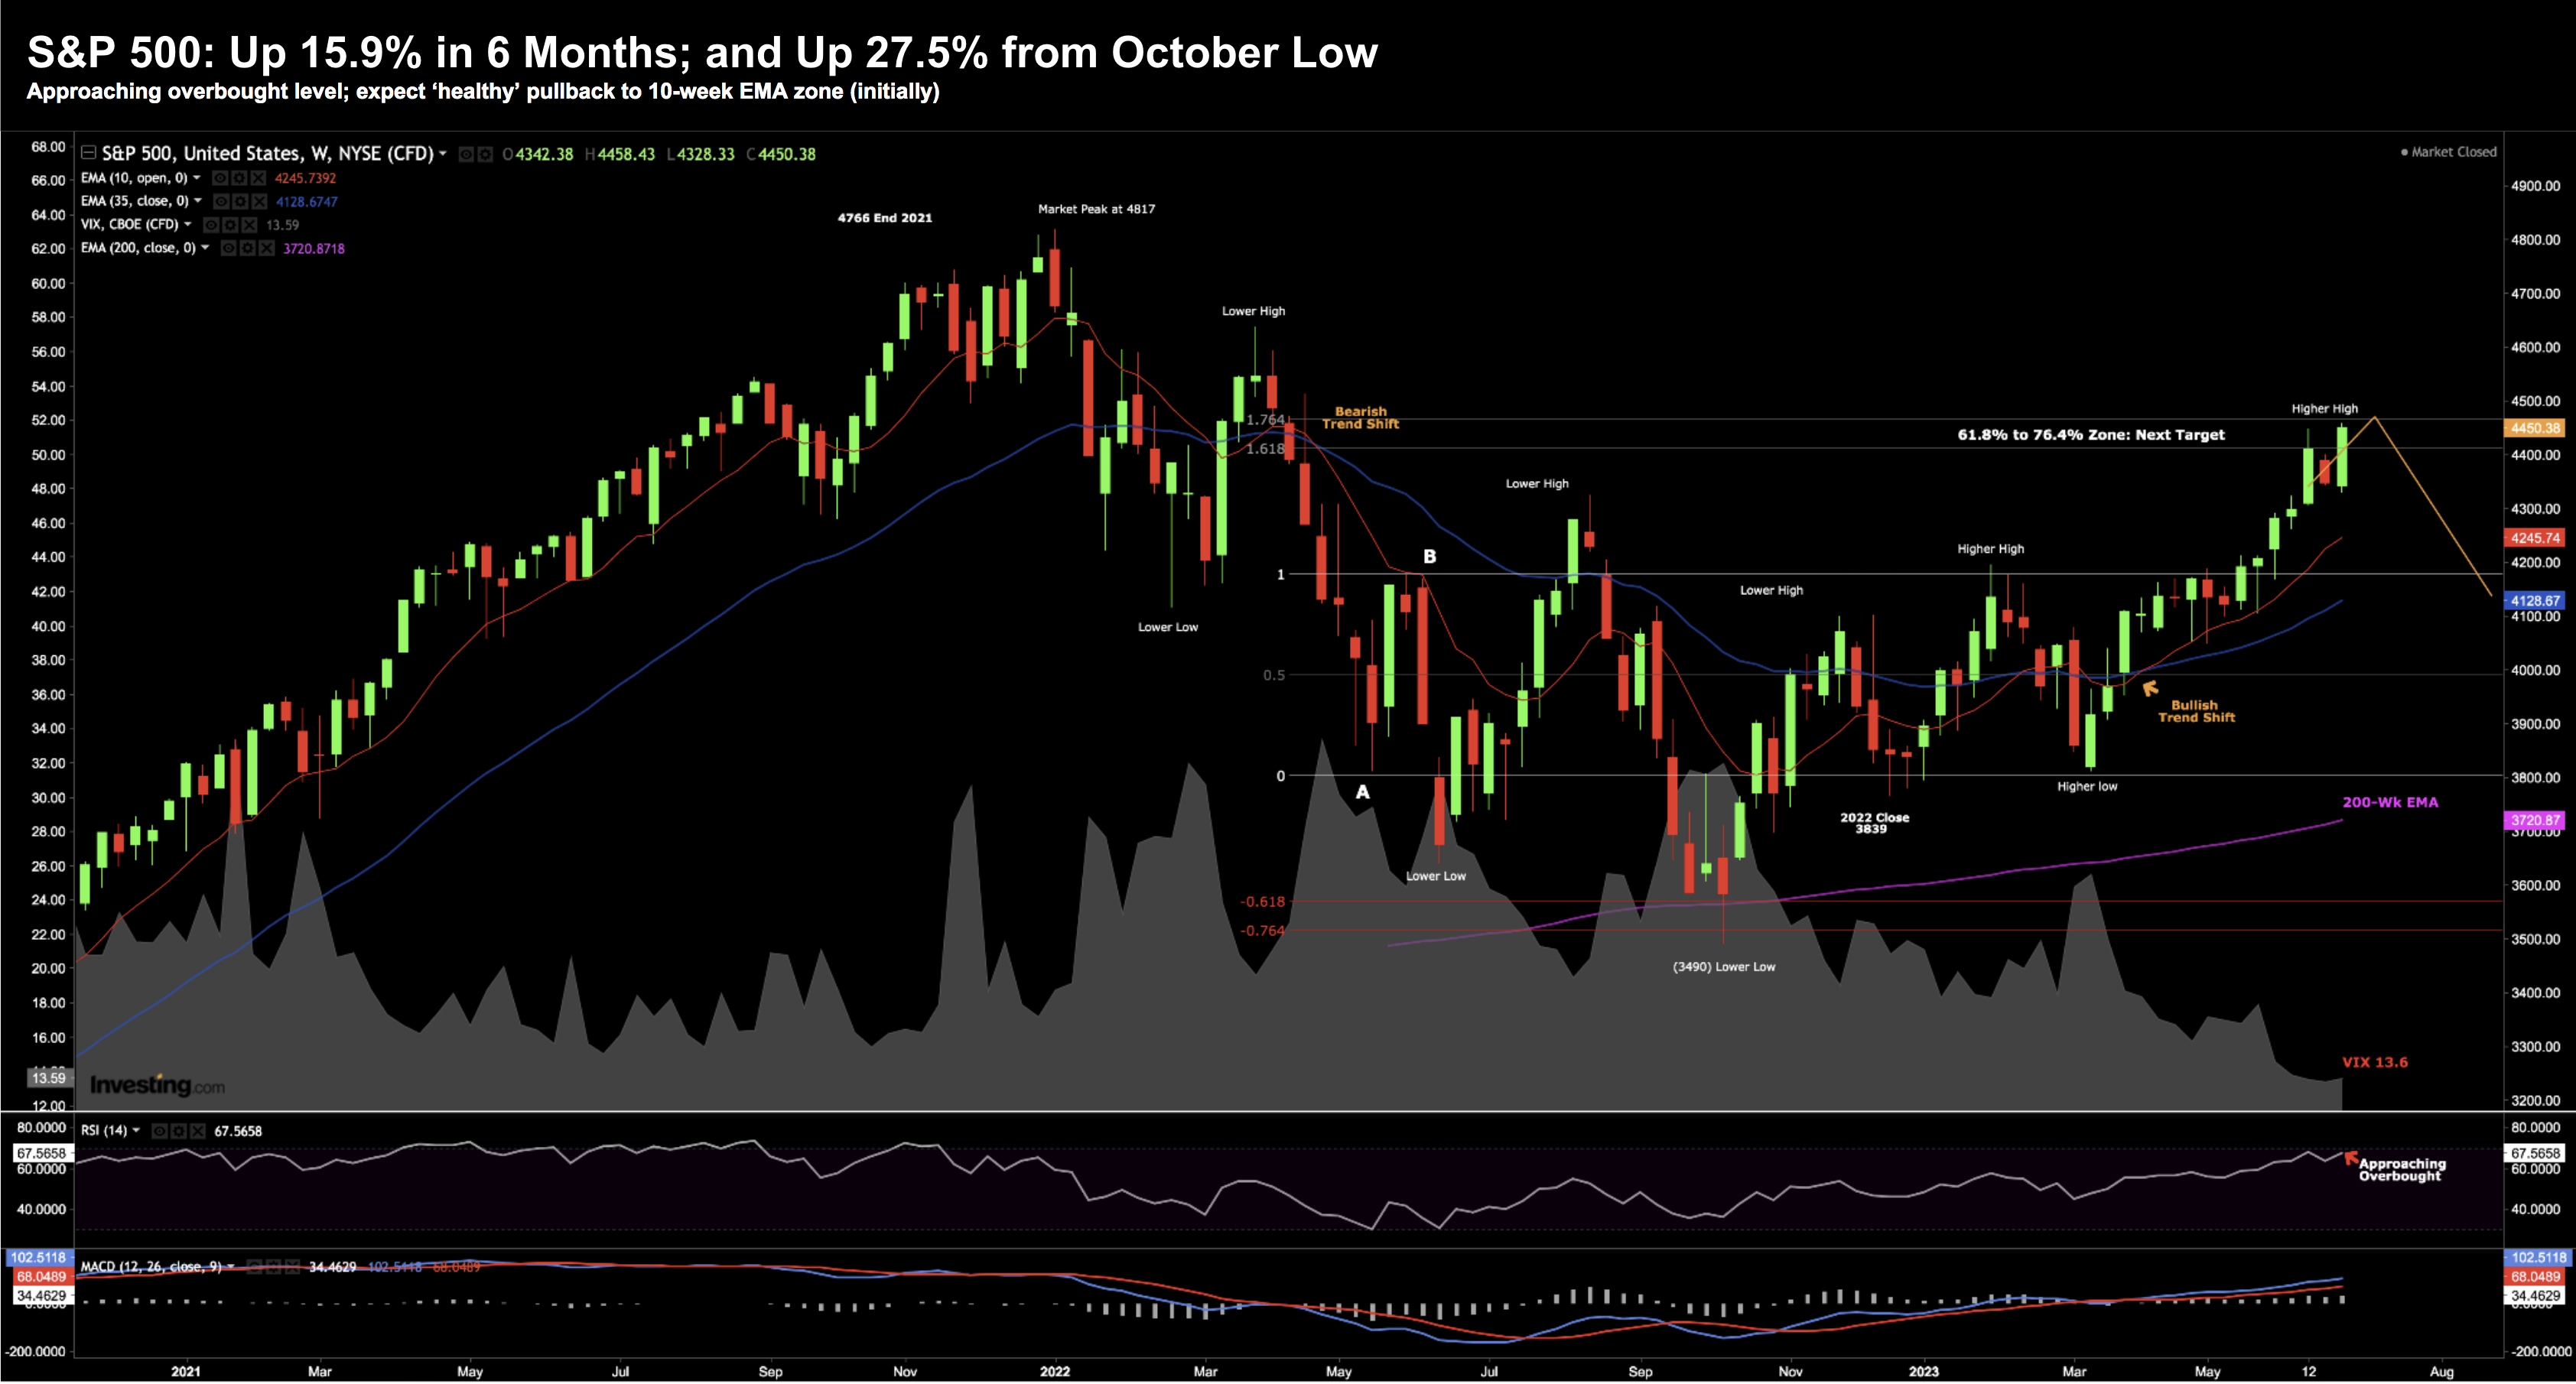
There's a few good reasons to be bullish: (i) Q1 earnings were better than feared; (ii) Bank deposits have stabilized; (iii) Inflation is slowly (but surely) working its way down; (iv) The Fed is closer to its terminal rate; and (v) We're yet to see any major deterioration in credit. All of those are positives for risk assets. However, stocks have run a long way fast and are due to take a pause. I think that's what we will see...

Hints of Mid-2007

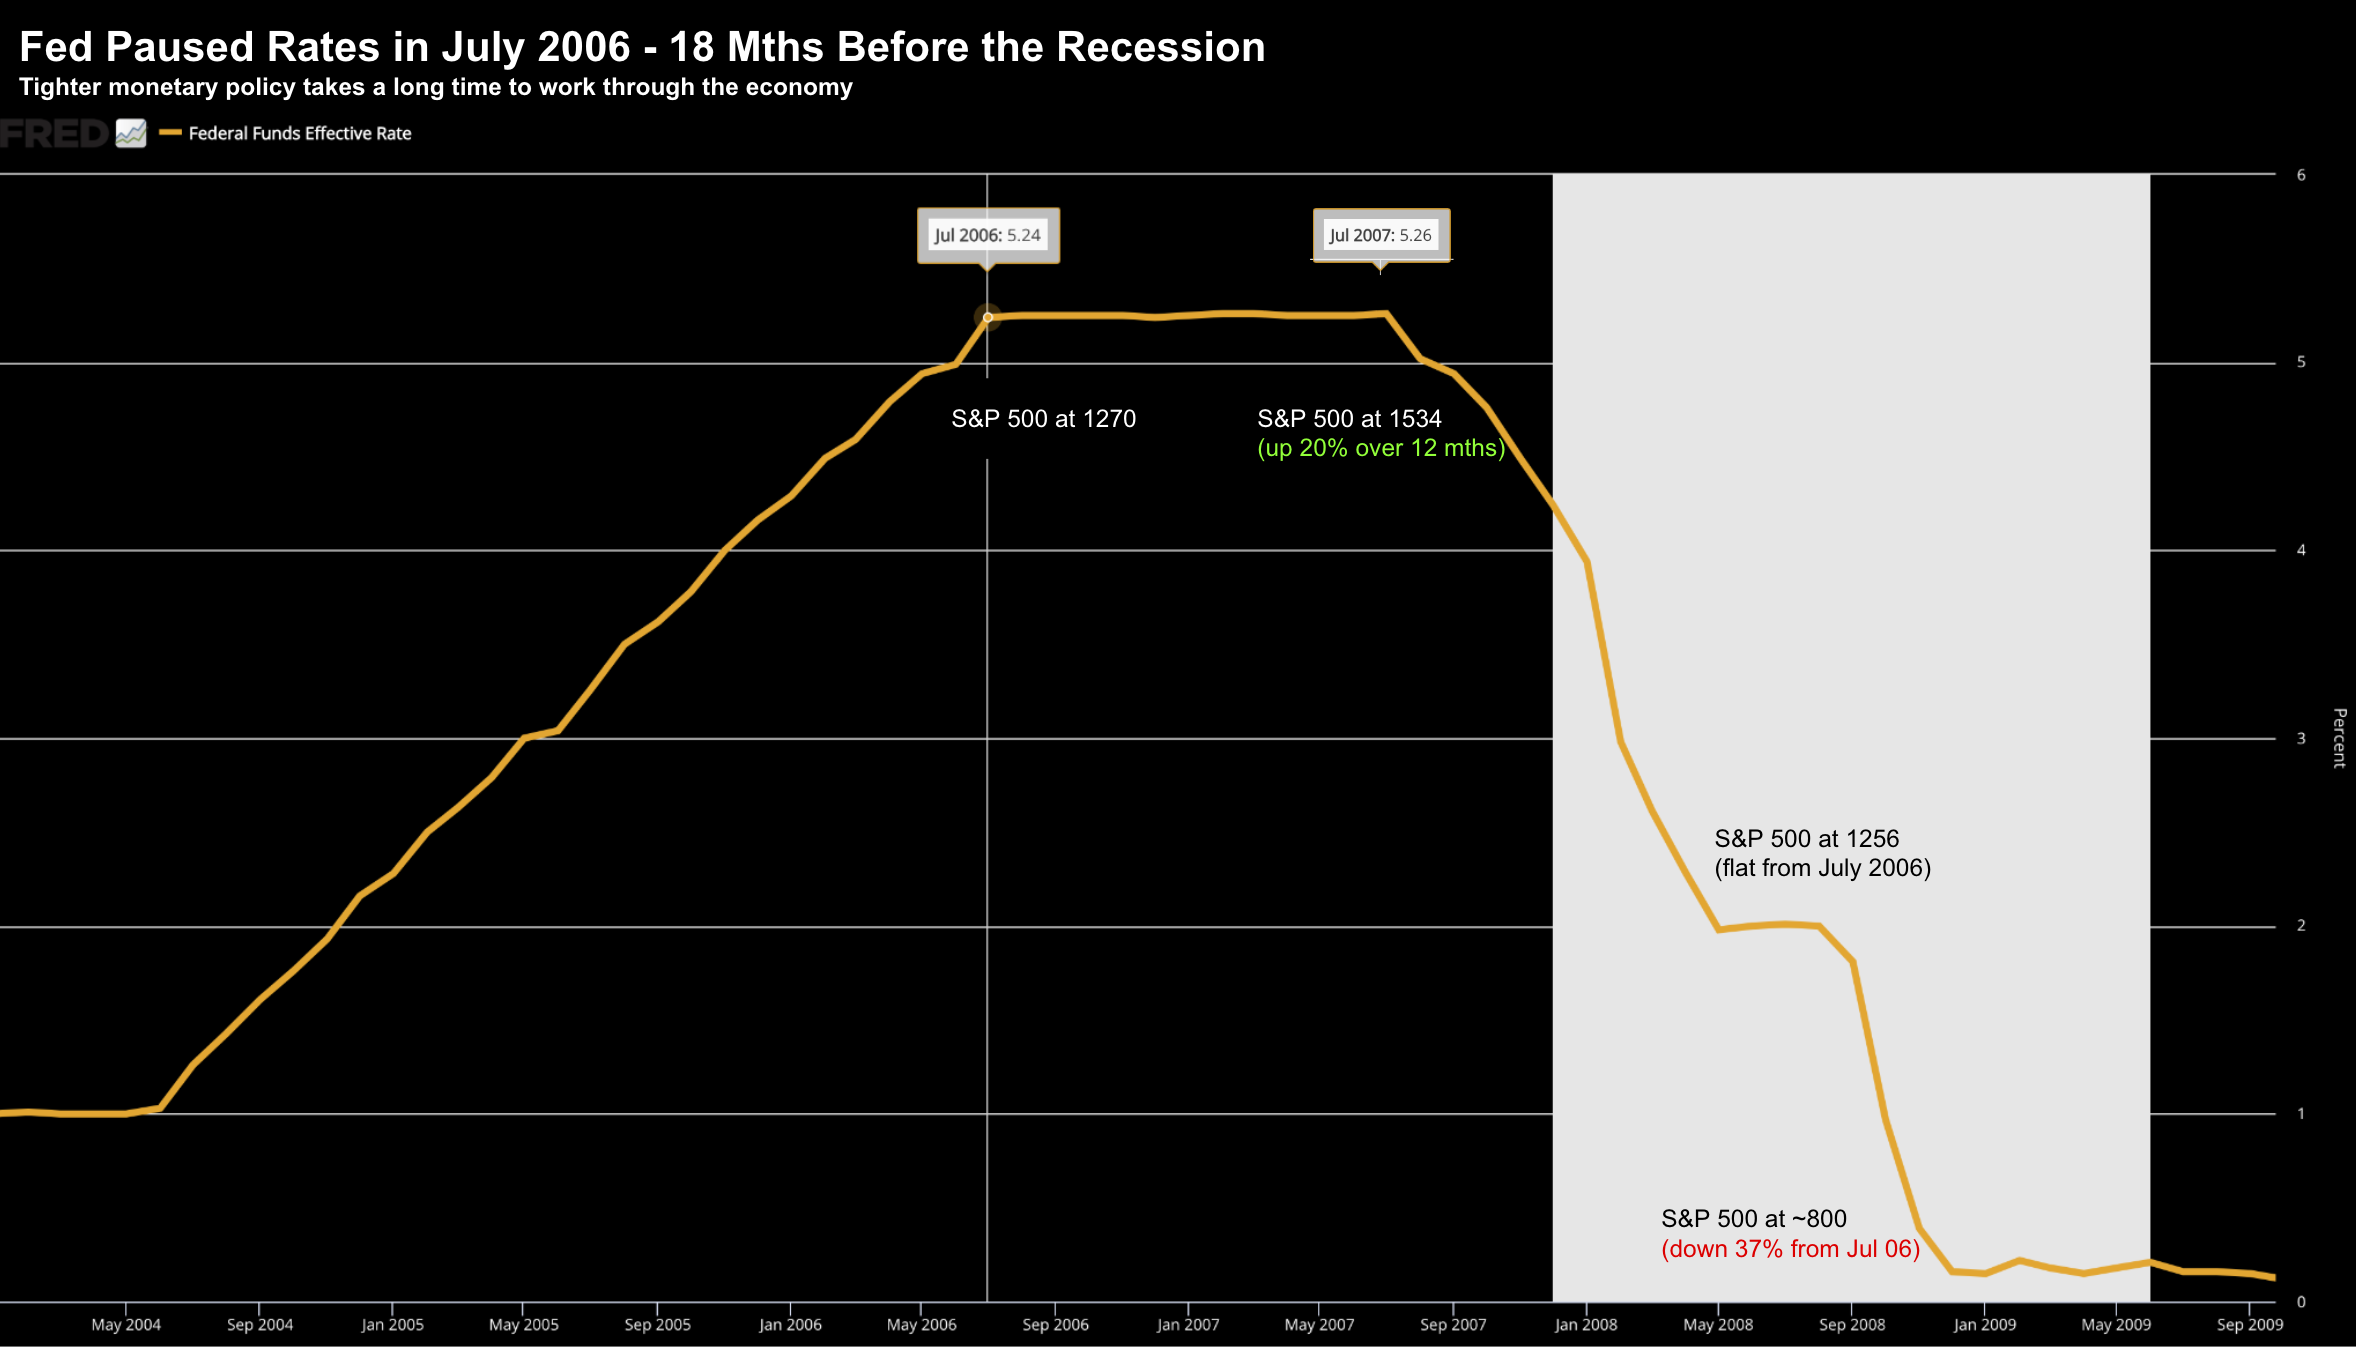
It's been said that whilst history doesn't repeat - it often rhymes. For me, 2023 offers some parallels to 2007. To be clear, things are not exactly the same (they rarely are) - however I will demonstrate some similarities. What's more, I continue to remain long this market (with about 65% exposure). That said, if I'm correct (and I may not be) - it could raise a 'red flag' for 2024. Three things (1) fed monetary tightening takes between 12 and 24 months to make its full impact; (2) the economy also looked very strong into Q4 2007; and (3) sustained inverted yield curve cause recessions. In my view - the market is losing sight of the fact of how long the lag effect can be.

Do Ya Feel Lucky… Punk?

"You've got to ask yourself one question: 'Do I feel lucky?' Well, do ya, punk?" - Dirty Harry. In Callahan's case, there might have been just one... maybe two... left in the chamber. Were you willing to take that chance? Sure, Powell delivered what the market expected. However, he reminded us there's still more 'lead in the Magnum 44'. The other day I shared how the market has already priced in a 60% probability for a hike in July. That probability remains unchanged after Powell gave his address. However, beyond July, the market is not expecting any. Remember - only a few weeks ago - the market felt that rate cuts were still possible this year. So... do you feel lucky?