The Ellis Framework: Why Real PCE is the “Seeing Around Corners” Metric for Market Cycles
- Real PCE identifies economic cause-and-effect
- Consumer spending continues to exceed real income growth
- What to make of December"s plunge in pending home sales
In the realm of economic forecasting, the most dangerous phrase is often "the economy remains robust."
This is a consistent theme we"ve heard from multiple voices the past few months. Here"s "top economist" – Wharton"s Professor Jeremey Siegel:
"The current rotation toward small-cap and value stocks is sustainable, supported by underlying economic resilience and the clear trajectory of Federal Reserve policy"
And this from Investopedia:
The Census Bureau on Wednesday (Jan 13) said that U.S. retail sales in November came in at $735.9 billion, a 0.6% increase from October"s sluggish levels.
Economists surveyed by The Wall Street Journal and Dow Jones Newswires expected a more modest increase of 0.4%. The delivery of the report was delayed owing to the government shutdown in the fall.
But as Francis Bacon famously advised, "doubt all before you believe."
To understand the true trajectory of the U.S. economy, one must look past the headline numbers and focus on the engine that drives approximately two-thirds of the nation"s GDP: personal consumption.
And specifically – it"s Real Personal Consumption Expenditures (Real PCE)—spending adjusted for inflation—which serves as the ultimate "seeing around corners" metric for identifying economic cause-and-effect (see this post from approx two years ago).
Drawing on the work of Joseph H. Ellis – I explained the (strong) historical correlation between cooling consumer demand and broader market declines.
For example, when the consumer, squeezed by non-discretionary price hikes and stagnating real wages, begins to exhibit "discerning" behavior, the ripple effects move through corporate earnings and eventually into the labor market.
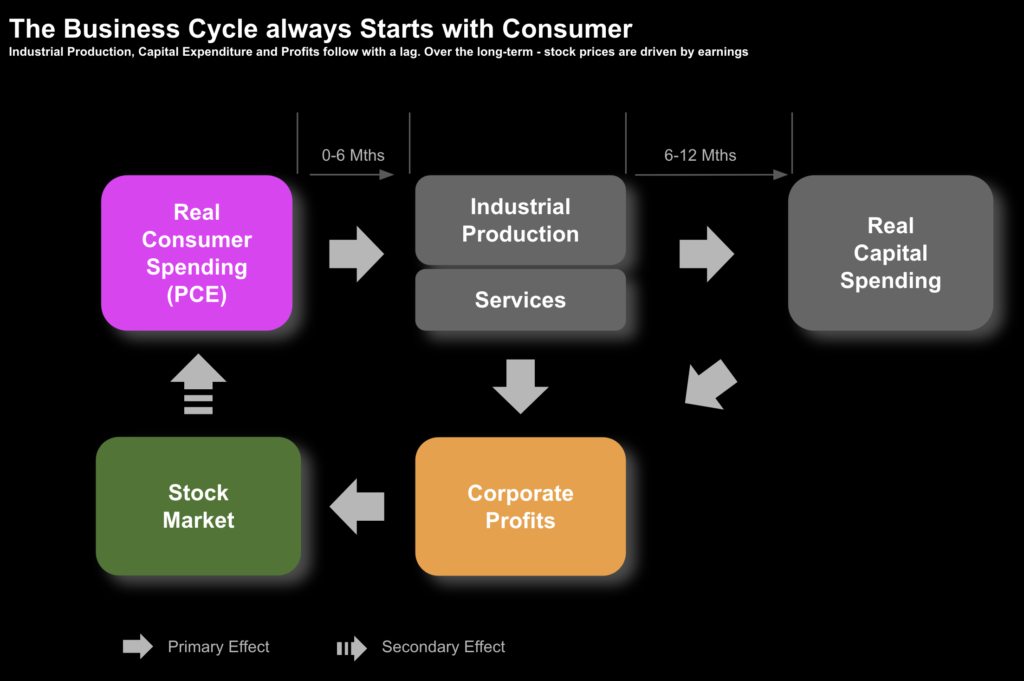
Source: "Ahead of the Curve: A Commonsense Guide to Forecasting Business and Market Cycles - Joseph H. Ellis"
Which brings us to the subject of today"s missive:
Based on the latest data – is the "resilience" shown from consumers the past few months sustainable; or does it potentially mask any underlying structural weakness?
Correlation and Causation
The core thesis of Ellis" analysis is that consumer spending is not just a lagging indicator of past health, but a leading indicator of future stability.
Over the past five plus decades, data shows that when inflation outpaces income—forcing the consumer to pay "30% more" for essentials than they did say a few years prior—the initial resilience eventually snaps.
The question is not so much if… it"s when.
With respect to timing – you will find that economic warnings rarely come from central bankers first. They are generally late. Any warnings tend to come from the nation"s retailers.
For example, when leading franchises such as Nike, Starbucks or McDonald"s report more "cautious" consumer behavior, it signals the consumer"s ability to maintain their spending is under pressure.
From CNBC (Dec 26 2025)
American consumers aren"t feeling great about the economy or their own financial situation, with the phrase "affordability crisis" dominating headlines and political campaigns over the last few months.
The majority – 70% – of Americans surveyed in a Marist poll say that the cost of living in their area is not very affordable, or not affordable at all, for the average family.
Housing costs rose over 14% between September 2023 and September 2025.
Medical costs are up nearly 7% and costs for services are up over 8%.
To demonstrate the effect of correlation and causation from changes in spending — Ellis suggests charting the change in quarterly Real PCE against Industrial Production on a year-over-year basis – as it reveals the tipping point where softening demand forces a contraction in output.
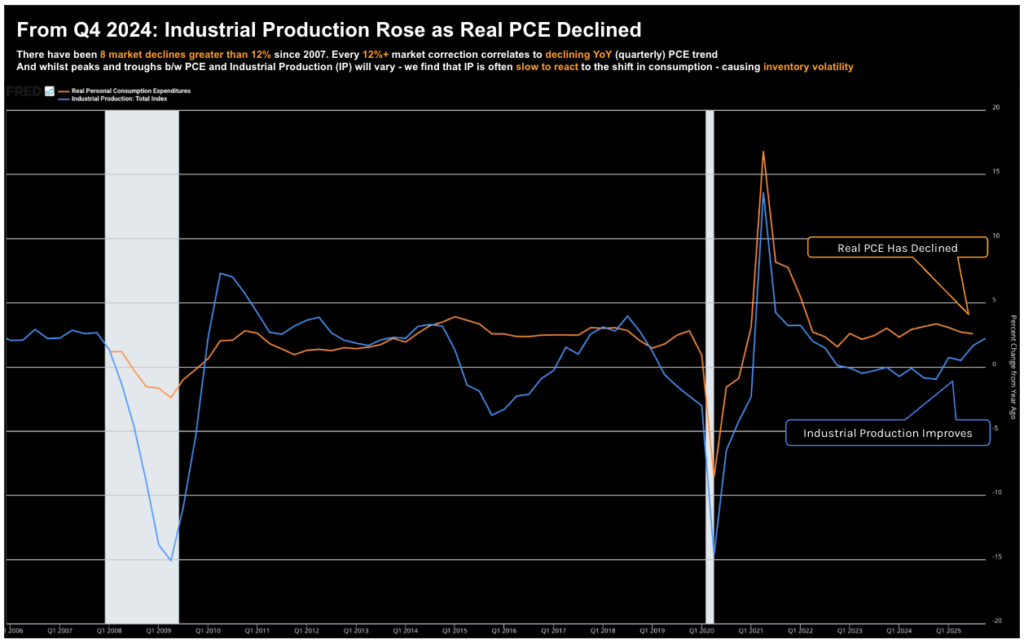
And whilst we"re not there yet… there are trends worth observing.
What Does Real PCE Tell Us Today?
Ahead of the latest earnings from leading retailers – the November 2025 survey tends to support the "robust" narrative on the surface.
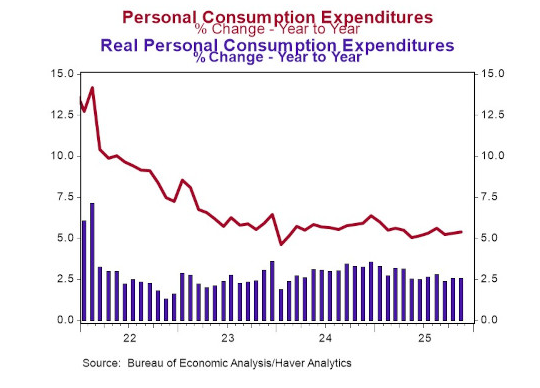
Note: the purple bars above correspond to our (longer-term) orange line in the previous chart.
The Bureau of Economic Analysis showed that personal consumption rose 0.5%, with goods spending leading the way at 0.7%.
However, the quality of the income driving that spending remains a point of contention. Private-sector wages and salaries rose 0.4%, finally beginning to outpace government transfer payments, which grew by only 0.2%.
That"s the good news…
However, over the past 12+ months, government transfers have been a disproportionate share of the consumer"s monthly spending power—rising a massive 8.8% year-over-year compared to a 3.9% increase in private sector wages.
This reliance on government support is a "non-desirable" long-term source of income. While the tides may be beginning to turn toward private earnings, the cumulative weight of the last three years remains a heavy burden.
Mike Shedlock of Mishtalk.com offered this useful chart:

Every month since April, real spending has exceeded real income. As I like to say – "never underestimate the American consumer"s willingness to spend."
The Inflation Caveat
The Federal Reserve"s preferred metric, PCE prices, rose 0.2% in November, bringing the year-over-year reading to 2.8%. This represents a slight acceleration from the 2.6% rate seen in late 2024.
Inflation isn"t necessarily plummeting – it is merely rising at a slower pace. For the average consumer, whose non-discretionary costs are now permanently higher, "lower inflation" is very little consolation. Lower inflation does not mean lower prices.
Now if Real PCE is the engine of the US economy – the housing market is the structural frame. The December plunge of 9.3% in pending home sales is a flashing red signal.
When housing contracts plunge, the demand for more "discretionary goods" typically follows with a lag. Keep an eye on the quarterly year-over-year change in Real PCE. According to Ellis – should this decline by 2% or more for any one quarter year-over-year – a market downturn is typically 6-9 months away.
Putting it All Together
While headline retail sales and GDP figures appear resilient, the "robustness" of the economy will depend on the consumer"s ability to maintain spending in the face of stagnating real wages and higher non-discretionary costs.
-
Income Quality: Recent spending has been disproportionately fueled by government transfer payments (up 8.8% YoY) rather than private-sector wage growth (up 3.9%). It remains uncertain if private wages can fill the void.
-
Spending vs. Income: Data reveals that real spending has exceeded real income nearly every month since April, suggesting a reliance on savings or debt that may eventually snap.
-
The Housing Signal: A 9.3% plunge in pending home sales serves as a warning. Housing activity typically leads discretionary goods spending; a significant downturn in Real PCE growth historically precedes a market decline by six to nine months.
By any measure, the U.S economy of late 2025 remains a case study of contradictory signals.