Stocks Worst Month Since March 2020
- Trader"s Almanac suggests 87% chance of a negative year
- Why I scooped up quality names on the dip to ~4200
- Volatility far from over…
"As goes January, so goes the year"
Or so it is said…
Well let"s hope not.
According to Stock Trader"s Almanac, going back to 1950, that metric of January"s performance predicting the year has worked 87 percent of the time with only nine major errors.
In the years January was positive, going back to 1945, the market ended higher 83 percent of the time, according to CFRA.
My prediction for single-digit gains this year is now "against the odds"… so we will see how things go (maybe my forecast will make for the 10th anomaly since 1950)
Unfortunately for some, January 2022 was the worst month for major indices since March 2020.
At its high, the S&P 500 traded 4817. At its low we touched 4221.
That"s a ~12.4% swing… which I felt was a terrific opportunity in quality stocks.
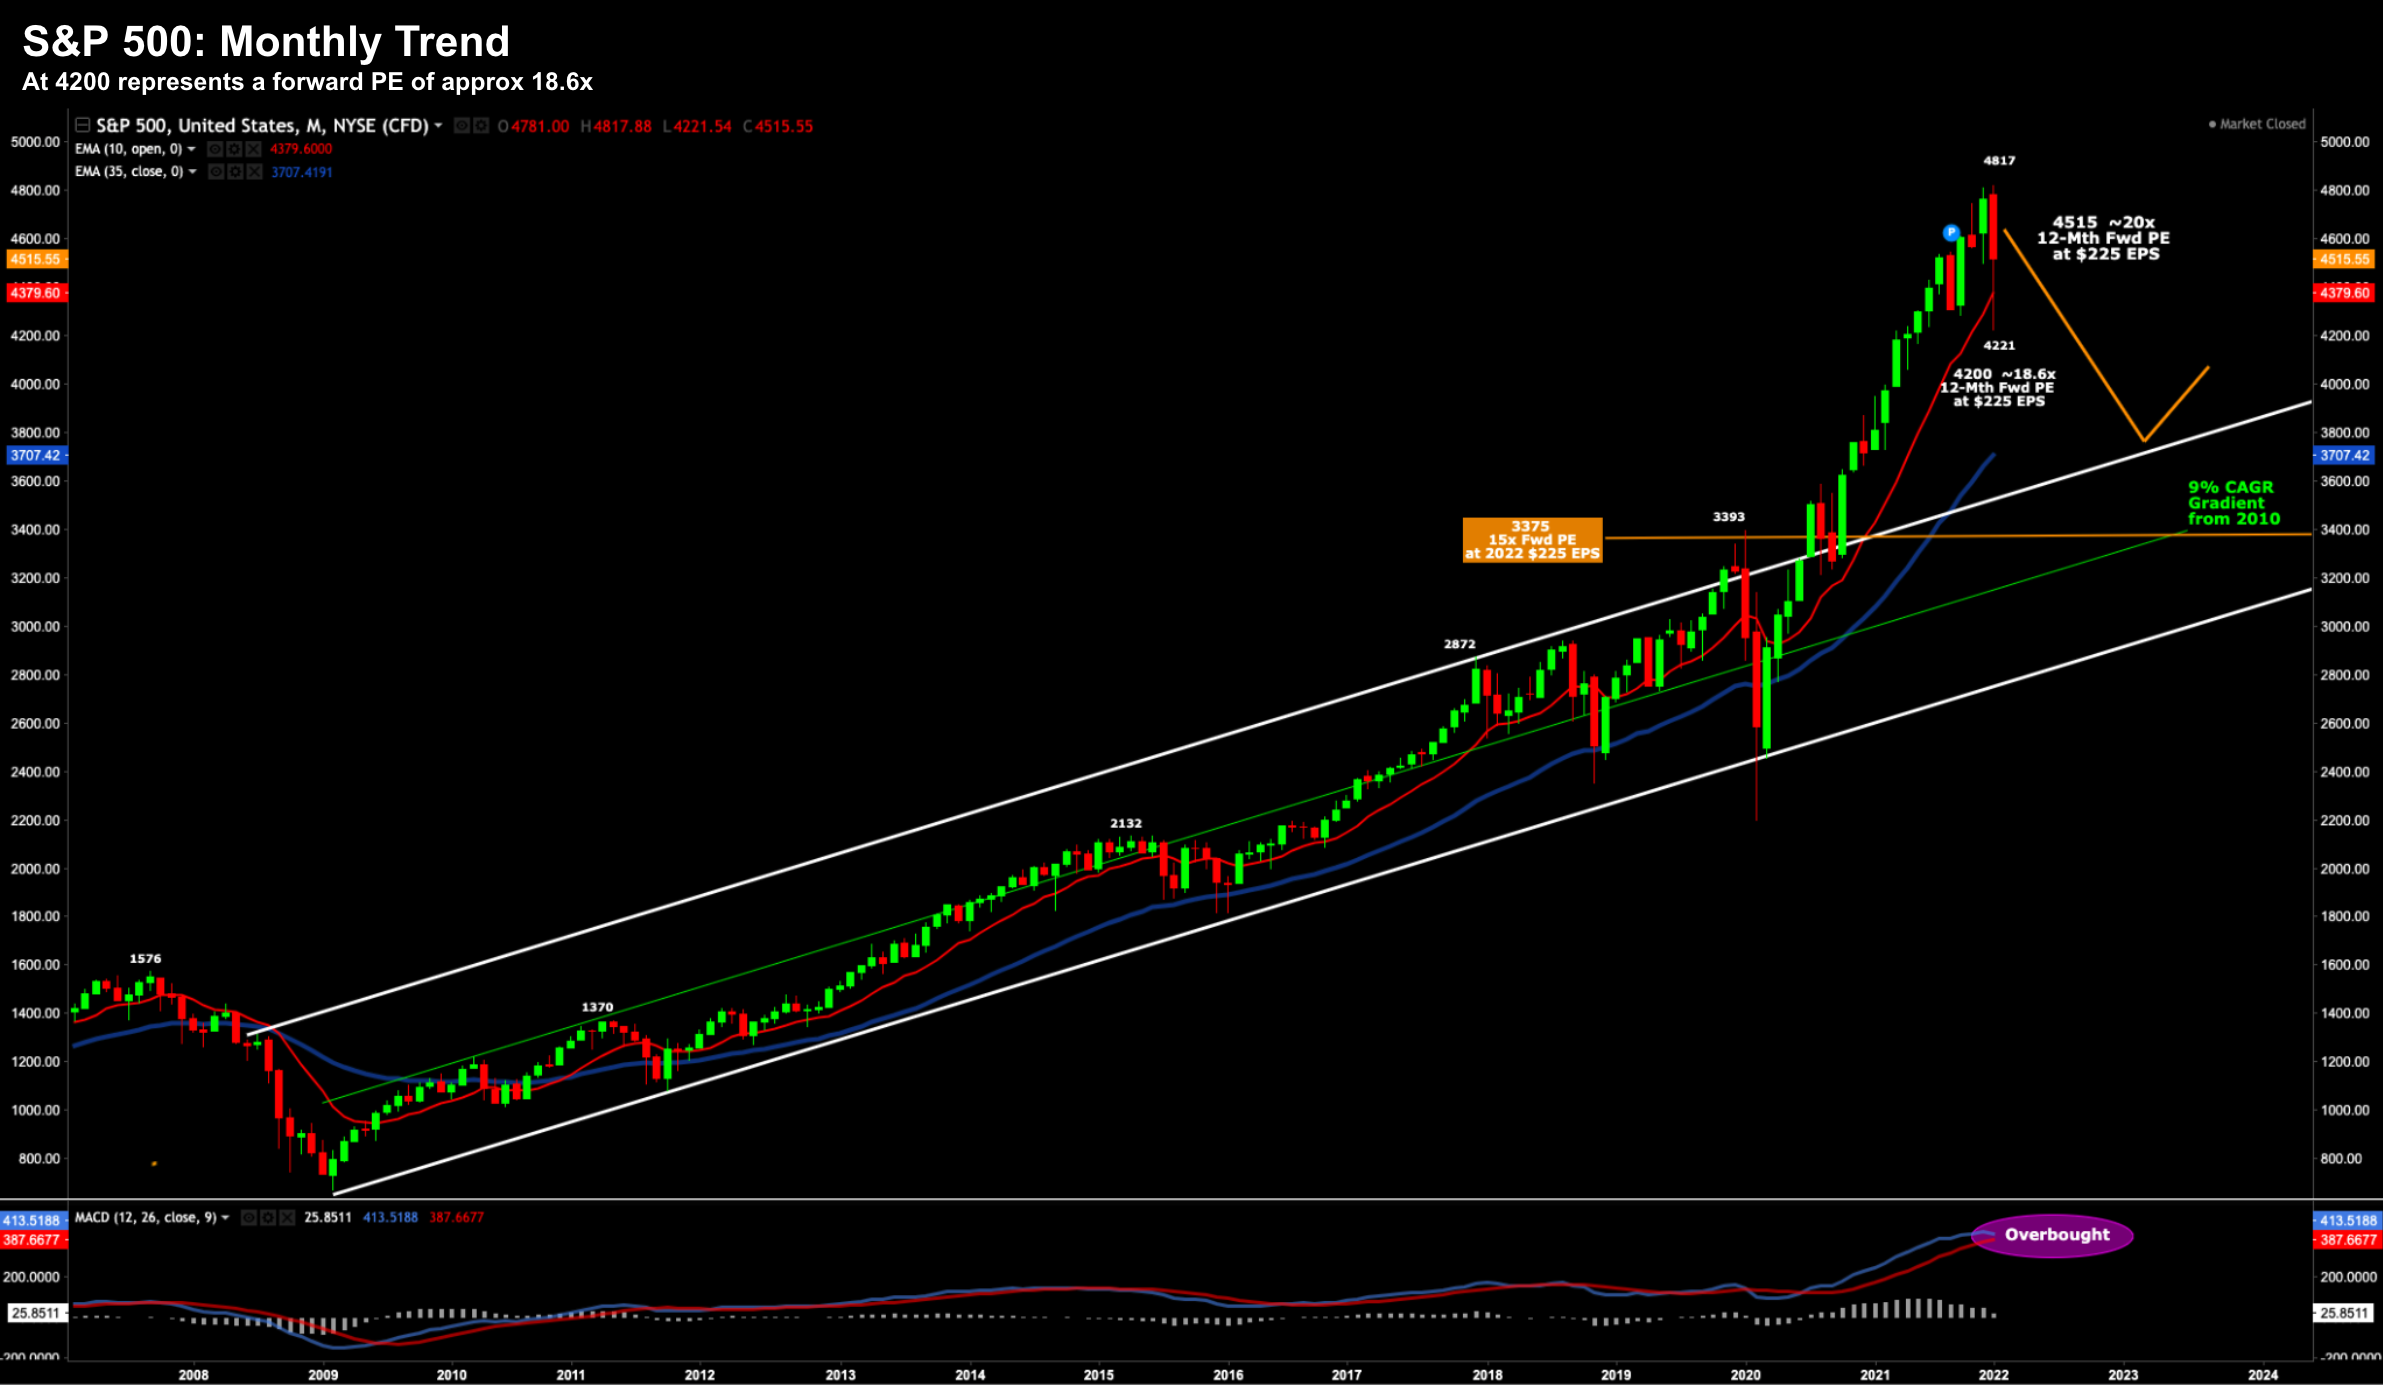
Let"s start with the monthly chart (which offers us a useful perspective):
January 31 2022
Whilst January may have given some investors a few headaches… when put into perspective… it"s easy to see why the market gave up ground.
However, we can also see there"s scope for more (as I will explain in a moment).
The monthly timeframe shows the near vertical ascent we have seen since March 2020.
That kind of momentum is highly unusual and unsustainable.
Consider the green line showing the average 9% CAGR of the past 10 years or so.
That"s what you would expect stocks to do over the long term (plus any dividends).
4200: ~18.6x Fwd PE
From a fundamental lens (and with the S&P 500 trading around 4200) — I added to Index positions (both in my personal and 401K accounts)
For example, a level of around 4200 represents a forward PE of ~18.6x (based on forward EPS of $225)
From mine, this is a reasonable risk/reward in a negative (real) interest rate environment.
What"s more, the overhang of ample liquidity is not about to disappear "overnight".
Yes, the Fed will likely end its taper around March…. but their balance sheet is not contracting (not yet).
As Powell said last week "we have not even started those discussions".
That will come… but it"s not today
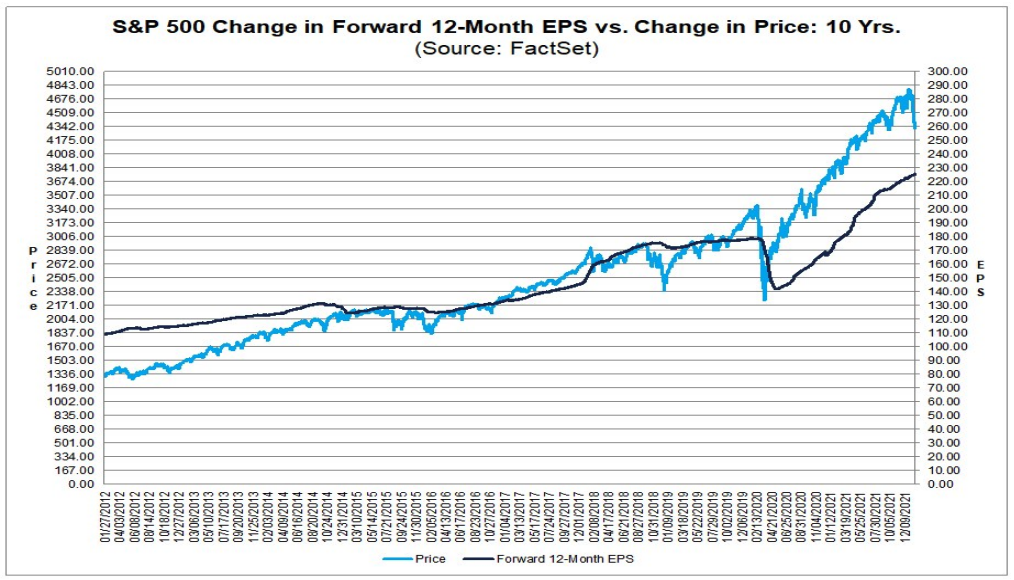
Source: Factset Earnings Insight – Jan 28
The other chart which offers perspective is this from Factset;
Forward 12-mth EPS (dark-blue and RHS) vs the S&P 500 (light-blue LHS)
Ultimately stock prices track earnings.
And whilst there will always be short-term divergences higher and lower – over the long-term – this always holds true.
But you can see the delta which has opened up post March 2020.
This has been entirely due to multiple expansion – thanks to two powerful forces:
- sustained negative real rates; and
- the Fed"s (massive) bond buying program (QE)
This has been rocket fuel for stocks.
No other way to put it…. that"s what QE does.
It doesn"t "really" support the real economy… however it propels risk assets!
However, when these two forces reverse (and they will) – we will then experience multiple contraction.
We had a small hint of that in January – particularly with growth (or low-to-no earnings) stocks.
Stocks which traded at crazy multiples like "20x sales" or "60x earnings" were punished.
It was even worse for no-earnings companies.
But quality companies which saw their forward PEs fall from say 30x to maybe 25x (or less) – which are growing earnings at 20% – were snapped up.
That"s what I did….
Expect More Selling / More Volatility
Personally I think the near-term rally was expected – something I sketched in last week.
But I am not ruling out another leg lower.
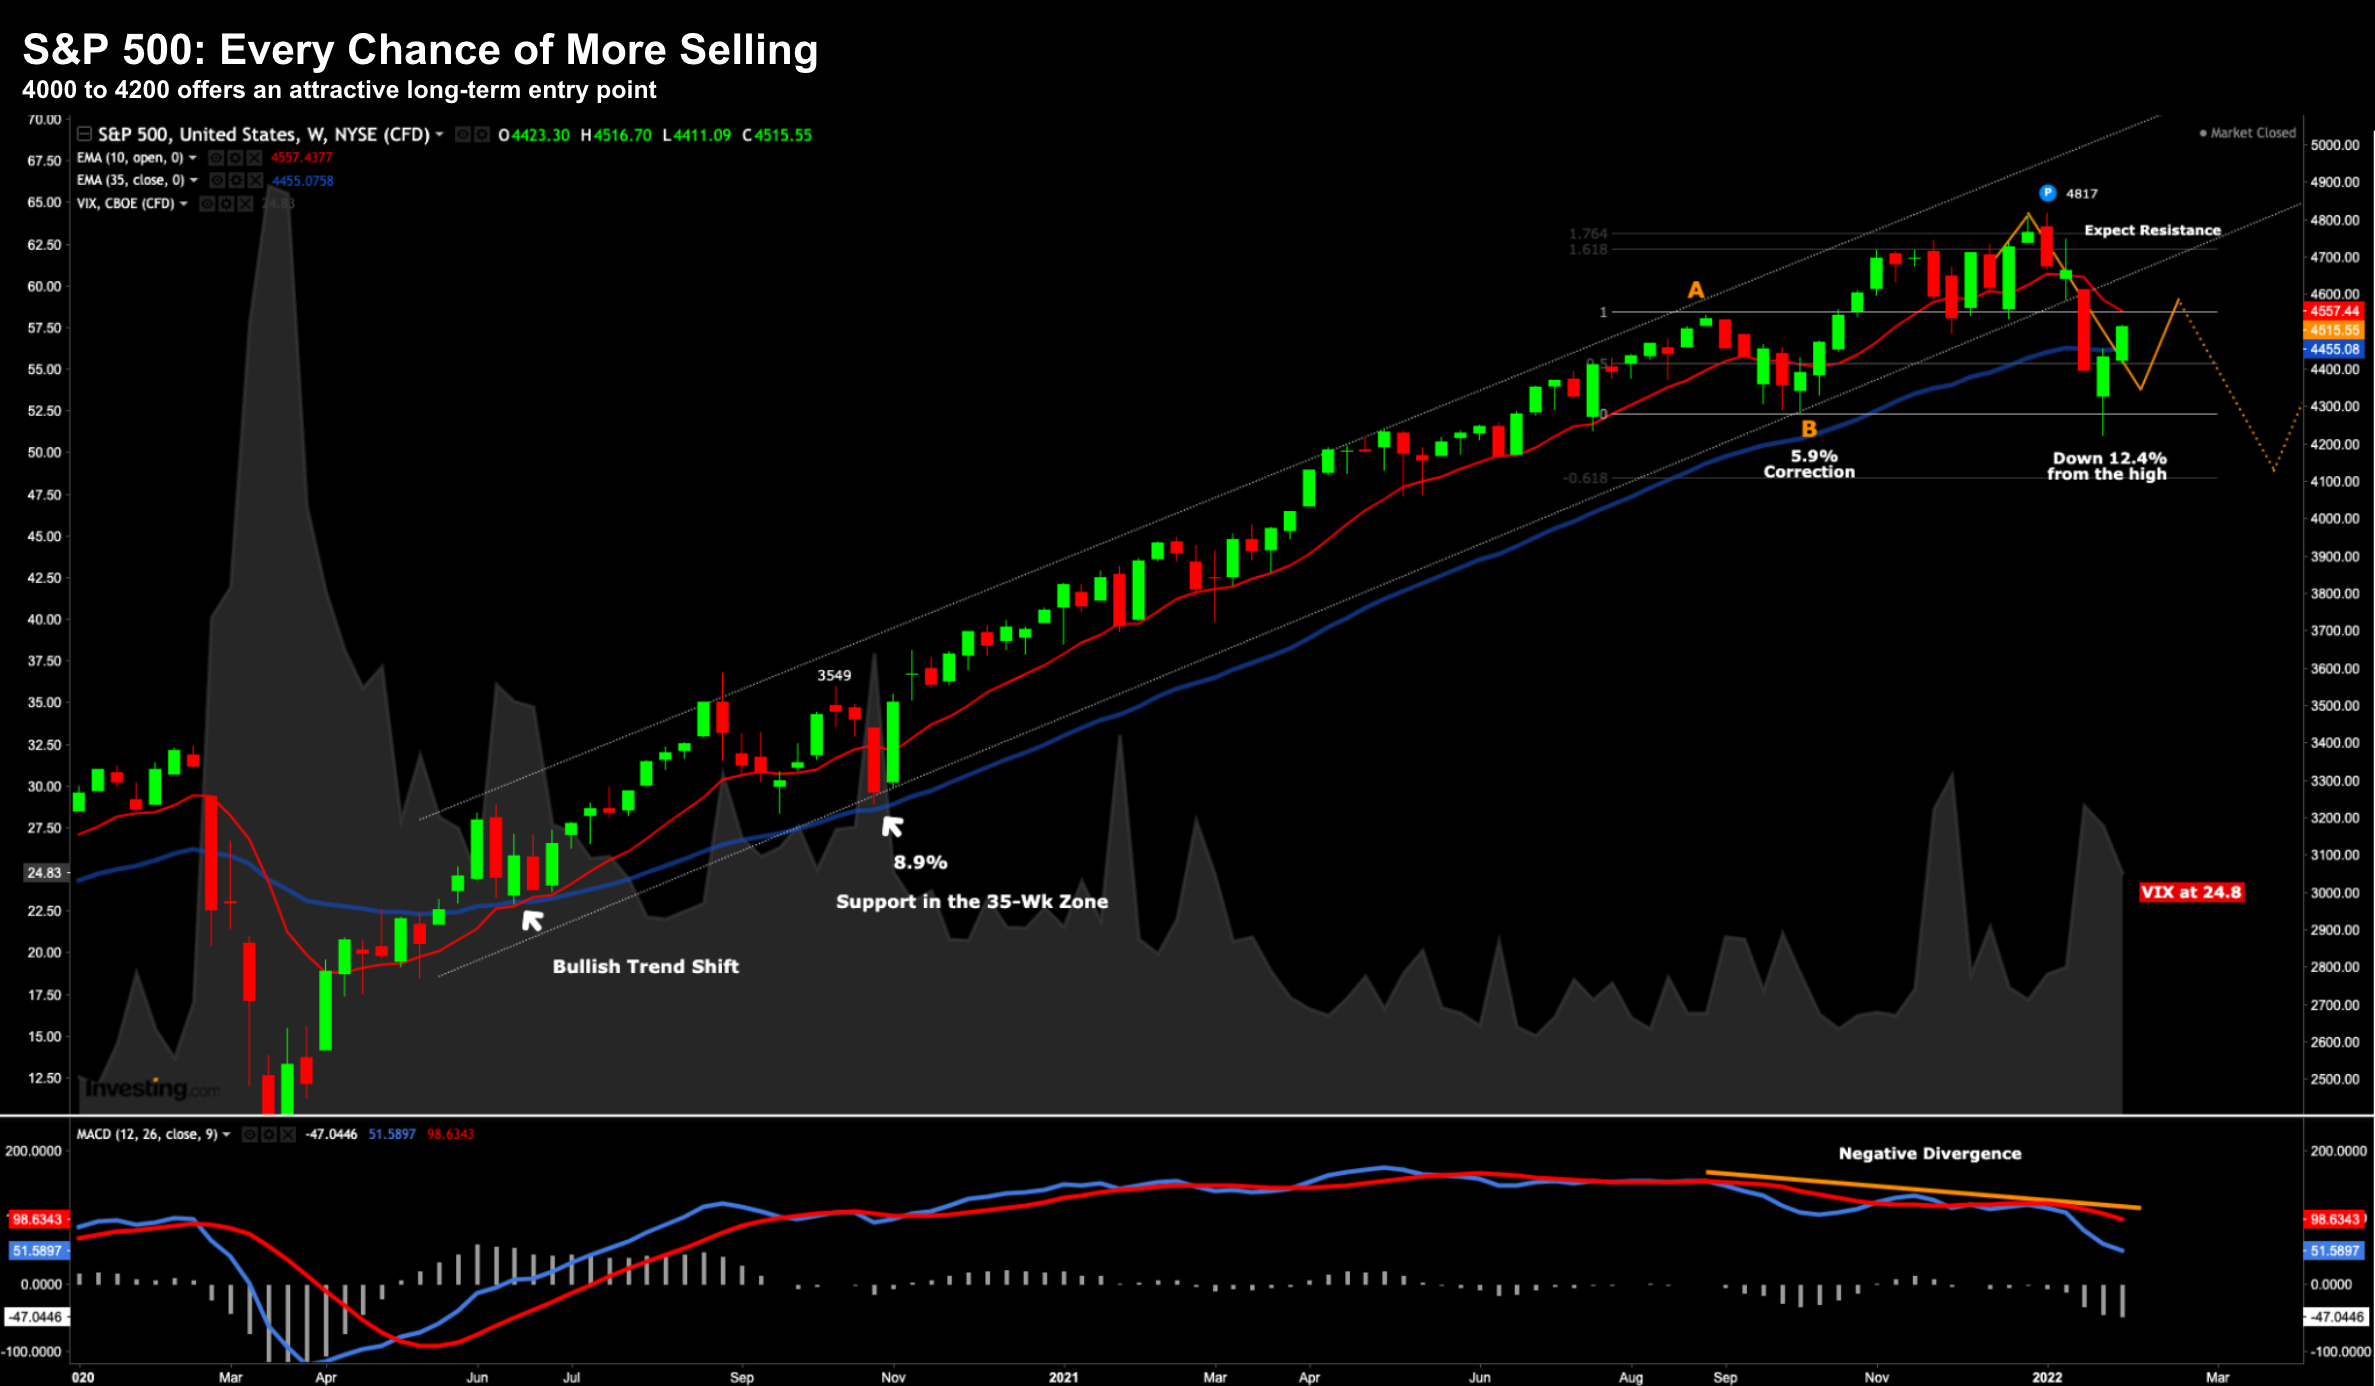
January 31 2022
This is the weekly chart for the S&P 500…
Readers will know I sketched in the move down to the 35-week EMA zone from the beginning of the year.
For example, here"s the same chart I offered readers Jan 3rd:
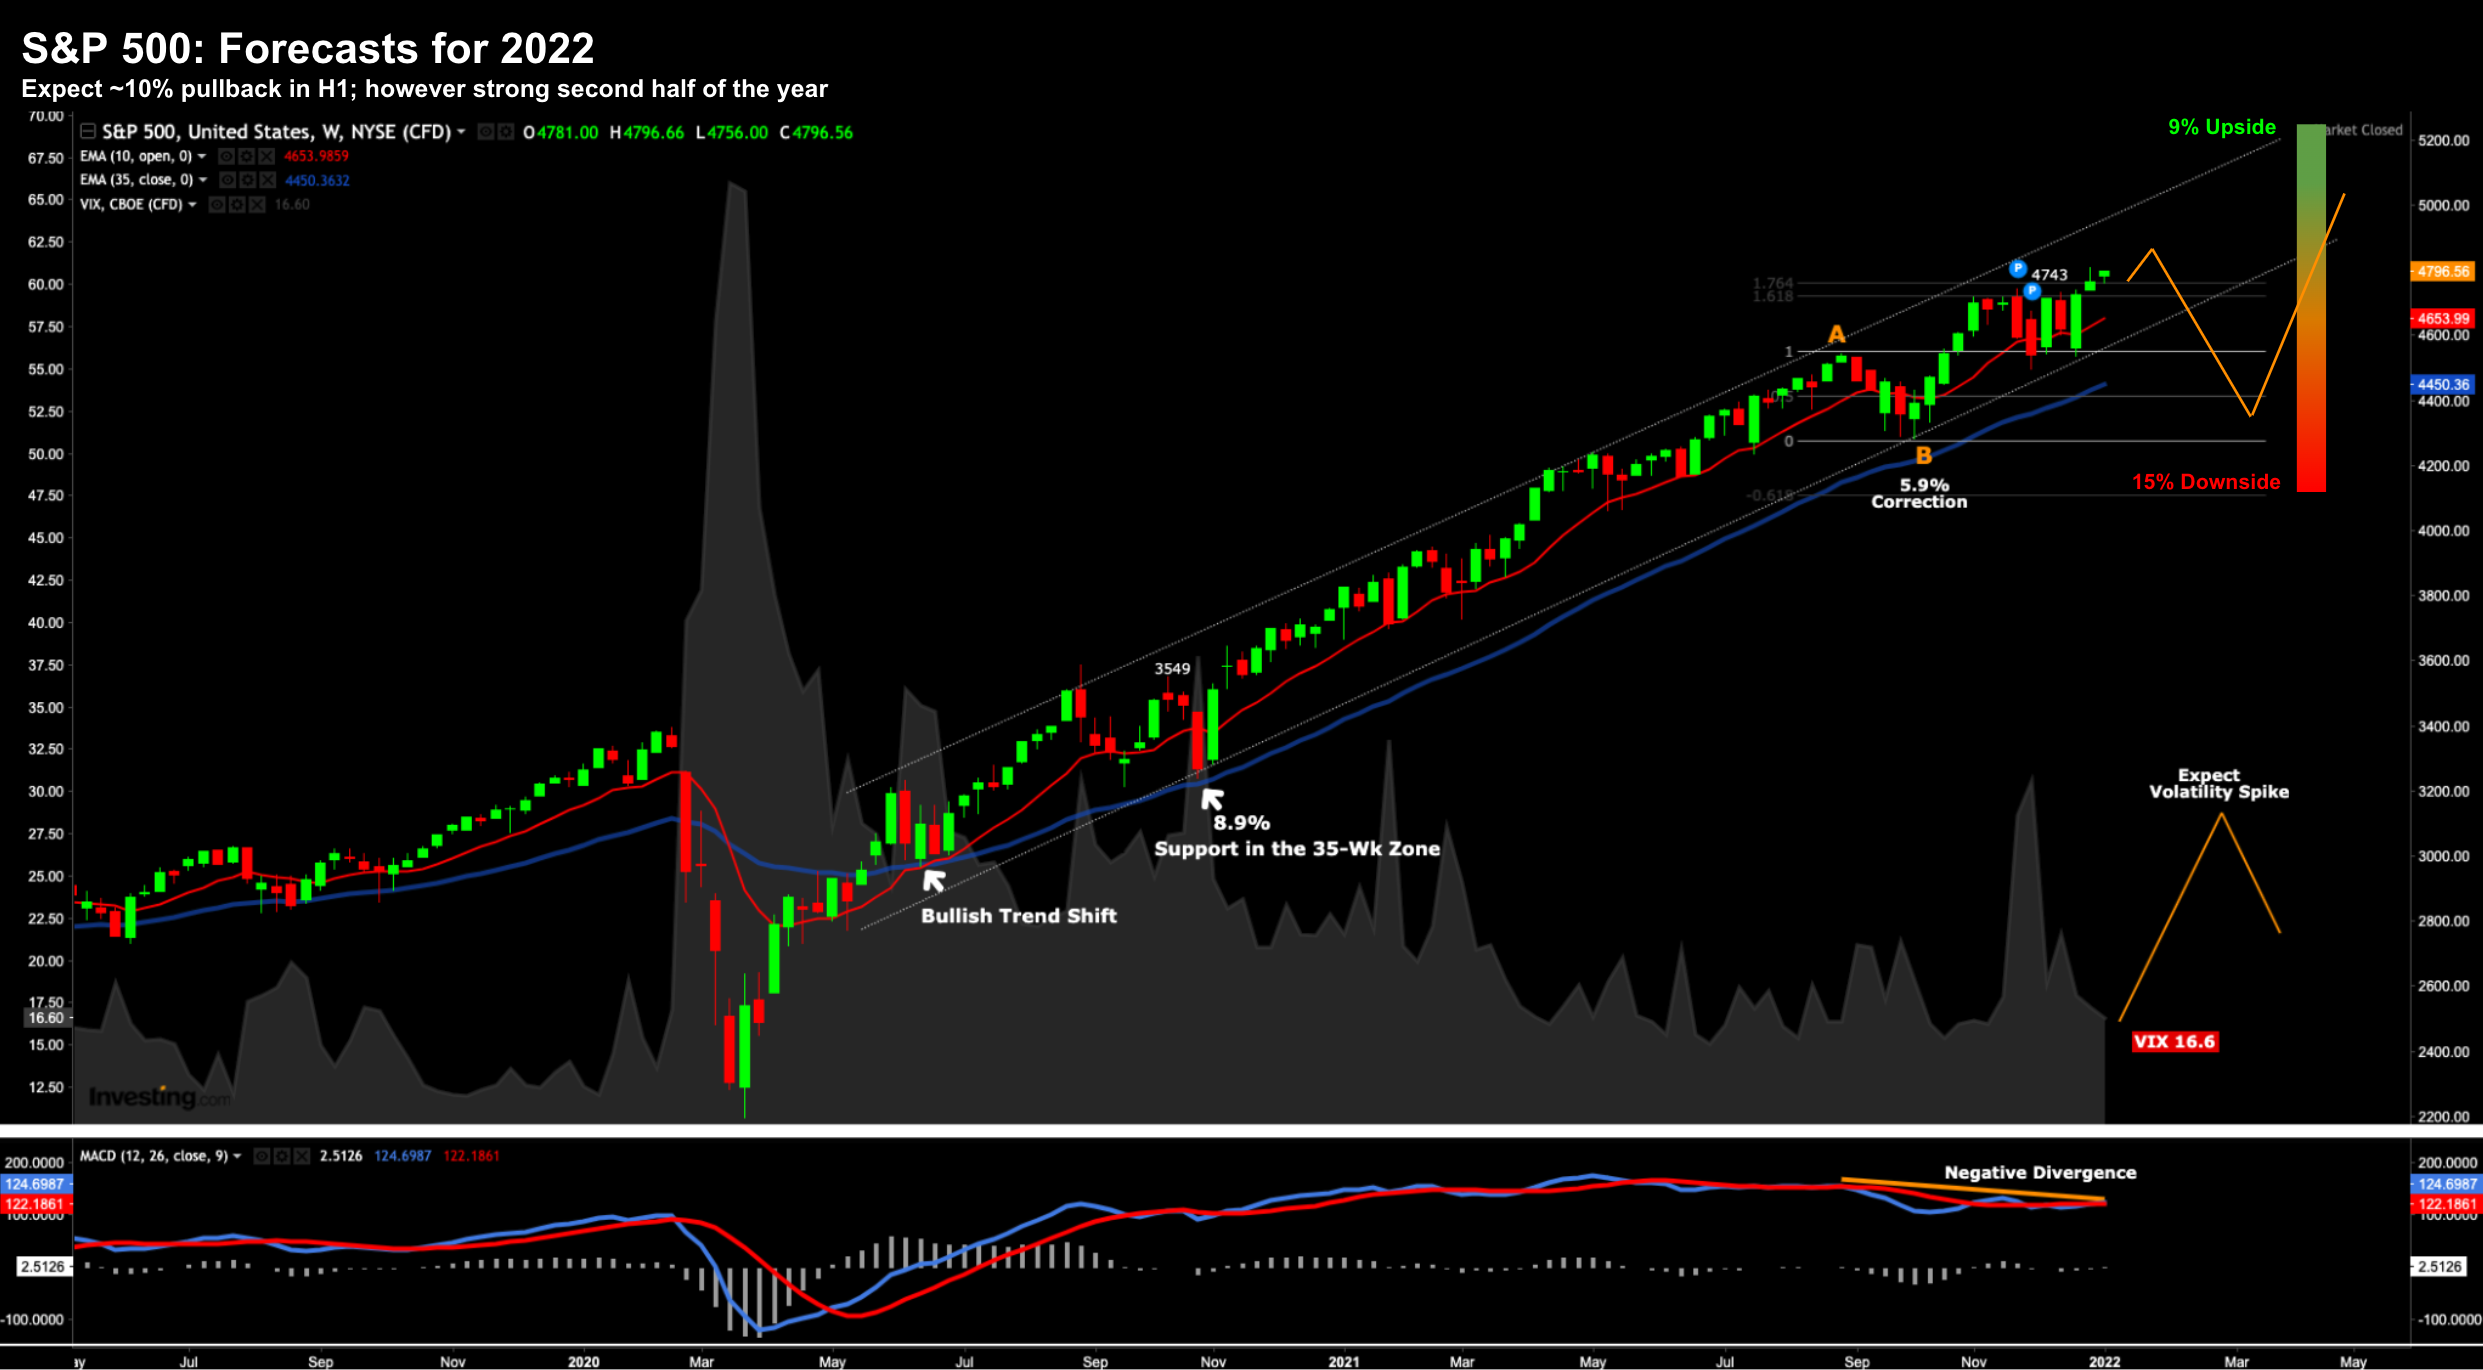
Here I was looking for two things:
- A 10-15% move lower in the first half of the year; and
- A large volatility spike
We got both… much faster than I expected.
For clarity, for the full year I think we will finish positive (i.e. defying the old Wall. St maxim for January!)
But I think there"s a lot more volatility ahead… especially as it pertains to the Fed.
Who knows how aggressive they will be in terms of rate hikes.
The market has pretty much priced in as many as four hikes… maybe five?
But what about potential balance sheet reduction at the end of the year? That would change things.
More Fed will equal more volatility.
And as such, I think you will get another "bite at the cherry".
Putting it All Together…
From mine, nothing has really changed fundamentally.
From a stock market (or risk asset) perspective:
- Liquidity is abundant (and will be for 2022);
- Rates will remain deeply negative in real terms (despite 4 or 5 Fed rate hikes);
- Credit spreads remain narrow – suggesting the market sees no widespread risks of default; and
- The shape of the yield curve remains positive by around 60 basis points.
If we put that together – this remains a "risk-on" vs "risk-off" environment.
Yes, the yield curve is much lower than where we were the past 12-18 months… especially as the 10-year yield falls back below 1.80%
And that"s something to watch…
For example, if the 2/10 turns negative — then we can start our "recession clocks" for approx 12-18 months hence.
But for now, my preferred (real-time) financial indicators remain favourable for risk assets.
This isn"t a recessionary environment… but it doesn"t mean it wont be volatile.
Don"t confuse the two.
That is, 10-15% dips should be seen as buying opportunities in quality names.