The Ultimate Contrarian Signal
Words: 1,032 Time: 5 Minutes
- When everyone leans to one side of the boat
- Invert. Always invert
- Don"t forget the long-end of the curve
It seems we're all bullish now…
The article above reminds of an old saying:
When everyone is leaning to one side of the boat – it"s time to move to the other side.
Turns out the vast majority of fund managers have turned bullish for next year – citing earnings growth of more than 12% for the S&P 500 – and over 20% for the Mag7.
From my lens, "leaning to one side" usually happens when market participants stop looking at value and start looking at price momentum.
And that"s a risky proposition…
Price is not equal value.
As our dear friend and mentor Charlie Munger would say "invert, always invert."
For example, if the boat is leaning toward "safety," you should be looking for the "risk."
However, it"s leaning toward "optimism and aggressive growth" (which I will talk to below) – you should be looking for "valuation."
And that"s where I am…
Are We All Leaning One Way?
Further to the article cited above, Bank of America"s Bull & Bear Indicator has surged to 8.5, officially triggering a contrarian "sell" signal for risk assets.
However, this signal is not the best timing tool.
For example, the 16 times its triggered since 2002 – it only boats a 63% accuracy rate – where the average drawdown over the next three months is around 8.5%
But here"s something else:
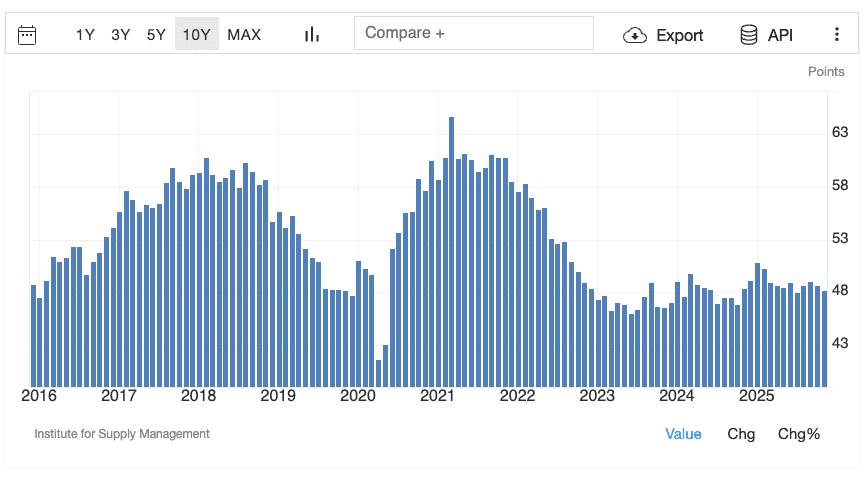
Investor sentiment quite often enjoys a close correlation with sentiment in the Purchasing Manager"s Index, a survey of supply-chain managers responsible for corporate buying.
However today we find divergence... as investors continue to buy the market despite the (weak) trend in PMI.
The ISM Manufacturing PMI for the US fell to 48.2 in November 2025, the lowest in four months.
The reading showed that the manufacturing sector contracted for the ninth consecutive month and at a faster pace, led by pullbacks in supplier deliveries (49.3 vs 54.2), new orders (47.4 vs 49.4) and employment (44 vs 46)
From mine, it would seem investors are betting the PMI is about to reverse course?
I say that because money continues to pour into stocks – with a record $145 billion weekly inflow into equity ETFs.
As I mentioned the other day, investors are betting on a "run it hot" scenario fueled by tax and tariff cuts.
BofA"s Michael Hartnett notes a potential 9% EPS growth for 2026 – however warns of "bond vigilantes" and a potential slowdown in the AI capex boom.
This aligns with my argument regarding late-cycle phases and high valuations.
Flies in the Ointment?
The narrative I hear repeatedly on networks such as CNBC and Bloomberg goes something like this:
- Earnings will continue to grow double-digit next year – led by the Mag7
- Fed will continue its rate cutting well into the recovery (2 or 3 more cuts in 2026)
- Economy is growing at a ~4% nominal rate – enabled by further fiscal expansion
- Tariff and inflation risks have largely evaporated (i.e., a once-off effect); and
- Whilst tech will lead – we are likely to see broader sector participation
This is what I would consider the "goldilocks scenario".
And it"s a narrative you will hear repeatedly.
But what are the flies in the ointment?
Here Hartnett touches on a big one… the (dire) fiscal situation.
For example, if debts and deficits are to continue at the current pace, when we should expect the long-end of the curve (e.g. 10-year) to rise.
That"s not priced into the market.
This will in turn cause our yield curve to continue to steepen – which is generally where "economic accidents" occur.
For those less familiar, inversion of the yield curve is the diagnosis of an unhealthy economy; steepening is the onset of the symptoms.
In this case, we have Bear Steepener – which occurs because long-term yields rise faster than short-term rates.
This signals that the market is losing confidence in the Fed"s ability to either (a) control inflation; or (b) is revolting against massive government debt issuance.
And from mine, it"s more the latter.
For example, the CBO reports that over the past 12 months, total revenue was $5.3 trillion compared to $4.9 trillion over the same period prior.
However, spending was $6.9 trillion over the past 12 months matching the $6.9 trillion in the same period prior.
The $1.6 trillion deficit over the past year would have been $1.7 trillion if not for timing shifts.
Consider the following:
- Nominal GDP: $30.1T – $30.5T — total US economy.
- Federal Revenue: $5.2T – $5.3T — 17.3% of GDP (Revenue Margin).
- Federal Spending: $7.0T — 23.3% of GDP (Operating Expense).
- Annual Deficit: $1.6T to $1.7T — ~6.0% of GDP ("Net Loss").
- Net Interest Cost: $1.0T+ — Now exceeds the Defense budget; a "Fixed Charge" risk.
As I like to say – the US government does not have a revenue problem. They are taking 17.3% of GDP.
What they have is a massive spending problem.
They are living beyond their means.
And if this continues – all eyes should remain fixed on the US 10-year yield (i.e., the primary determinant of borrowing costs)
Whilst the Fed may well cut at the short end… they don"t control the long end.
Today, the market"s "goldilocks" scenario above does not consider the US 10-year yield creeping back above 4.50% (which is not high by historical standards)
Putting It All Together
For what it"s worth – I"m not bearish.
For example, I don"t have any short positions or put options. And nor am I selling my stocks in a great hurry.
However, I am very mindful of the risks.
Despite being ~65% long (in quality names — ie those which generate a large amount of free cash flow and boast average 20%+ ROIC"s the past 5+ years) – I would be quite happy to take advantage of a 15% to 20% pullback if it were to present.
Consider the following:
- Consensus EPS Estimate for 2026: $310 – $315
- Implied EPS Growth (YoY): ~10% to 15%
- Top Contributors: Mag 7 (22.7% growth)
- The "S&P 493": ~11.3% growth (i.e., the "broadening out" of earnings across traditional sectors)
- Projected Net Margin: 13.9% — the highest level since 2008
Let"s assume we get the Index growth of ~11.3% to $310 per share (which is not without risk).
With the S&P 500 trading around 6830 – that"s a forward PE of 22x (not cheap by any measure — especially with the risk-free rate above 4.0%)
This tells me the market needs everything to go right to justify the prices being asked today; i.e., there is zero margin of safety.
For example, if we assume the 10-year avg forward PE multiple of 18x – that will take us to 5,580 (… and that"s if we get the 11% earnings growth)
What if earnings growth comes in lower than 11%? What then?
There"s your 18% correction (just on multiple compression)
Stay patient.