Buying Peak Fear: Why a VIX Above 45 is a Rare Long-Term Opportunity
Words: 1,165 Time: 6 Minutes
- VIX hits 45…. Buying "Peak Fear"
- Valuations more attractive – but more to go
- Why we could see 4700 on the Index
It"s official….
The stock market is now "on sale".
For those who resisted the siren song of extreme valuations over the past year—refusing to let the fear of missing out dictate their capital allocation—your patience has been rewarded.
Valuations have finally come down.
In turn, the longer-term risk/reward ratio is exponentially more attractive today than it was just a few months ago.
But these are rare times.
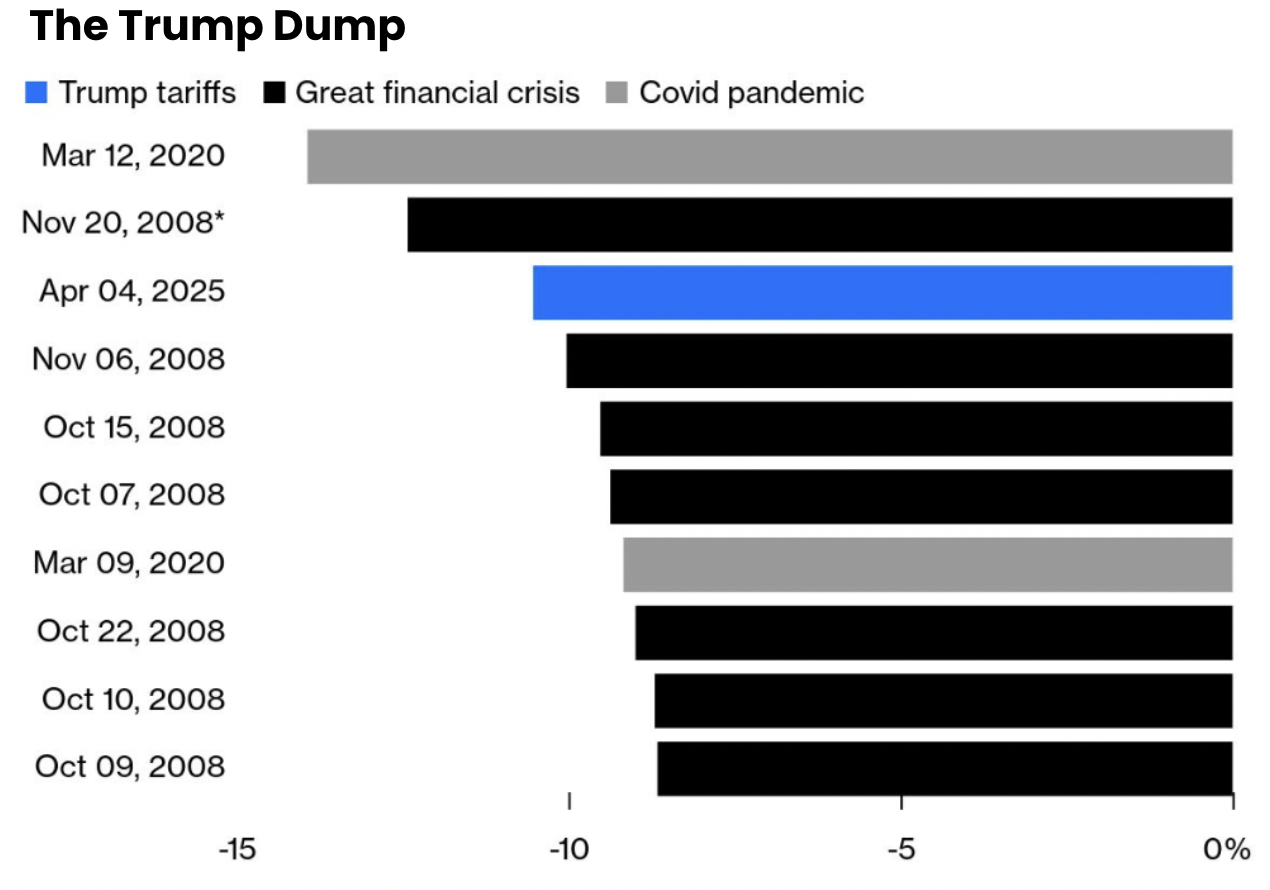
For example, aggressive two-day selloffs exceeding 10% on the S&P 500 are historically scarce. When investors hit the sell button this fast and this hard, it echoes the sheer panic of events like 1987"s Black Monday.
To understand the opportunity, we must invert the situation. When markets plunge, the amateur asks, "How much more could I lose?" The professional inverts the problem and asks, "What guarantees a permanent impairment of my capital right now?"
The answer to that question is almost always capitulating and selling fundamentally sound businesses simply because their daily quoted prices are flashing red.
Bloomberg summarized the 10 greatest two-day selloffs in this century; and the recent geopolitical-driven dump ranks among the most severe.
Welcome Back Vol – We"ve Missed You!
For several months, markets suffered from severe recency bias, assuming the smooth sailing of recent quarters would stretch indefinitely into the future. They were extremely complacent about the potential risks.
For example, as part of this post, I highlighted some of the growth headwinds which were not being adequately priced.
At the time, the post was not widely read:
From mine, there are a host of (growing) risks which jeopardize aggressive earnings growth this year ("Ready for a Growth Scare?"). For example, we have a perfect storm of factors, including (but certainly not limited to):
- Reduced fiscal spend from the government;
- Stubbornly high bond yields (e.g., around 4.50% on the 10-year);
- Risk of higher inflation due to potential tariffs;
- A weary consumer – where discretionary spend is falling; and
- Various growing geopolitical risks
Fast forward a couple of months, and these risks are aggressively being reflected in the tape.
But first, let"s look at how traders hit the panic button.
Derived from options prices — the VIX surged to its highest levels since the worst of the COVID lockdowns, moving past a value of 45x.
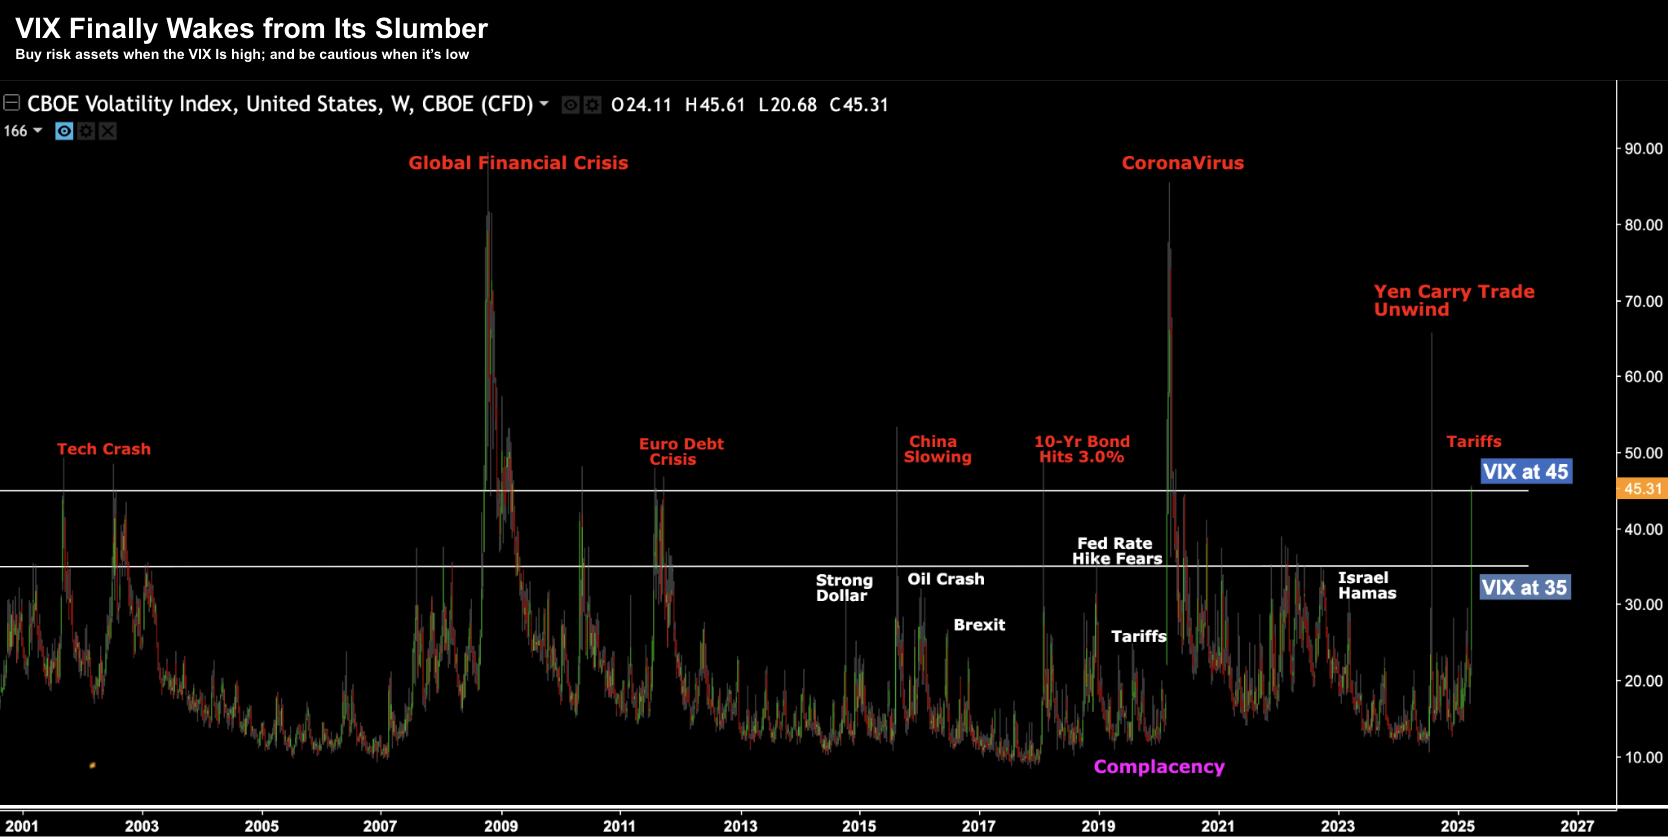
Again, this is not something you see too often.
The VIX has traded above 45 only seven times in the past 25 years.
However, as this post demonstrates, when the VIX trades at a level of 45 or more (irrespective of the cause), stocks are generally on sale.
But for clarity:
- This does not mean that stocks will not keep falling (they most likely will); and
- We cannot pick the bottom (and nor does it matter)
I say this because if your timeframe is at least 3 years, buying quality stocks (or the Index itself) generally proves to be a highly favorable risk/reward bet when buying peak fear.
Here"s another way to think about it (a chart I refer to often).
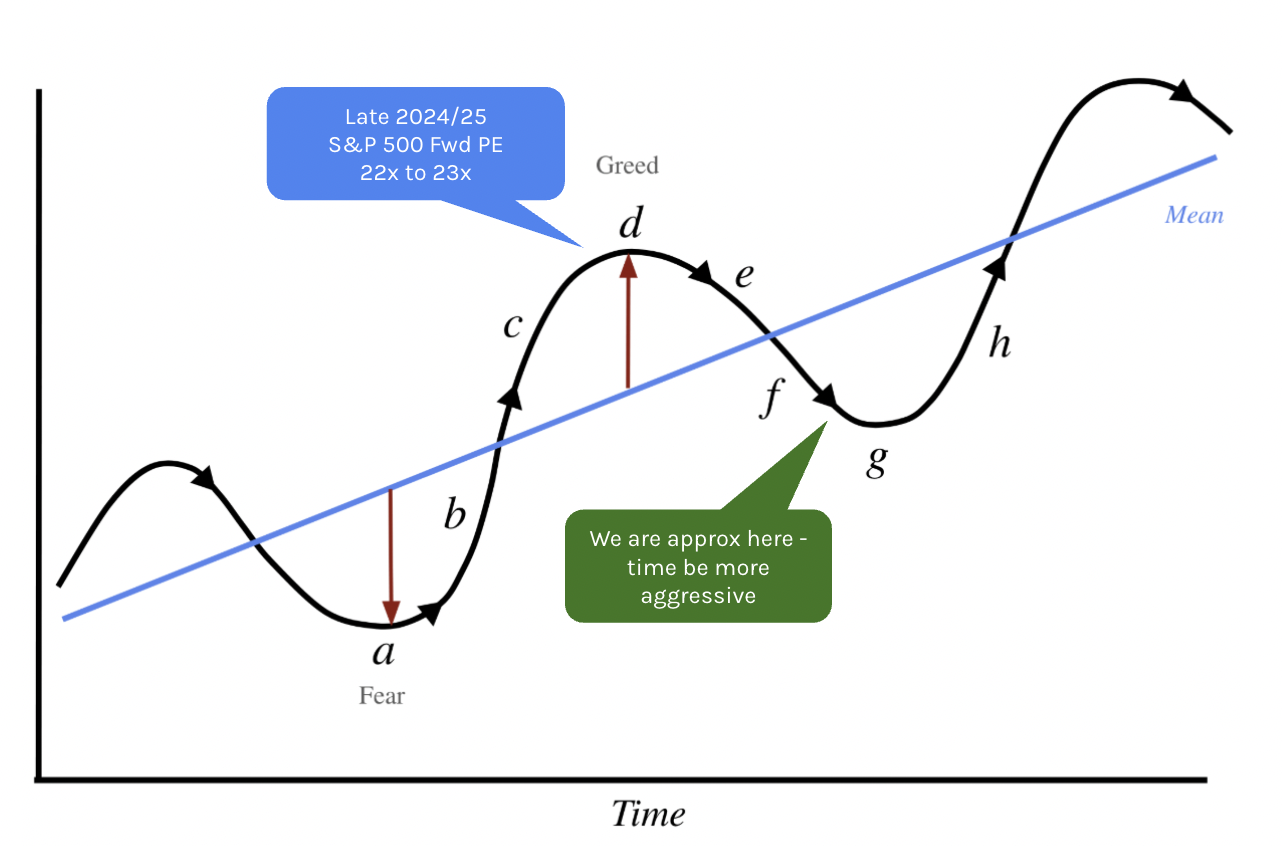
The idea is to buy stocks when we are at points "a" or "g" (i.e., fear and panic).
Similarly, the best time to sell is when everyone believes "trees will grow to the sky" (e.g., which was the case recently when forward P/E ratios exceeded 22x).
This brings us to valuations…
Valuations More Attractive
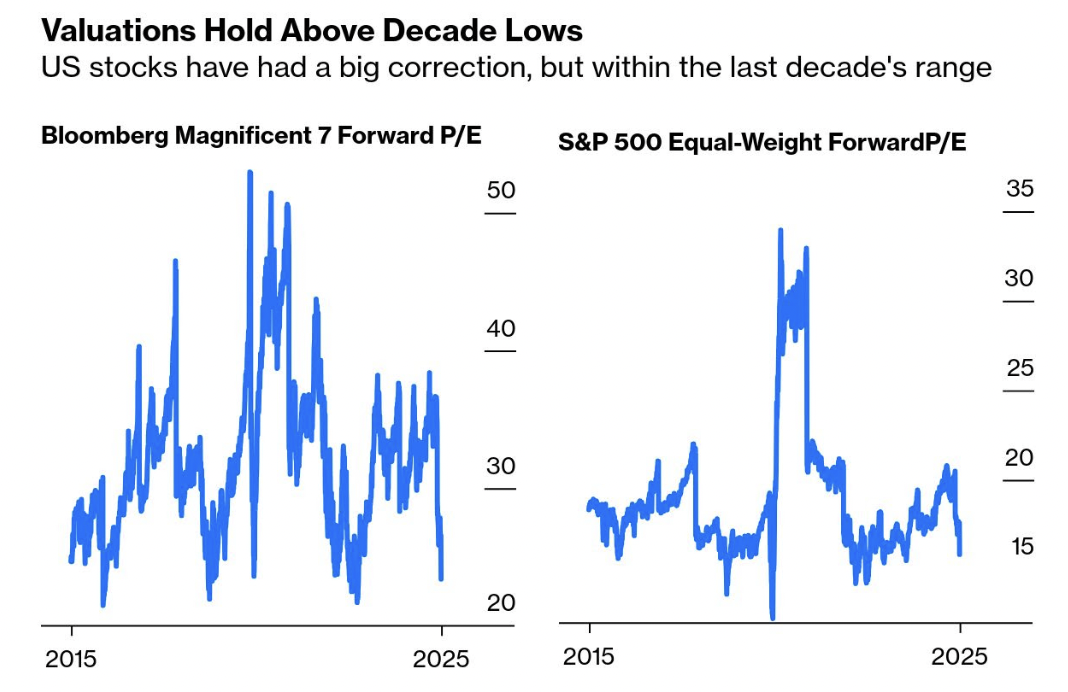
Valuations have come down a long way (good news)—but they likely have further to go.
As I will show shortly, they remain above their absolute lows for the last decade.
The challenge we now have is dimensioning what the "E" (earnings) will be in the "PE" (price-to-earnings) equation.
For example, earlier in the cycle, analysts were heavily forecasting earnings per share of $275 for the index.
| Institution | Forecast | EPS | Fwd P/E |
|---|---|---|---|
| Oppenheimer | 7100 | 275 | 25.8 |
| Wells Fargo | 7007 | 274 | 25.6 |
| Deutsche Bank | 7000 | 282 | 24.8 |
| Soc. Gen | 6750 | 272 | 24.8 |
| BMO | 6700 | 275 | 24.4 |
| HSBC | 6700 | 268 | 25.0 |
| Bank of America | 6666 | 275 | 24.2 |
| ScotiaBank | 6650 | 255 | 26.1 |
| Barclays | 6600 | 271 | 24.4 |
| Evercore ISI | 6600 | 257 | 25.7 |
| Fundstrat | 6600 | 275 | 24.0 |
| Ned Davis Research | 6600 | 254 | 25.9 |
| RBC Capital Markets | 6600 | 271 | 24.3 |
| Citigroup | 6500 | 270 | 24.1 |
| Goldman Sachs | 6500 | 268 | 24.3 |
| JP Morgan | 6500 | 270 | 24.1 |
| Morgan Stanley | 6500 | 271 | 23.9 |
| UBS | 6400 | 257 | 24.9 |
| BNP Paribas | 6300 | 270 | 23.3 |
| Cantor Fitzgerald | 6000 | 267 | 22.5 |
| AVERAGE | 6617 | 268.0 | 24.6 |
At the time, I cautioned readers to expect these earnings forecasts to come down—perhaps as low as $260 per share (or lower) as reality set in.
If $260 turns out to be accurate, and we apply an average historical P/E multiple of 18x, that puts the Index back around 4680.
This suggests there could still be more downside to come.
For now, the sell-off appears more consistent with a typical 15% to 20% correction.
Could We See 4700 for the S&P 500?
If you"ve been following this blog, the sharp move to the downside will not be overly surprising.
Its speed might be… however, in absolute terms, it should not be.
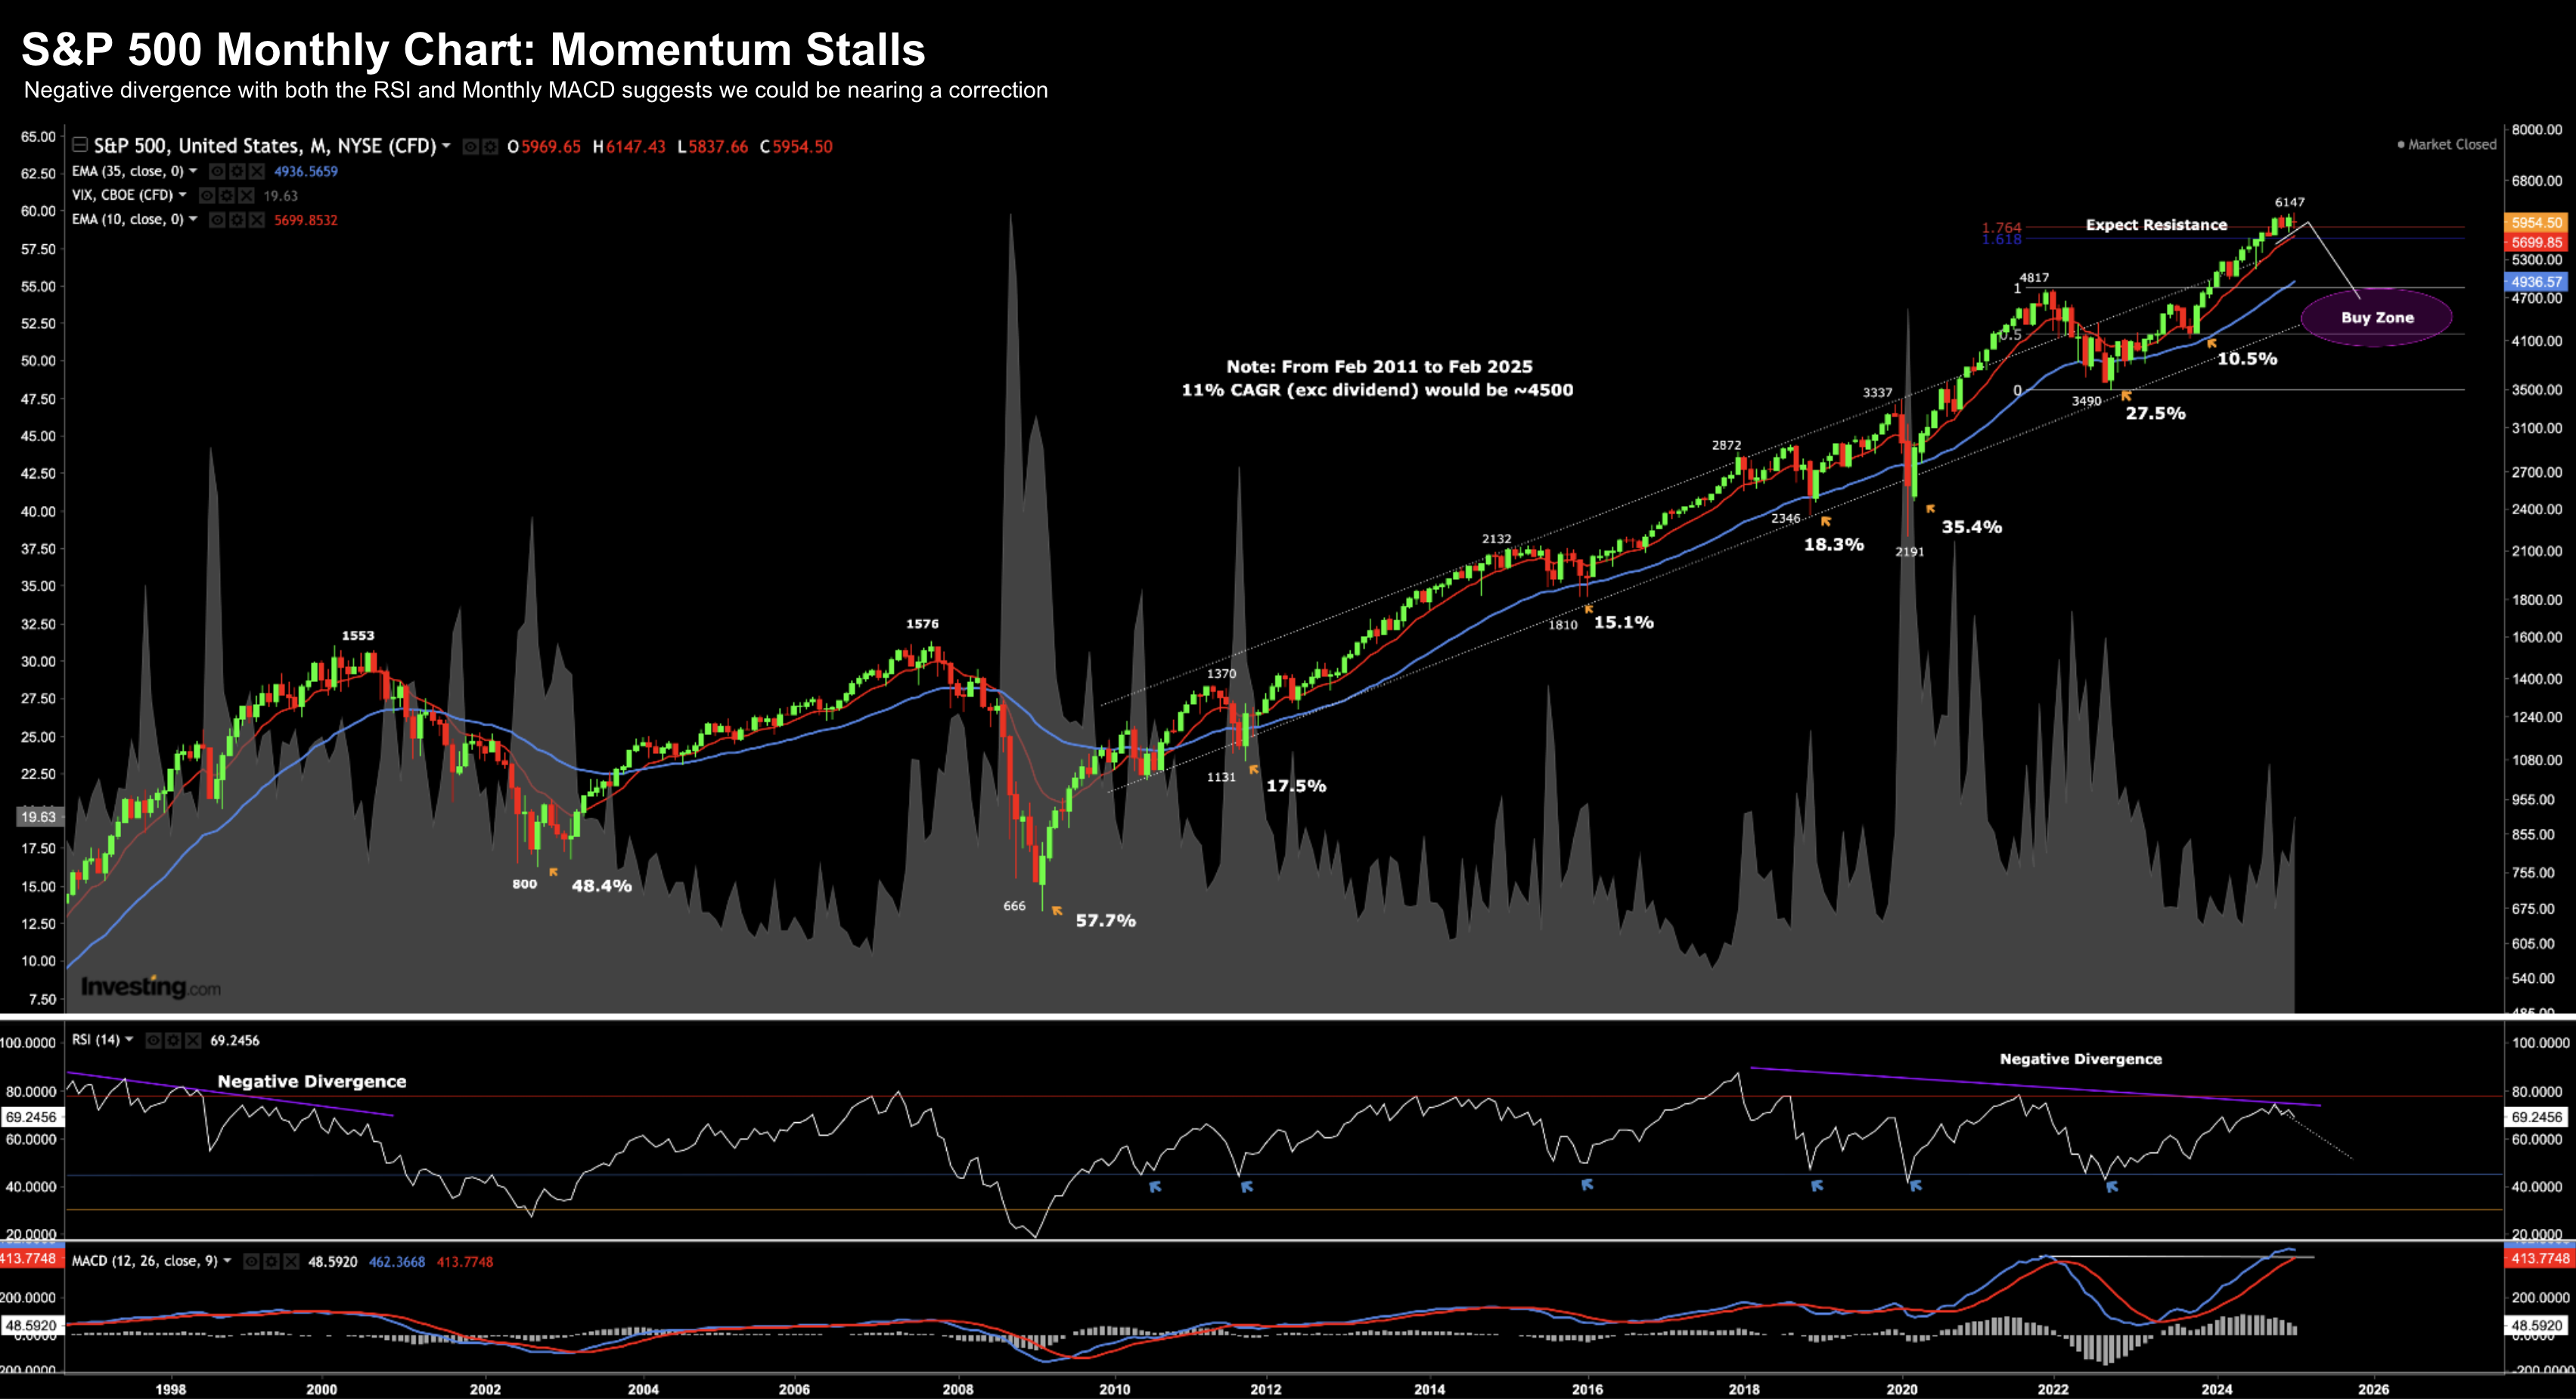
For example, scrolling back to this prior post, I penciled in a possible move to around 4700 using the monthly chart.
Prices had moved a long way from the 35-month EMA (blue line) which tends to act like a "gravitational pull."
Think back to the cycle diagram where the upward-sloping blue line is the fundamental "gravitational pull". Above and below that line is where the market works through volatile periods of fear and greed.
March 3 2025
At the time, I felt the market was highly vulnerable to a downside correction, citing falling momentum.
We observed a strong negative divergence with both the monthly MACD and RSI (lower two windows).
Let"s now check in with the weekly timeframe following the extreme sell-off:
April 6 2025
Four technical observations:
- The weekly RSI is trading at 27.6—indicating an oversold market. And whilst markets can remain oversold for several weeks (and do not perfectly indicate bottoms), typically they represent a vastly better risk/reward entry point over the longer-term.
2. The 200-week EMA (purple line) is around 4700. My best guess is this zone (not an exact level) will act as a major area of support. We saw this during the 20% sell-off in 2022, where the market traded briefly below this level for 3 weeks before catching a strong bid.
3. The third observation is what we see with the VIX (shaded blue area). It"s now at 45—a level of extreme panic rarely seen in modern markets.
4. During 2022 and 2023 the market faced heavy resistance around the 4600 zone. Quite often, previous resistance will become new support.
Put together, with the market trading around 5,000 at the time of writing, the downside risks are now starting to appear distinctly lower than the longer-term upside reward.
And whilst I think we will see further selling (with futures frequently pointing lower), we are getting much closer to finding durable support.
Therefore, you should consider adding long exposure here. But do it systematically.
For example, if you want to initiate a position in high-quality, moated technology stocks. I would buy one-third to one-half of your intended position size today. From there, I would buy another third (or half) should the asset continue to drop another 10%.
This is my approach because I know I cannot pick the exact bottom. Anyone who claims they can is either lying or lucky.
When I look at valuation metrics, I stay firmly within my circle of competence. I focus on durable assets delivering at least a 15% Return on Equity (ROE) and 15% Return on Invested Capital (ROIC). When you can acquire these types of non-cyclical assets at rational multiples—roughly 15x to 20x EV/EBIT or Price-to-Free Cash Flow—the math starts working heavily in your favor.
As a further risk mitigation strategy, avoid making any single stock more than 20% of your total portfolio. Most of my individual positions are capped between 2% and 5%.
Putting it All Together
During the depths of the panic last week, I increased my exposure to US stocks.
I added long exposure to almost all of the Mag 7 names, the ETF QQQ, and the broader Index.
And if we continue to see further downside (which I expect), I will boldly add more.
For example, should we see the S&P 500 trade around 4600, I will establish a full position in the Index.
For context, a move to 4600 represents a severe 25% correction from the previous highs.
Could it fall well below 4600?
Of course!
But that is a calculated risk I will happily take.
I am not looking to trade in and out of these new positions over the next month, six months, or even two years.
However, I am more than willing to bet the S&P 500 will be sitting at at least 6,500 in three years if you are buying at 4,600 today.
That represents a CAGR of ~12% excluding dividends.
From my lens, severe market dislocations are rarely a time to panic; they are a great long-term opportunity for patient, reason-respecting investors.