Wall St. Cut Expectations for 2022
- Does the upside potential for 2022 outweigh the downside risks?
- Are most analysts leaning to one side of the boat?
- How quickly things change in just 90 days; and why forecasting stock levels is futile.
Stocks finished 2021 on a high.
What"s more, most analysts had modest expectations for more gains in 2022.
90 days later and the world has changed.
Never before (in my 25 years following markets) have I seen such a broad range of outcomes.
But as we wrapped 2021… I felt returns this year would be "single digit" at best.
I cited two primary concerns:
(a) exaggerated gains we had seen the previous three years (i.e., stretched multiples); and
(b) the massive monetary policy shift coming from the Fed.
At the start of the year – I took chips off the table – looking to buy on a 10-15% dip. I was fortunate enough to get it.
That move saw me post a positive gain for Q1 (about 1%) vs the S&P"s loss of 5%.
Now before I get into this missive – let me stress that the "business" of forecasting stock levels is a fool"s errand.
You have heard me say that every year for a decade.
Furthermore, trying to nominate a specific market level at any given time in the future is just plain silly.
Baseball-playing philosopher Yogi Berra said it best:
"It"s tough to make predictions, especially about the future"".
But the financial media and equity strategists love doing it.
To that end, I often like to say "all we have are probabilities".
That"s it.
Tell me one person who knows exactly what the future entails.
Just one.
What we can do is look at historical averages to help us with setting expectations – however it"s an open question as to how much real value it provides (a subject for another day).
For what it is worth, typically the market advances by double-figure percentages.
We know that much.
What"s more, we also know that the market rallies a higher percentage of the time than it declines.
However, it"s also true markets are often punctuated by 20% to 35% type falls during recessionary periods.
That"s part of the gig.
Two steps forward and one step backward.
But despite the downturns (as painful as they are) – over the past 50 years the average Compound Average Growth Return (CAGR) for the market has been 10.5% (inclusive of 2-3% dividends).
That implies roughly 7-8% capital growth.
But what may surprise you is years of single-figure percentage increase are unusual.
Generally we find outsized returns (like the previous three years) and years of precipitous double digit declines.
For example, recently I provided this table when reviewing Berkshire Hathaway"s annual returns vs the S&P 500 from 1957:
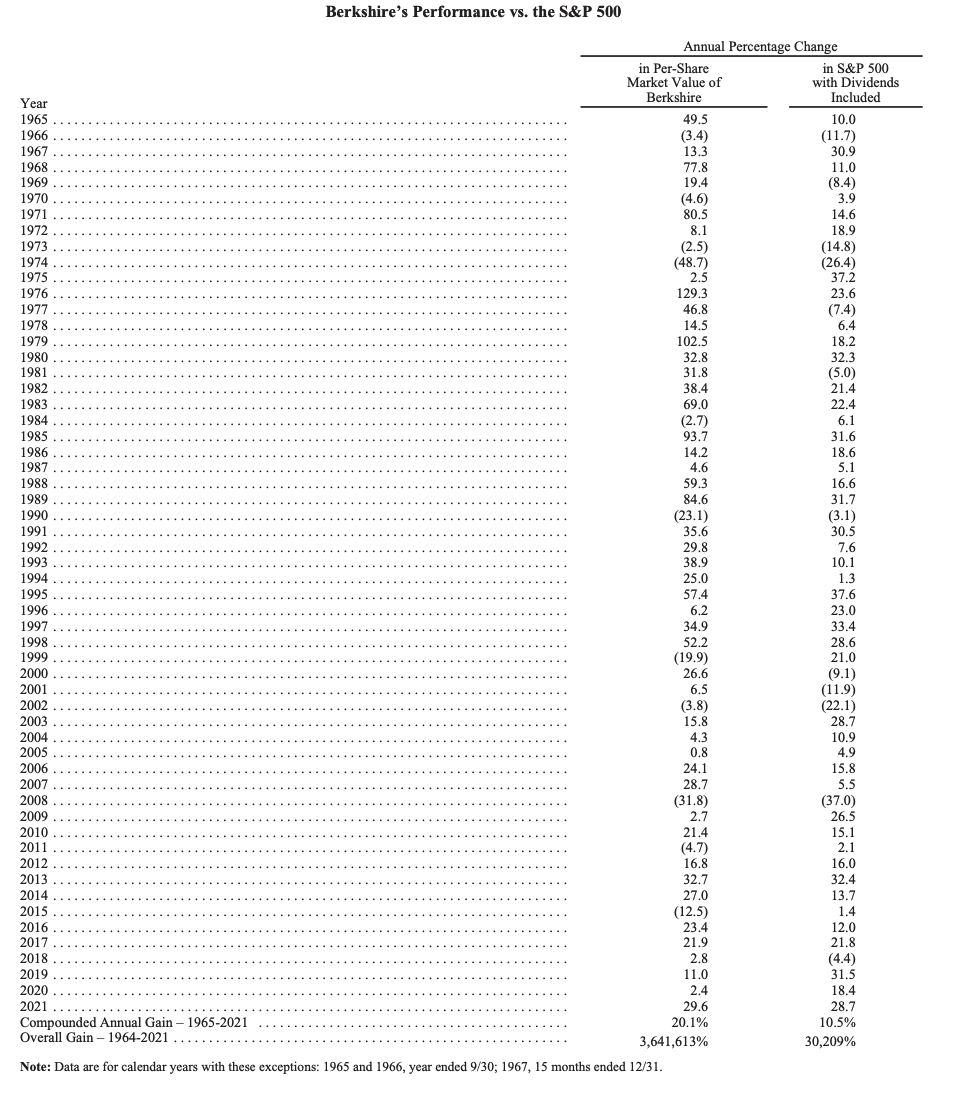
On the far right hand side, we have only seen 10 years (over 57) where there have been single digit positive returns.
That is just 17.5% of the time.
On the contrary, the market has returned greater than 15% (in any one year) 28 times of the 57 (or 49% of the time)!
You might say that forecasting outsized returns of greater than 15% is a far higher probability that forecasting single-digit returns.
Right!
As it happens, the average return over 50 years is ~10.5%.
With that context – and back to my preface about futile forecasts – below is what we saw from "leading" equity analysts as we started 2022 (courtesy of Bloomberg)
The average forecast across this group was 4909. The median forecast was 4950.
At 4950, that is a median upside call of just 3.1%
Low probability you might say.
At the time of writing, the S&P 500 trades 4520.
The median forecast of 4950 now implies a further 9.5% upside from here.
Yes, it"s possible but those odds are diminishing.
90 Days Changed Everything
Further to a Bloomberg piece from John Authers this week – he cited research from Absolute Strategy Research on how they see things unfolding through the balance of 2022.
It was a interesting read – especially given the plethora of possible outcomes (which have become nearly impossible to discount in combination)
They conduct a quarterly survey of larger fund managers that asks investors to put percentage probabilities on specific outcomes.
Since the last quarter, the fear of a global recession has risen sharply, accompanied by falling hopes for higher earnings (echoing what I was saying as we closed Q4)
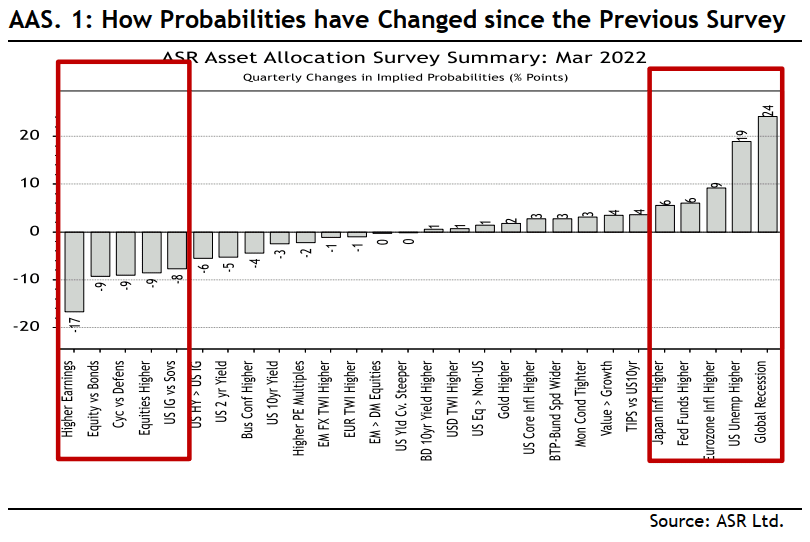
On the far right-hand side – recession fears top the survey (+24) – with lower earnings revisions on the other end (-17)
Interestingly, we also see returns from equities vs bonds now in the mix.
From mine, I think this will become a major factor once real returns turn positive.
Let"s see where these are in 12 months from now.
But the big question (for me) is how much of this has been priced in?
My view: not nearly enough.
Authers argues that it"s "not clear that reduced earnings expectations have found their way into market pricings yet".
I agree – they haven"t.
And I say that because we"re yet to see any material downgrades from the market.
We will get a better window into this over the coming weeks (and months) as Corporate America reports on Q1/
For me, I am looking towards the "profitability story".
Are they going maintain their profit margins?
Authers goes on to provide additional research from the quantitative team at Societe Generale SA – which shows that earnings positivity is declining.
To my point, there are still barely any downgrades than upgrades:
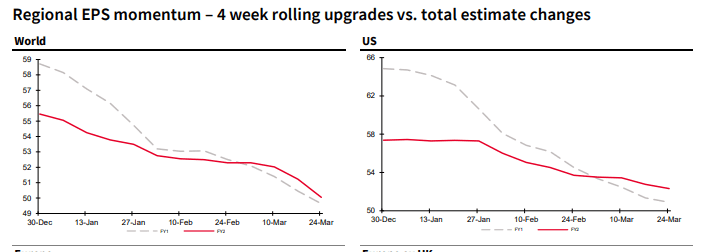
From mine, look for this to deteriorate opposite the impact of roaring inflation, supply chain snarls and the propensity for the consumer to save.
The signs are already starting to show (as I discussed yesterday).
Analysts Revisit 2022 Targets
Q1 2022 has thrown a spanner in the works for most analysts.
The war in Europe, inflation, lower economic growth and Fed monetary policy has most analysts at a loss.
How can anyone string these together and get it right (but more on this in my conclusion)
Some have cut their forecasts sharply – others have increased them!
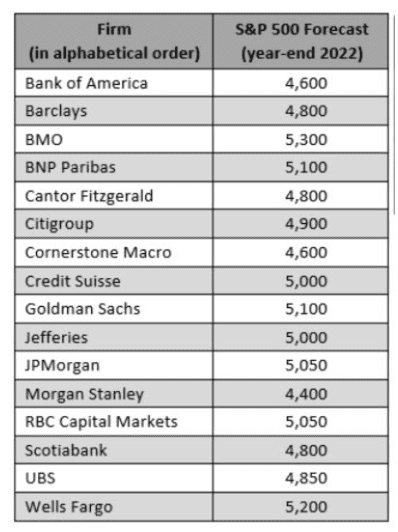
Below is a Bloomberg summary of what's changed:
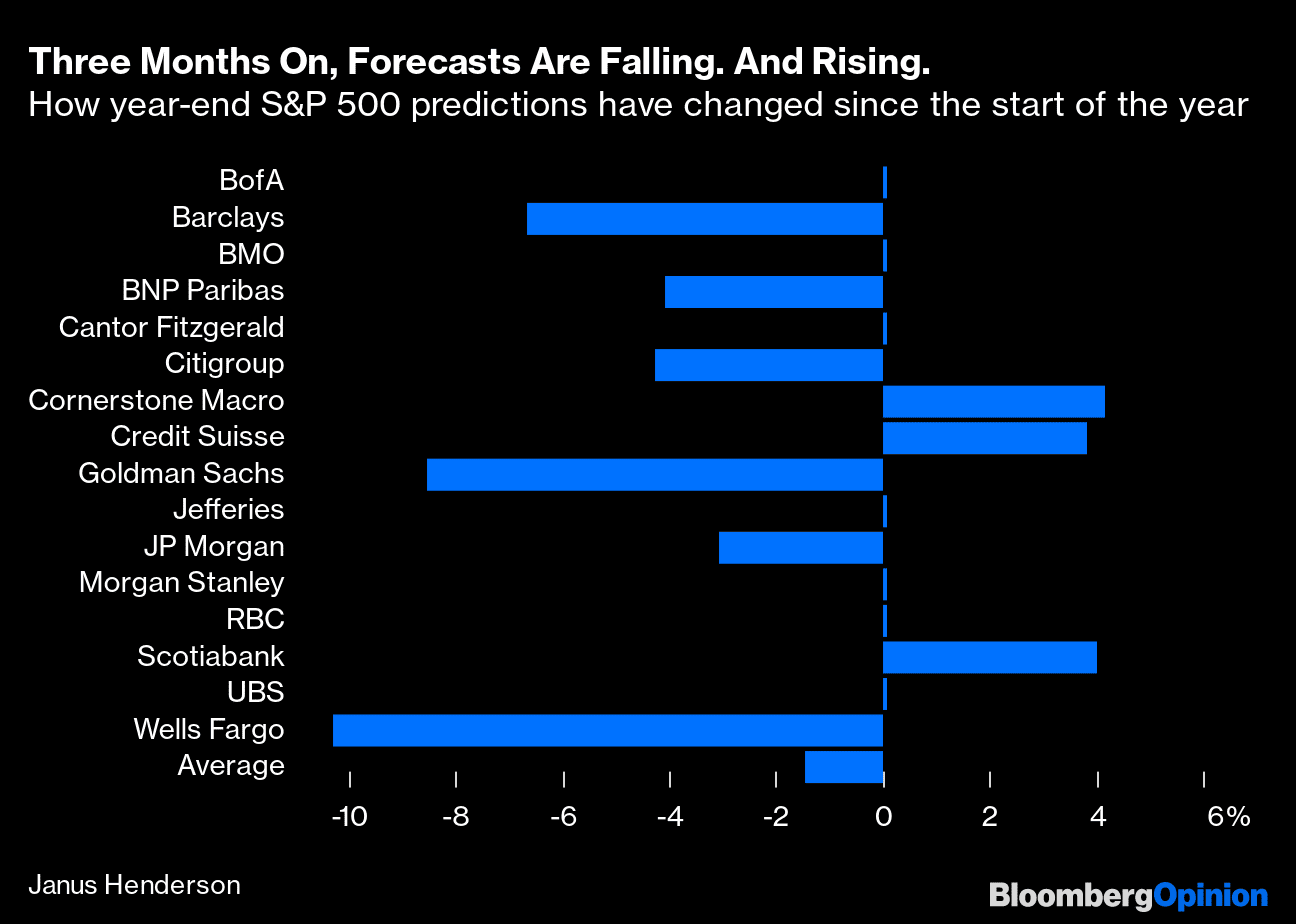
Those feeling more positive than Q4 2021 include Cornerstone Macro, Credit Suisse and Scotiabank.
Cornerstone has gone from a year end forecast of 4600 to 4800.
Credit Suisse from 5000 to 5200; and Scotiabank from 4800 to 5000
Note that none are what you would consider "uber" bulls.
But almost 50% of the group have revised their forecasts lower.
For example, Wells Fargo have slashed their forecast by over 10%… from 5200 (one of the more bullish in Q4 2021) to just 4600
Goldman Sachs slashing their forecast by over 8% – who were at 5100 heading into 2022.
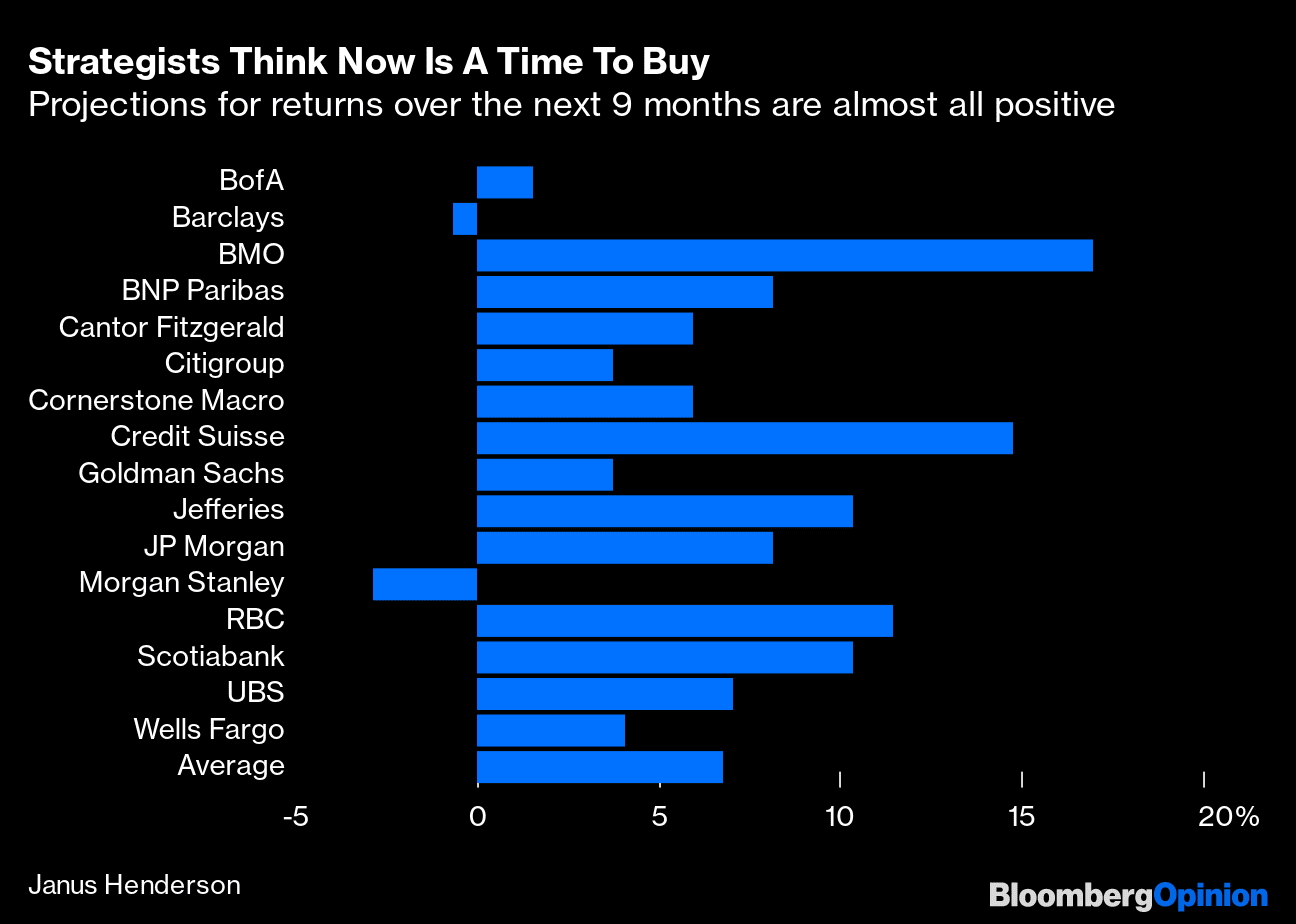
But perhaps what is surprising is every analyst surveyed believes now (4500) is a time to buy… where average expected returns between now and Dec 1 are ~6%
I question that for one reason:
Does 6% upside comfortably outweigh x% downside risks?
I don"t think they can answer that… unless you can dimension each of the risks in relation to each other.
Only Barclays and Morgan Stanley feel the market will close the year lower than 4500 on the S&P 500
As an aside, I don"t know if every analyst is saying "buy the market here" is a good or bad signal?
Something tells me to lean to the other side of the boat when I hear 'every' analyst say buy (or if I see the VIX trading near 12!)
What Does History Say after a Negative Q1?
After we finished January in the red – I issued a post saying "so goes January… so goes the year"
That"s because history tells me that a negative January typically suggests a negative year ahead.
We will see how that goes…
Repeating a portion on that post:
"According to Stock Trader"s Almanac, going back to 1950, that metric of January"s performance predicting the year has worked 87 percent of the time with only nine major errors.
In the years January was positive, going back to 1945, the market ended higher 83 percent of the time, according to CFRA.
My prediction for single-digit gains this year is now "against the odds"… so we will see how things go (maybe my forecast will make for the 10th anomaly since 1950)"
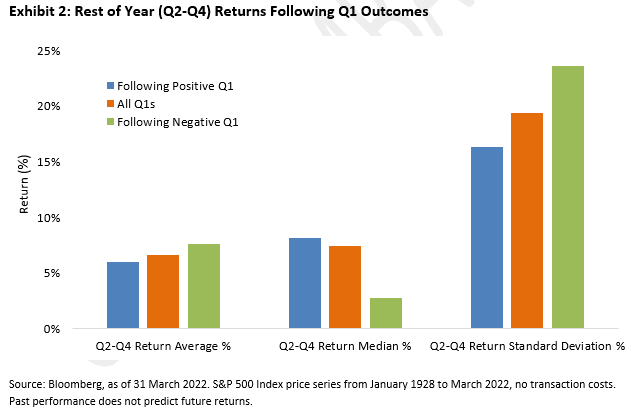
Authers provided more research on what happens after a negative Q1…
He states the median return for those nine months is very weak after a negative first quarter.
In addition, the data shows that the overall average is driven by a few outlying big recoveries.
Exactly!
I demonstrated exactly this point when reviewing Berkshire"s 57 years vs the S&P 500. It was those 'outsized years' which made all the difference:
My take:
It"s little wonder the bulk of analysts have pared their expectations for the balance of the year.
History suggests this is prudent.
But I raise an eyebrow when every analyst is saying "buy here"…
I think we get a much better entry point…. and revisit the February lows.
Where Things Stand after Today
Below is where the S&P 500 stands at April 1st – closing at 4545
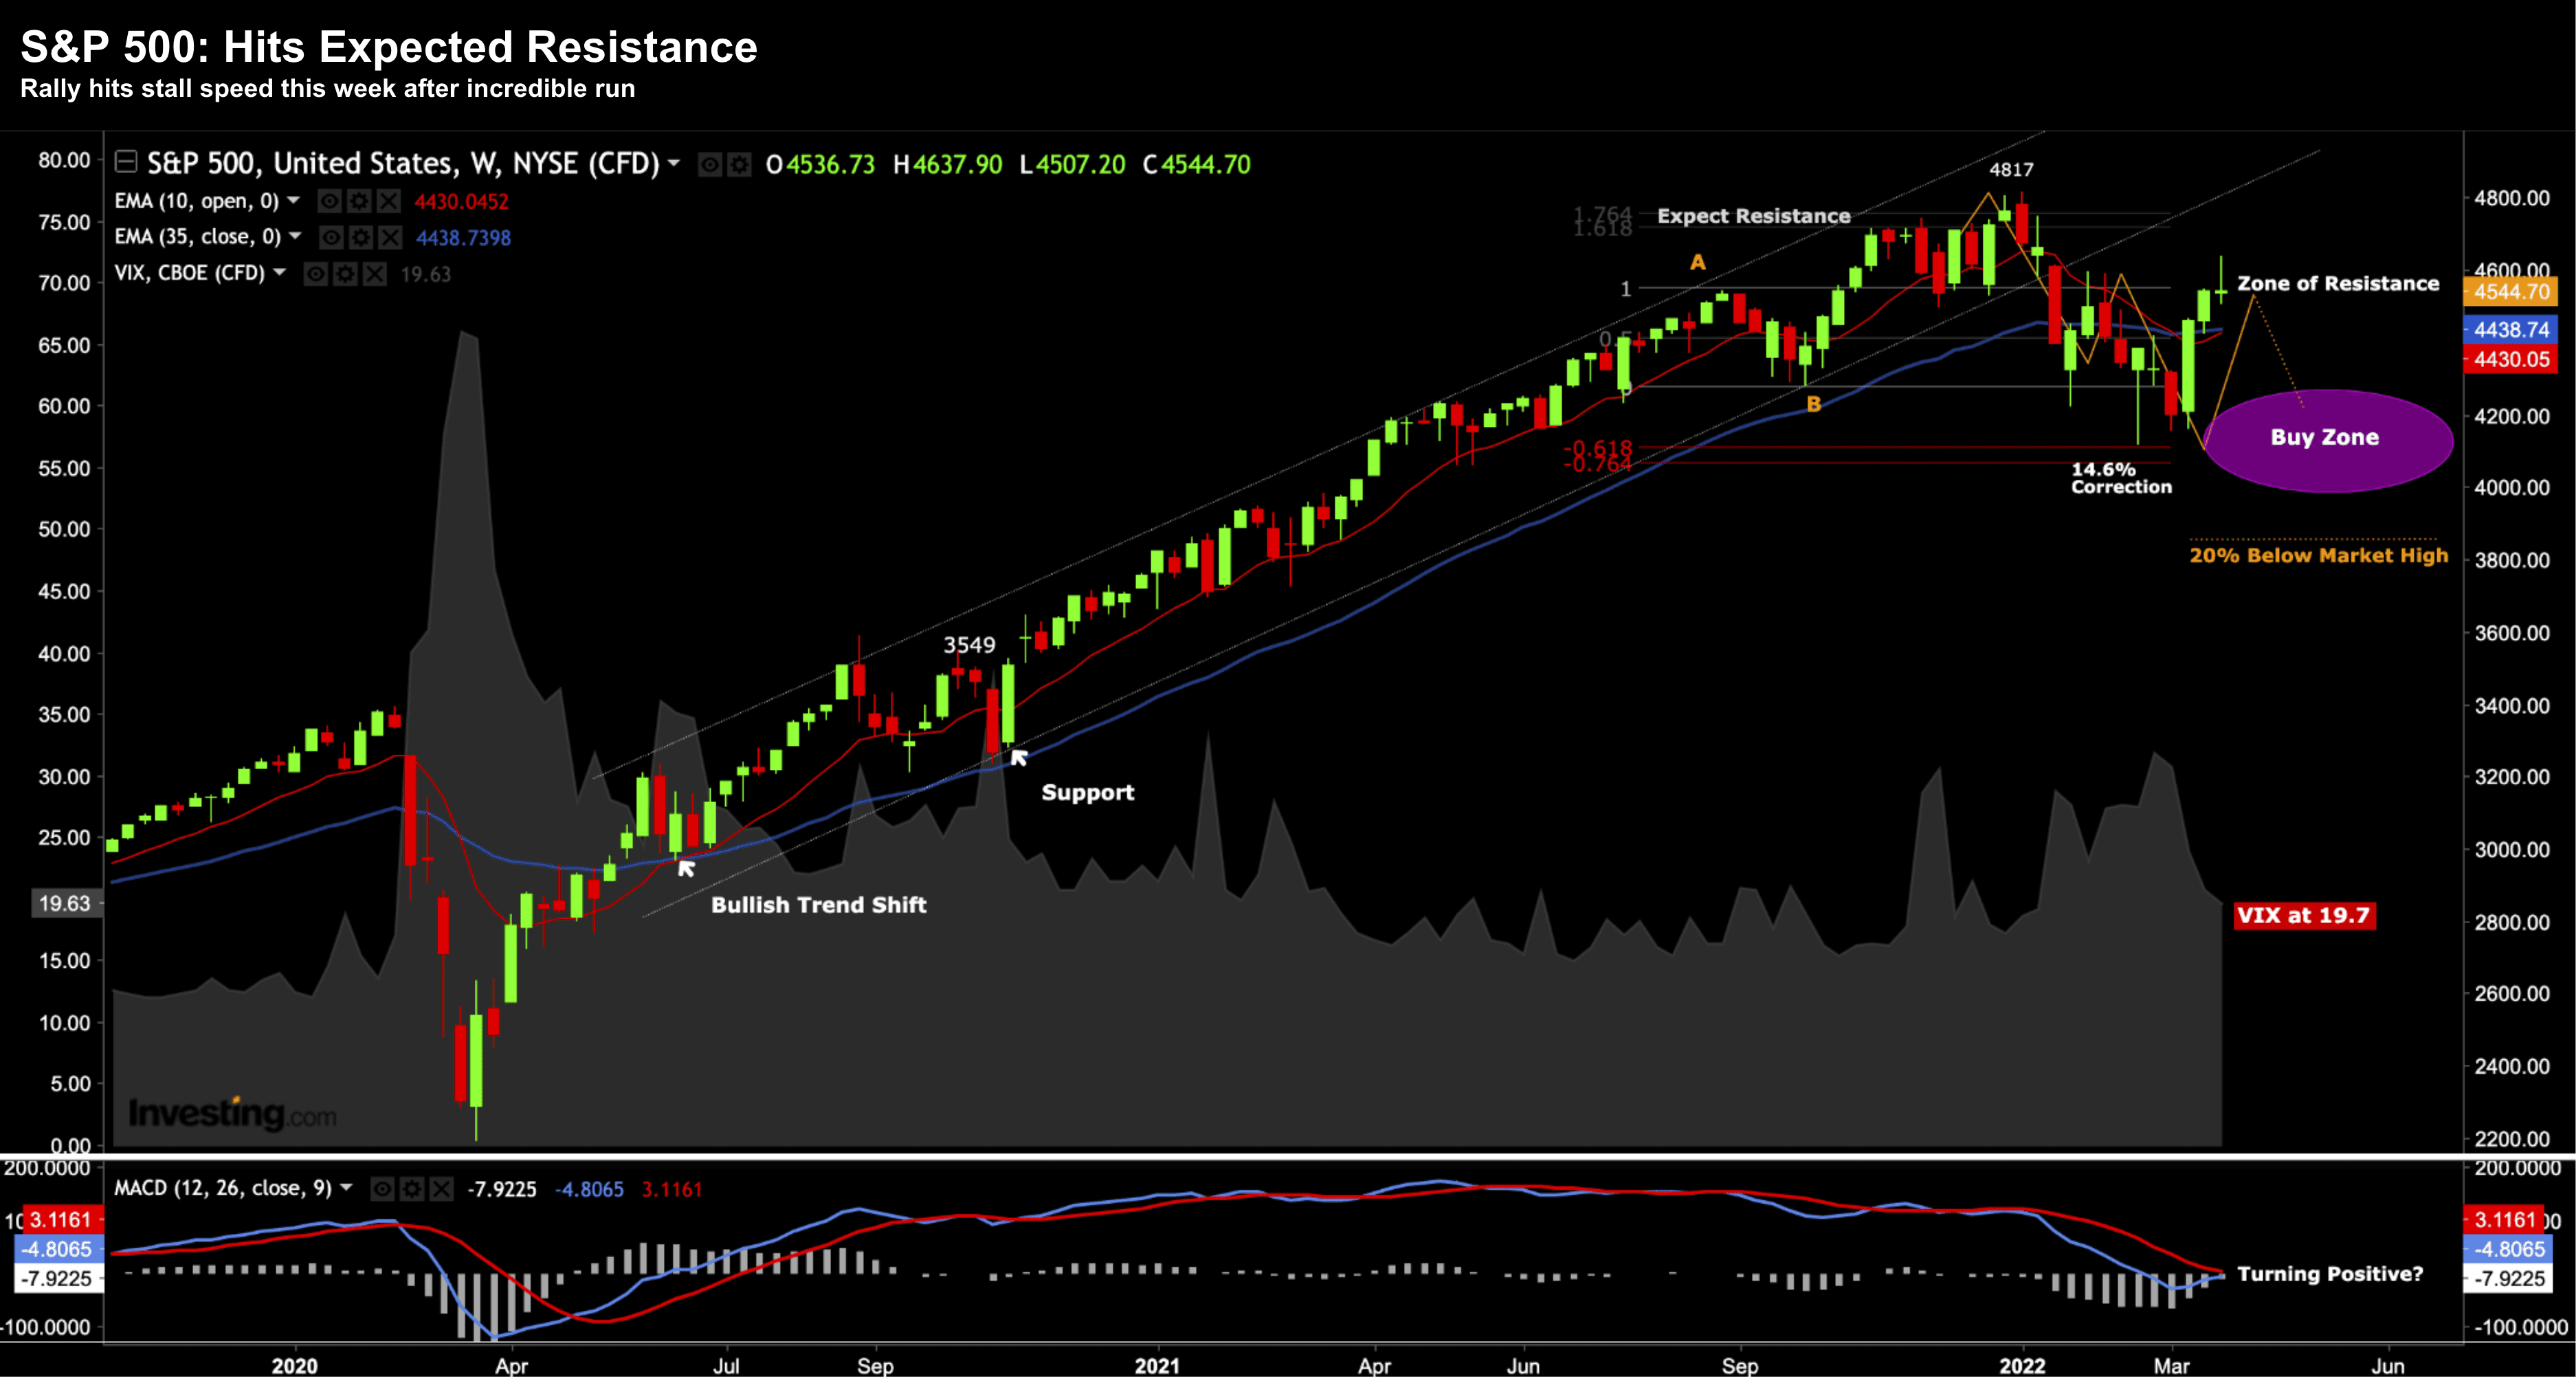
April 1st 2022
If the market is to finish the year "flat" – it needs to climb to levels of 4800
That"s a gain of 5.6% from here.
And if we were to rally to 5,000 by year"s end – that"s a gain of 10% (very much against historical probabilities)
Here"s how I see it:
If the market is able to finish the market flat (i.e., 4800) – in the face of a possible 200 basis points – and as much as $1 Trillion less on its balance sheet (e.g. bond sales anywhere from $100B to $200B per month) – that would be an incredible result.
Not to mention growth headwinds such as:
- 5-6% plus inflation for the balance of the year;
- wage growth which is not matching inflation;
- uncertainty around the war in Europe and its impact on commodities; and
- ongoing supply chain snarls (which many companies say are not easing)…
As I say, a flat YoY S&P 500 return would be a stellar result (and I think one the Fed would take).
Putting it All Together
The business of forecasting future stock levels is mostly futile.
No-one really knows where we will stand at the end of 2022 (or any given year).
Personally, I"ve never seen a wider range of outcomes in my time investing (~25 years).
But of the outcomes I do see – they tend to point to the downside.
In other words, the catalysts for (outsized) upside seem few and far between.
Yes, we could rally perhaps another 5-10% from here.
Sure.
And things could turn (e.g. resolution with the war in Europe; inflation falling sharply; and a less hawkish Fed)
Now on the bullish side, there is ample liquidity; credit spreads remain low (i.e., low chance of debt default risk); real rates remain negative; and balance sheets of both corporates and consumers are robust.
What"s more, employment looks strong (as we learned today).
On the downside, we have a mountain of debt against a multi-year tightening cycle.
The Fed have already made a policy mistake by acting far too late with inflation… which they have now admitted.
But perhaps what concerns me most… is how stocks react opposite reduced M2 money supply.
Regular readers will be familiar with this favourite chart of mine showing what we see comparing M2 with the S&P 500:
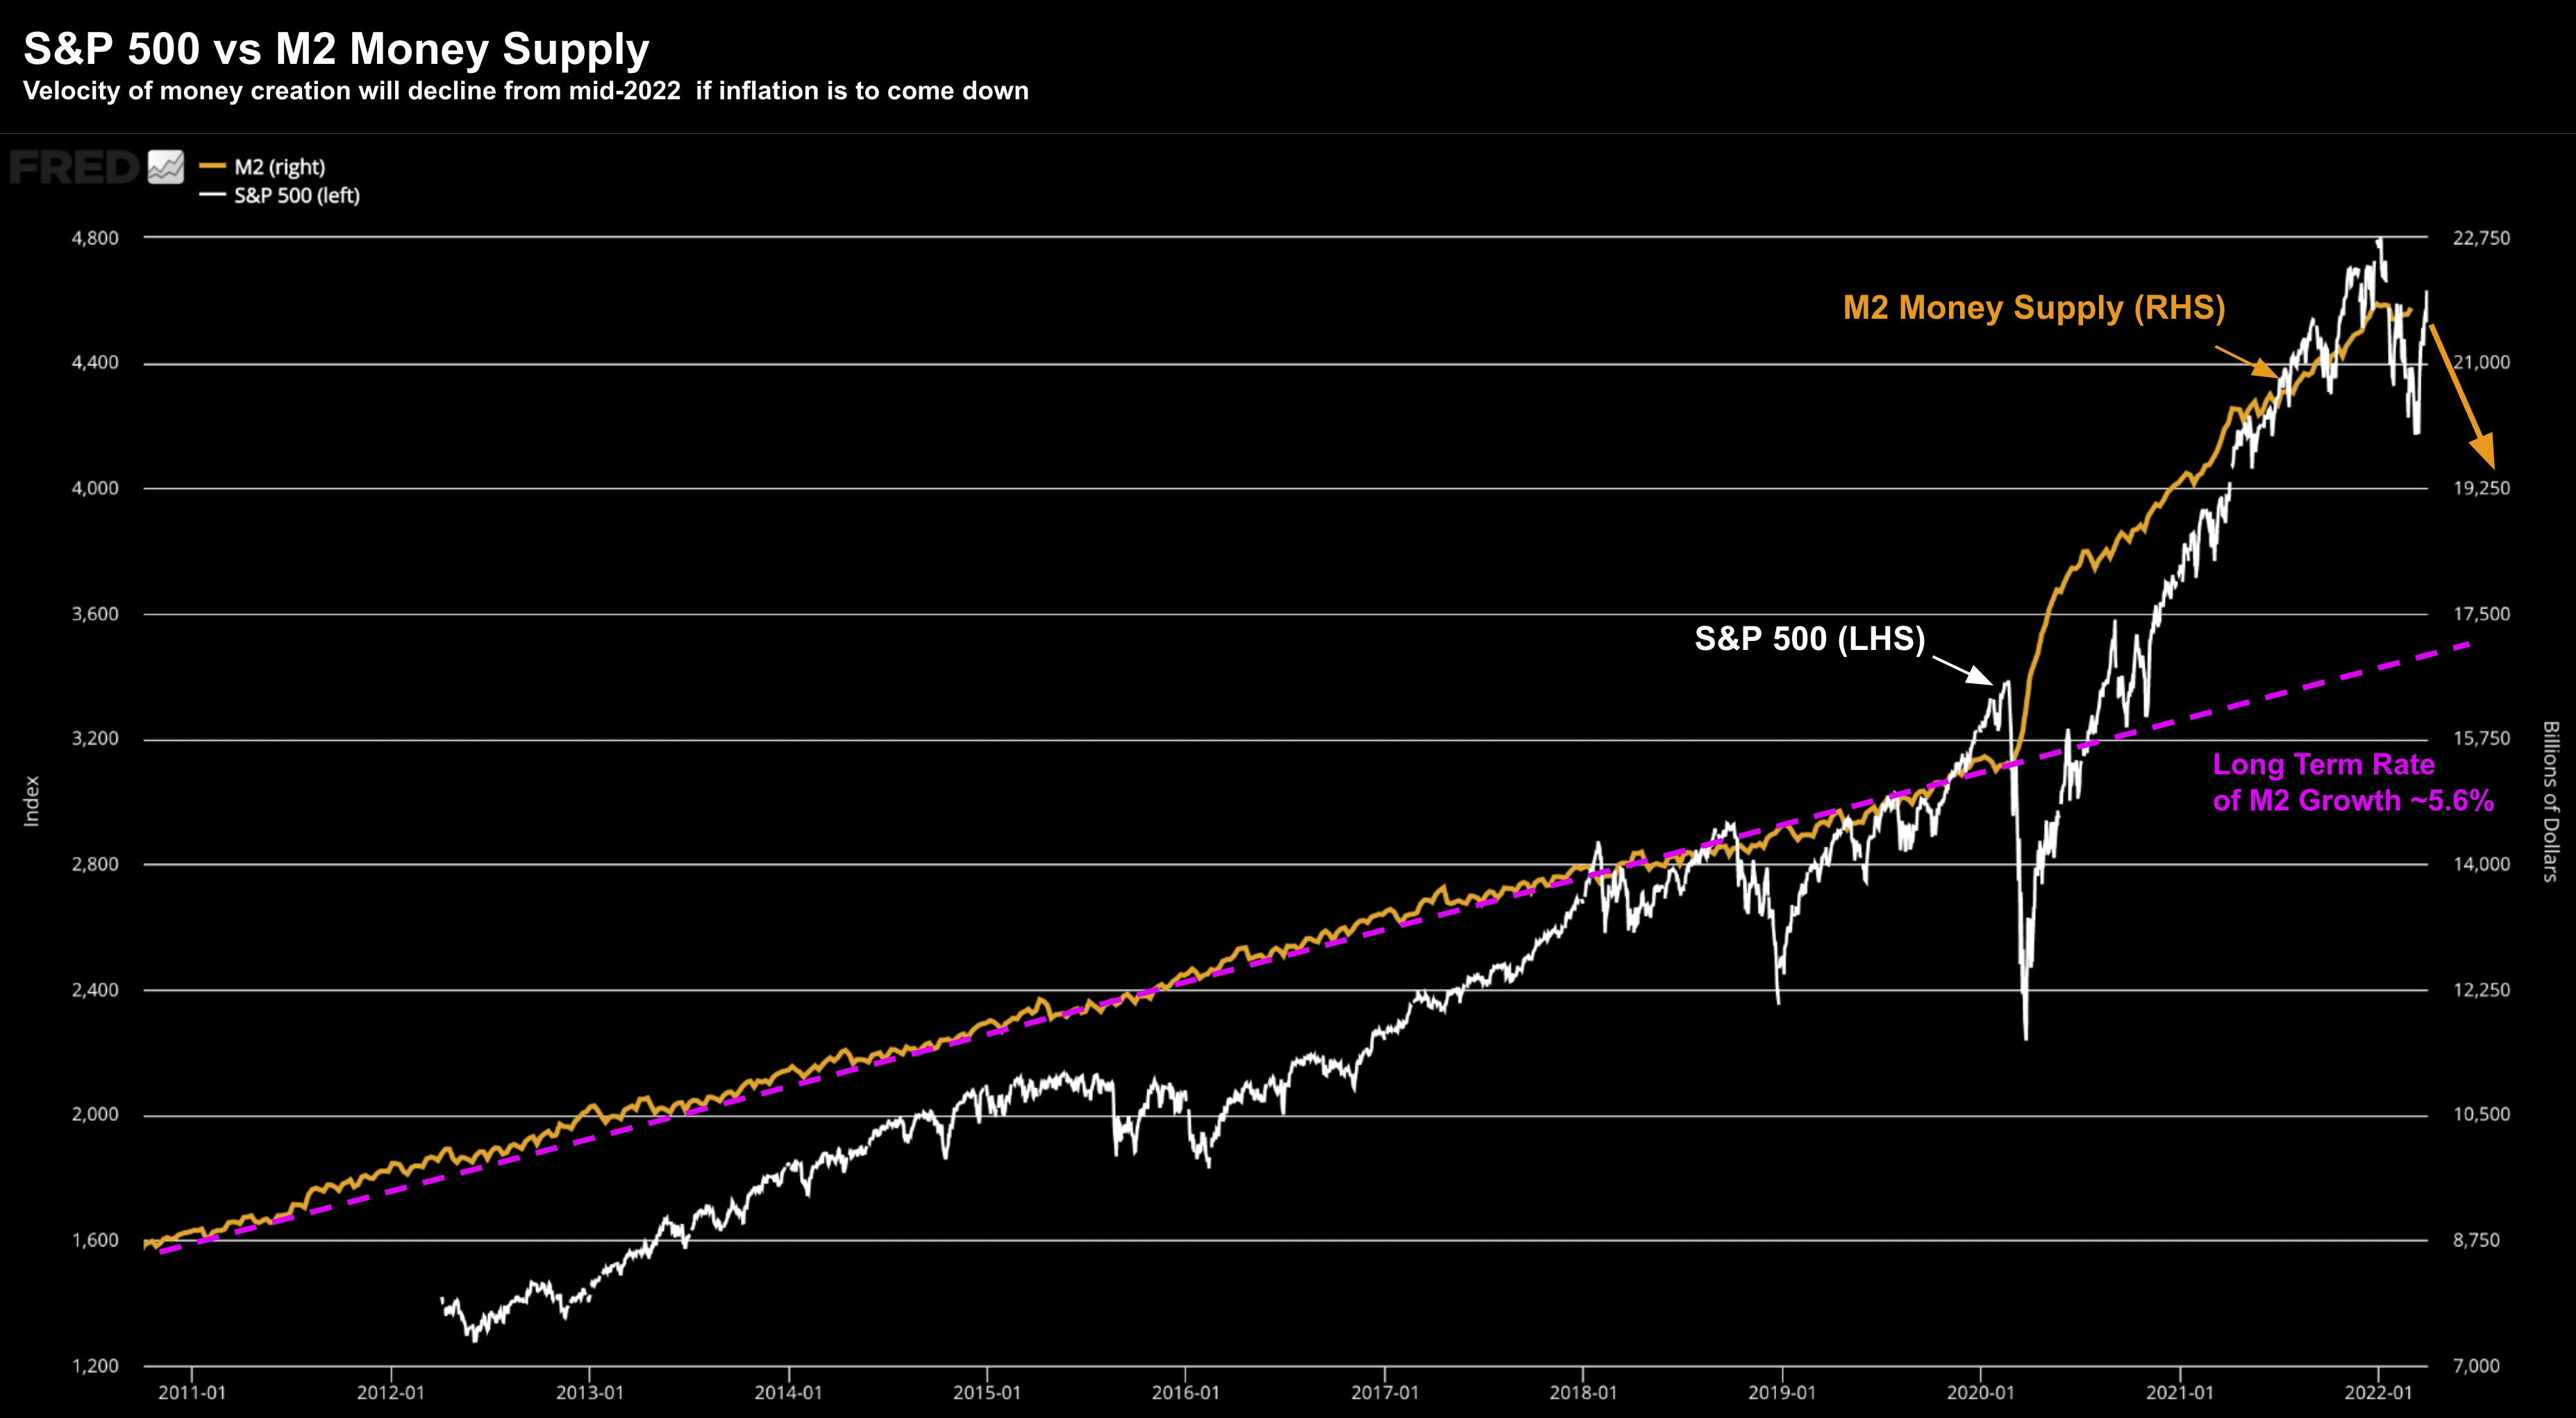
April 1st 2022
The long-term M2 rate of growth around 5.6%
Over the next 12 months, the Fed will pull this back closer to the long-term average rate of growth if they are to tackle inflation.
Remember, the Fed must do two things:
(a) improve the demand for money (i.e., positive real interest rates); and
(b) reduces its supply.
That"s the only way we bring down inflation. There"s no other way.
The question to ask is how do you think stocks will react as the Fed withdraws liquidity?
My guess is the risk is more to the downside.