Earnings Divergence: Decoding S&P 500 Valuations and the Mag 7’s Growth Deceleration
Words: 1,092 Time: 6 Minutes
- Q1 2025 earnings show resilience, yet remain significantly below the high-water marks of 2024.
- Valuation Risk: Why a downward revision in earnings guidance could trigger a sharp market correction.
- The Narrowing Gap: Analyzing the growth trajectory of the Magnificent Seven versus the broader S&P 500.
In the long run, earnings growth is the primary engine of equity prices. However, in the short term, markets often experience significant divergences driven by psychological volatility—fear, greed, and cognitive bias.
For the disciplined investor, these divergences between price and intrinsic value create the most compelling opportunities. As we pass the midpoint of the Q1 2025 reporting season, a clear trend is beginning to emerge.
Equity markets are inherently forward-looking mechanisms, typically discounting events six to nine months in advance. This is why share prices react more violently to forward guidance than to current-quarter "beats" or "misses." If the consensus shifts toward a contraction in future earnings, the re-pricing of risk is usually swift and severe.
The Structural Drivers of Earnings Growth
To understand the current earnings trajectory, we look to the comprehensive data provided by FactSet. Under the analysis of John Butters, the data provides a granular view of sector-level performance and emerging trends.
This summary incorporates insights from their latest mid-season update. A critical focal point remains the earnings contribution of the "Magnificent Seven" (Mag 7) relative to the rest of the index (the S&P 493):
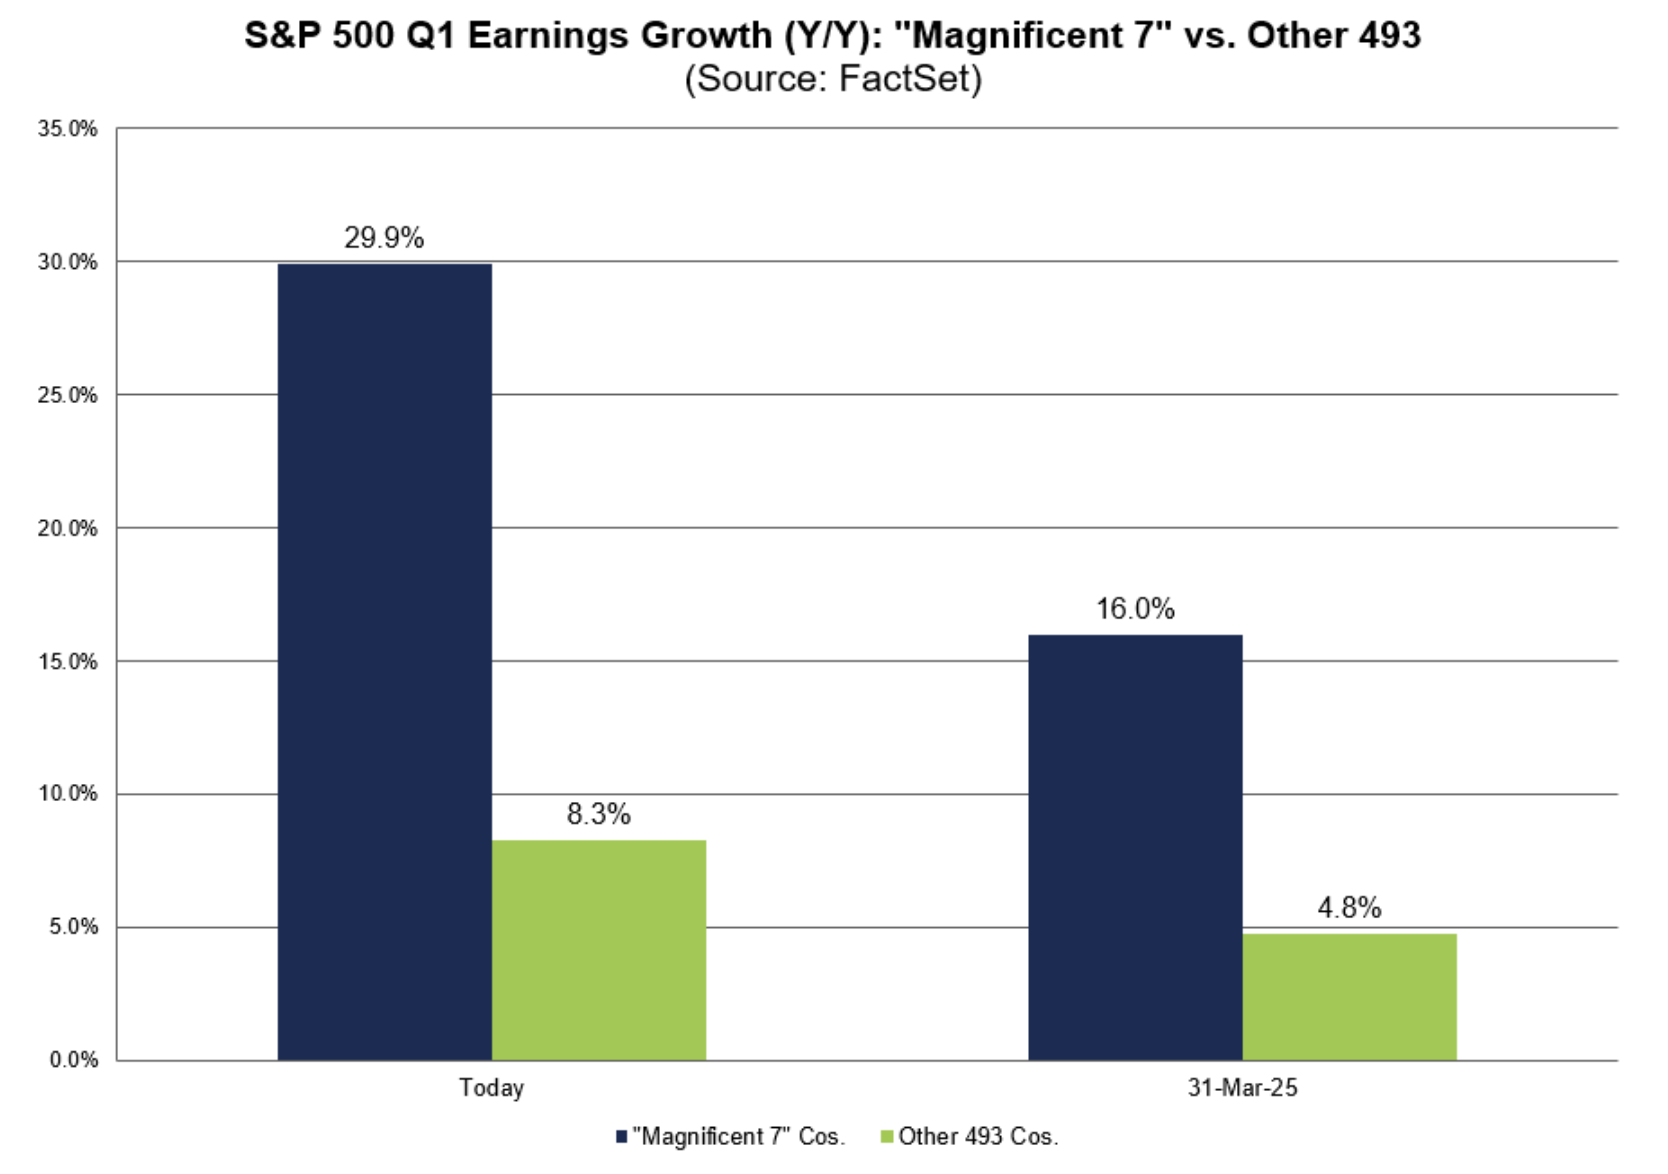
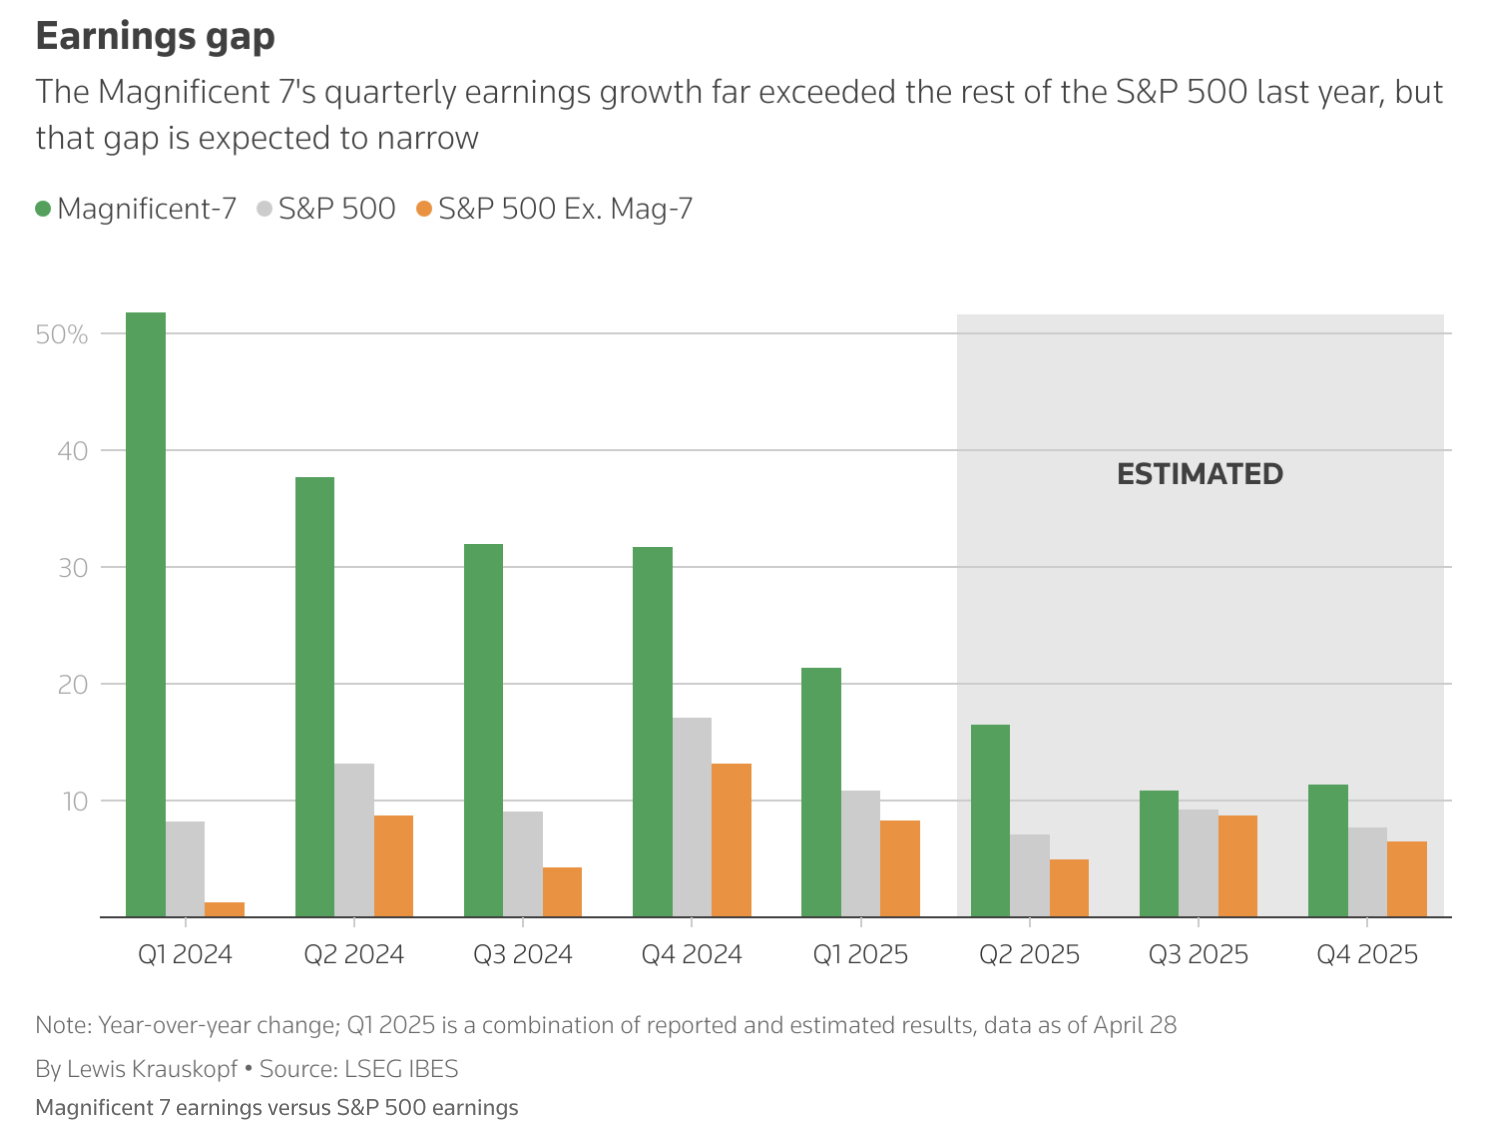
By way of context, in Q1 2024, the Mag 7 cohort grew earnings by a staggering 52% year-over-year, while the remainder of the S&P 500 managed a negligible 1.3%. This imbalance pushed the Mag 7 to comprise roughly 35% of the total index weight—a historic level of concentration.
Fast forward to Q1 2025, and the growth gap is narrowing. The group"s earnings are up 29.9% compared to 8.3% for the rest of the index. While 29.9% remains a robust figure, it represents a significant deceleration from the 52% clip seen a year ago.
This "earnings convergence" suggests that the broader market is finally beginning to participate, even as the leaders face tougher year-over-year comparisons.
At the sector level, the performance is highly fragmented:
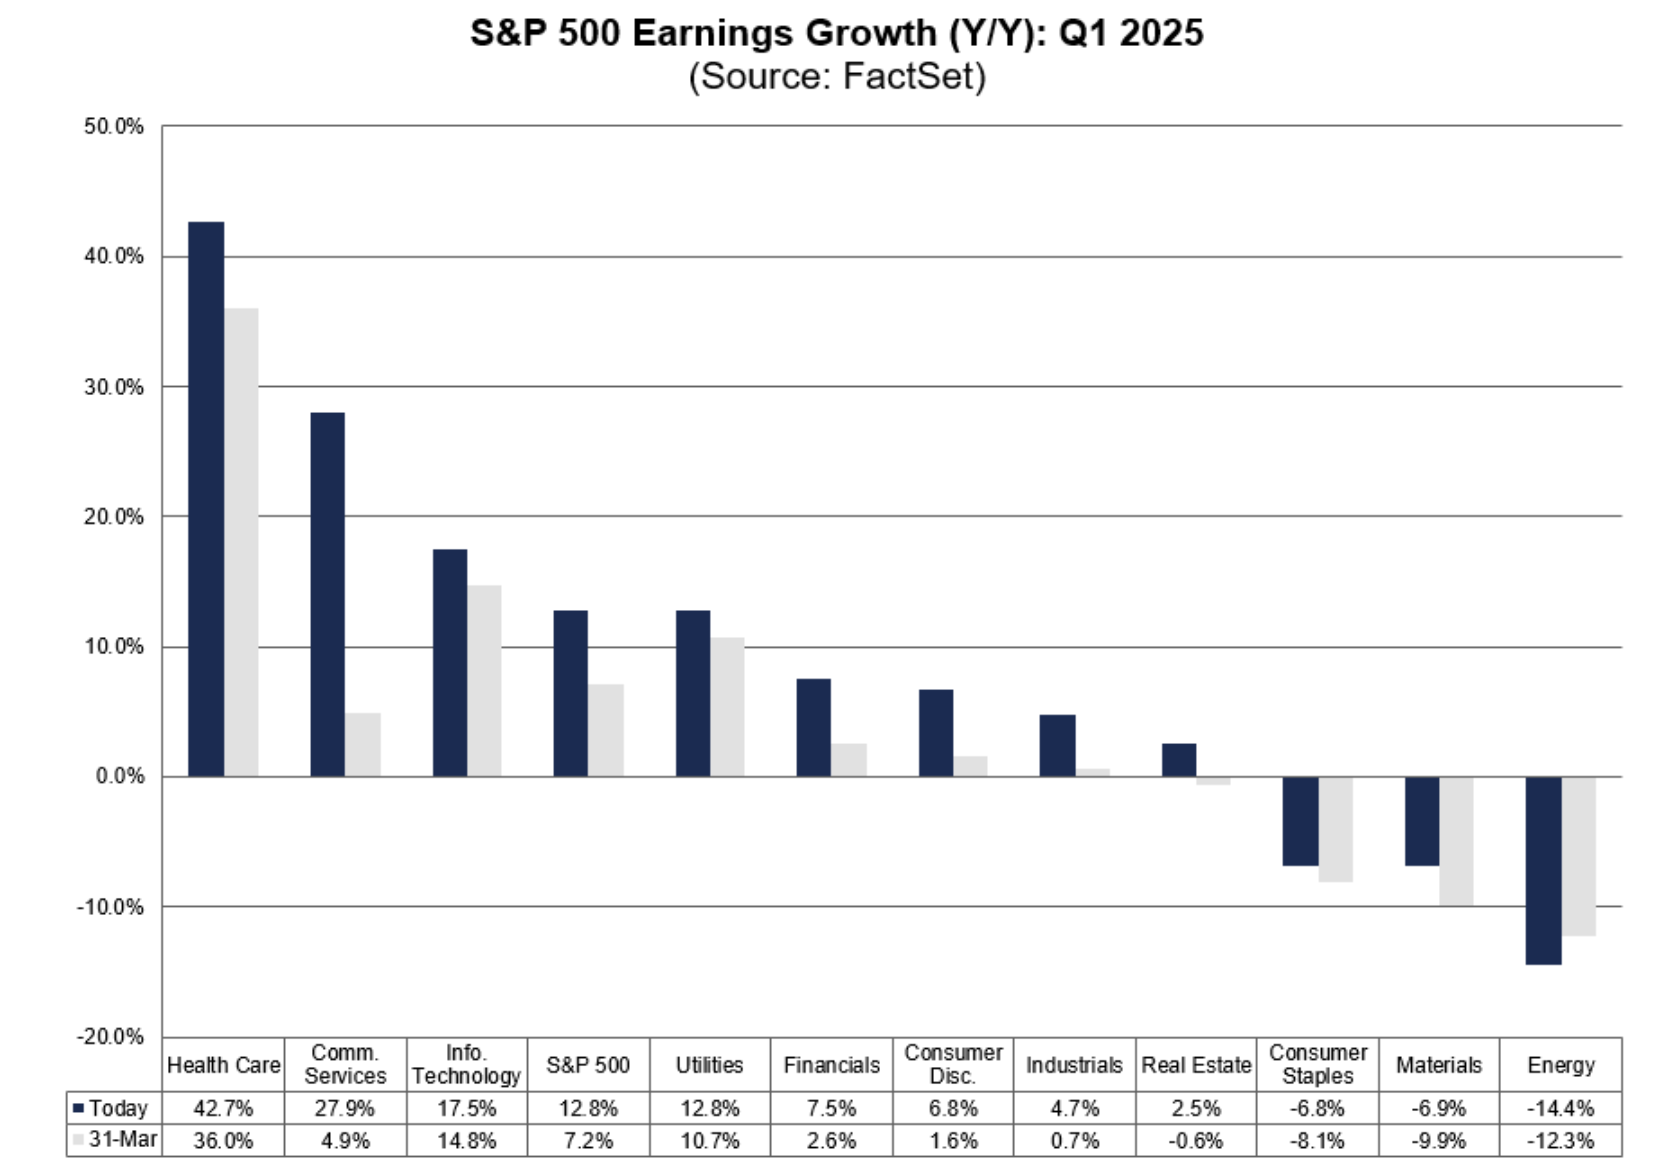
Health Care (42.7%) is the standout performer, followed by Communication Services (27.9%), driven largely by Alphabet and Meta. Information Technology (17.5%)—which includes Apple and Microsoft—ranks third.
Conversely, Energy (-14.4%) and Materials (-9.9%) are the laggards. However, these sectors may offer the most compelling contrarian value, as current prices likely reflect peak pessimism regarding global demand and recessionary fears.
The blended growth rate for the S&P 500 currently sits at 12.8%, but as reporting continues, this is expected to trend toward the high single digits.
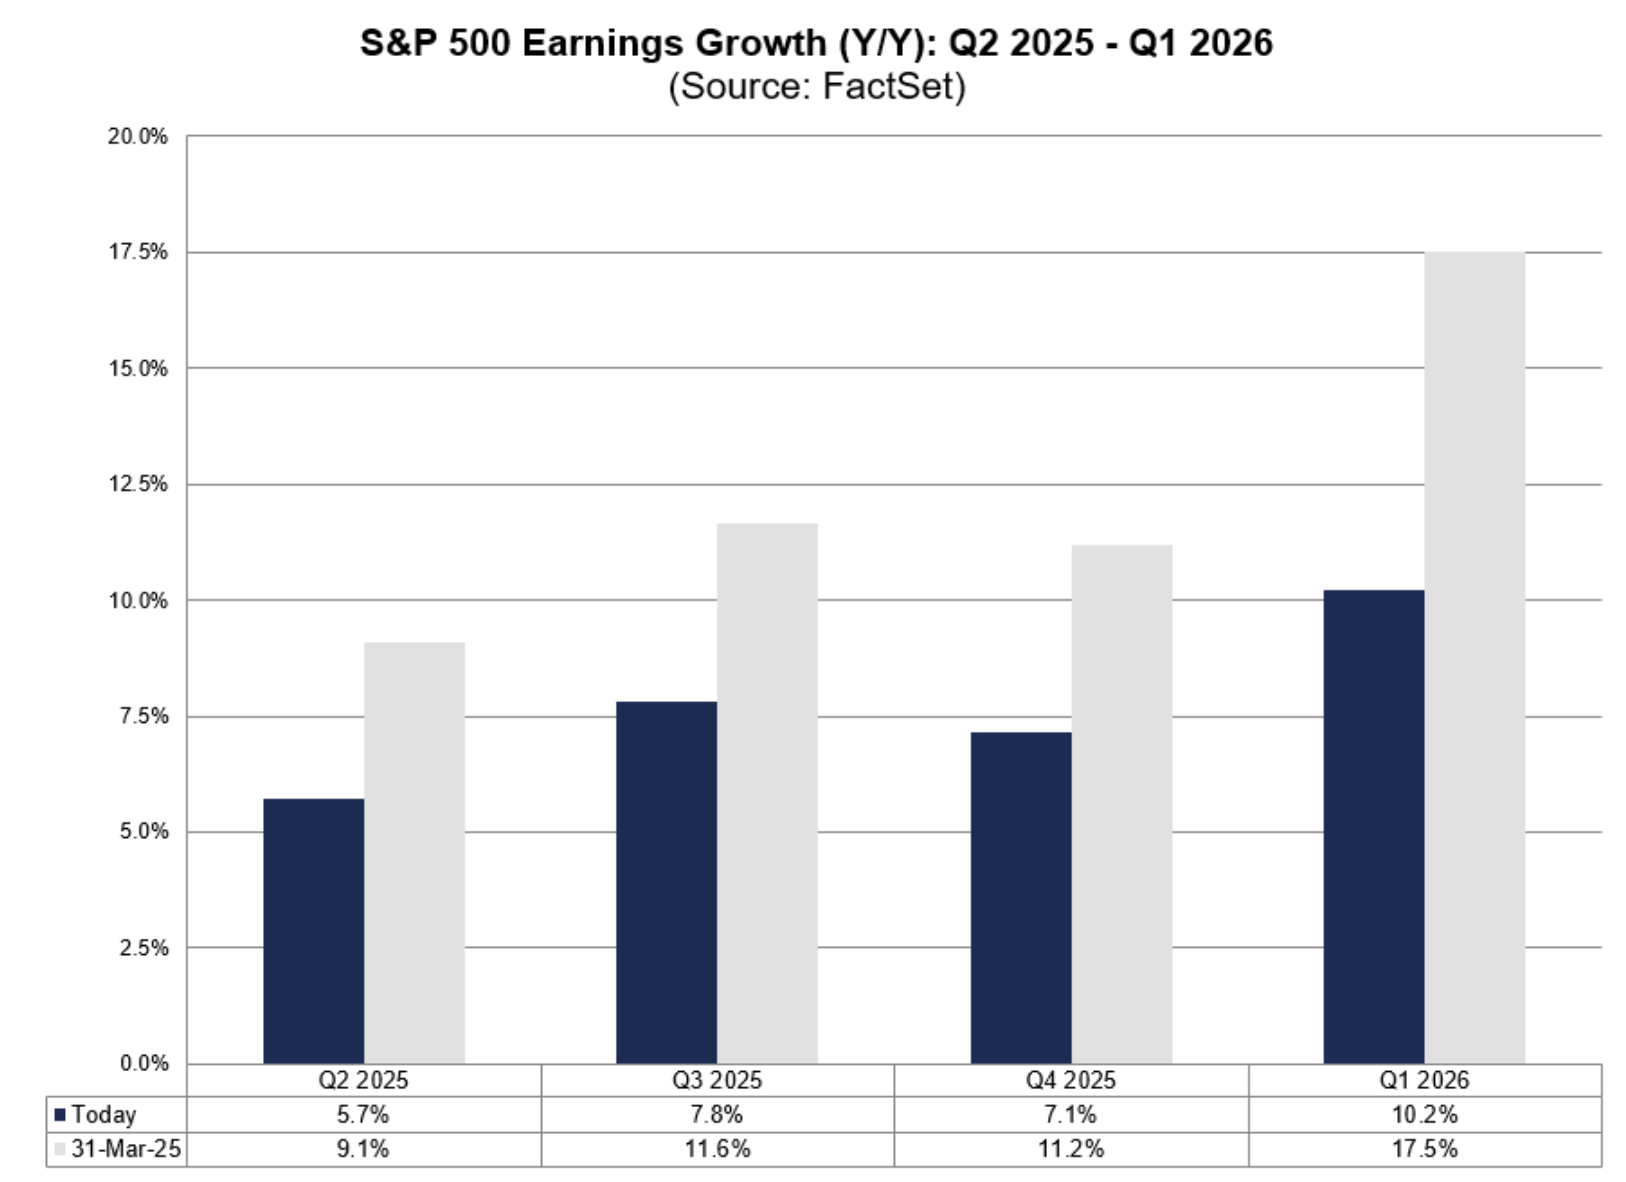
An end-of-year growth rate between 7% and 8% would be consistent with the long-term historical mean. In 2015, the S&P 500 generated roughly $120 in EPS and traded at a multiple of 18x.
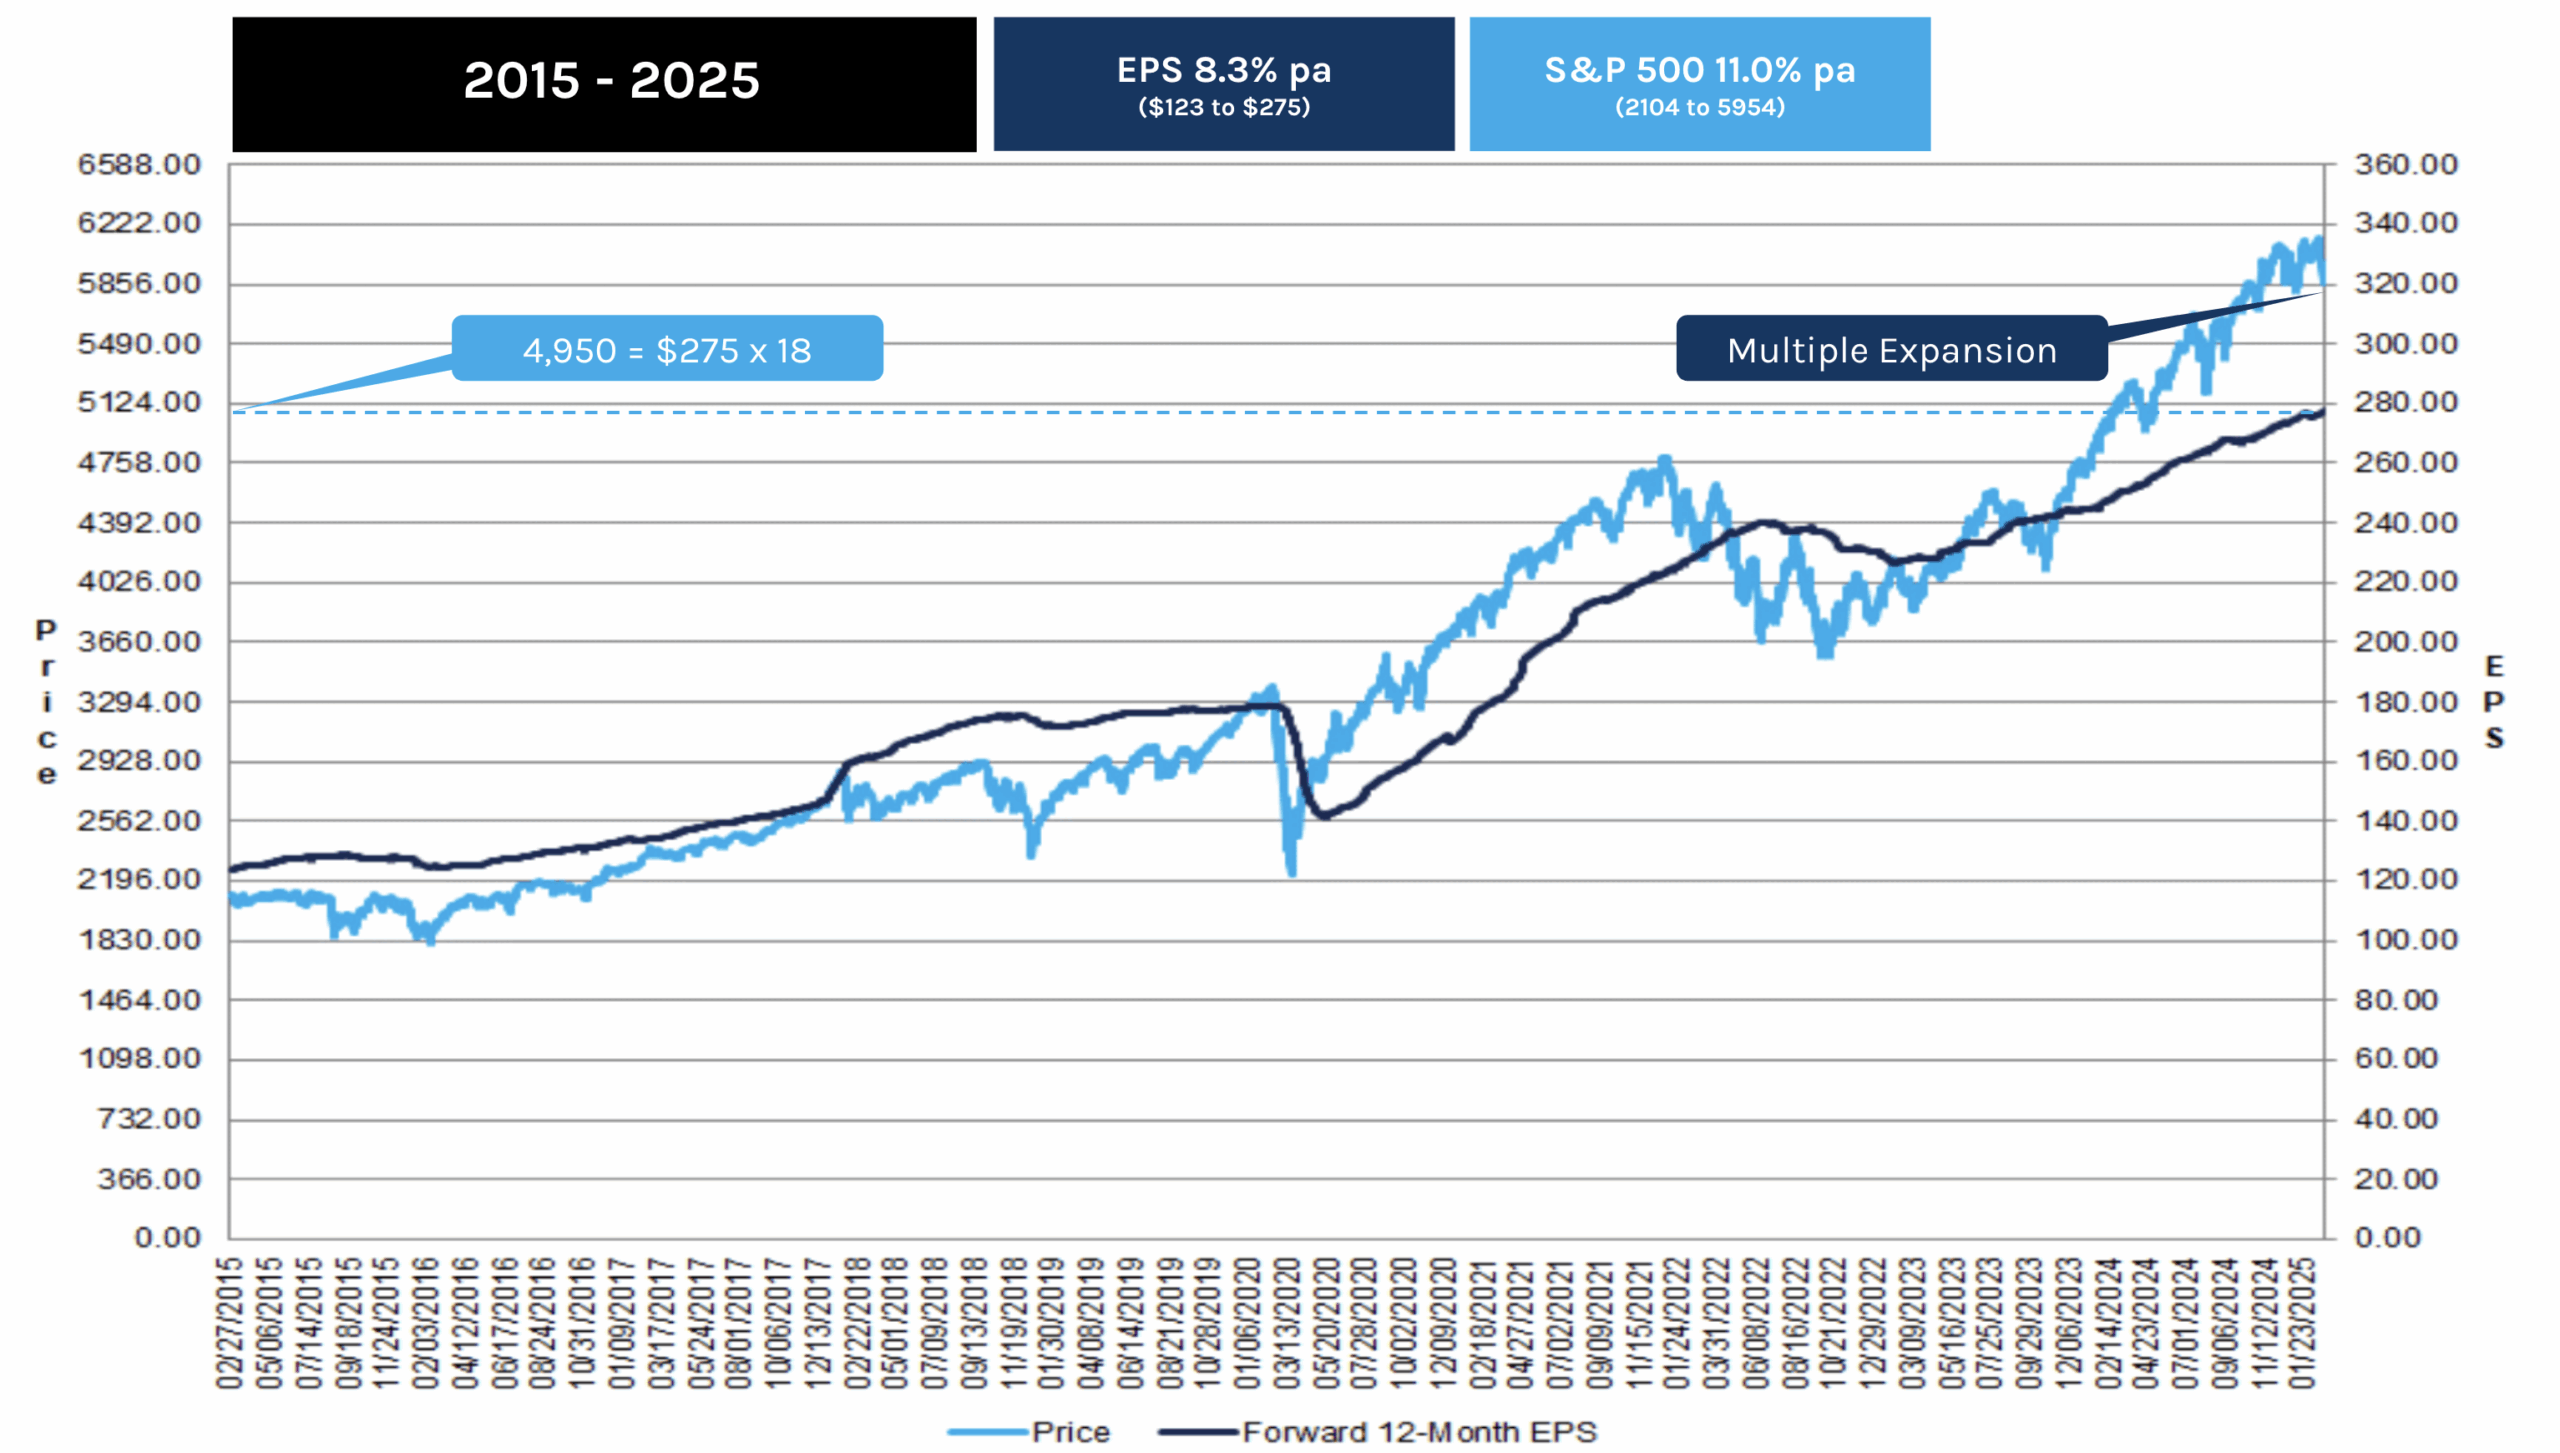
Today, with consensus expectations for $260 to $270 per share this year, the 10-year Compound Annual Growth Rate (CAGR) remains healthy at approximately 8.2%.
The primary concern, however, is the valuation multiple. At a price of 5600 and estimated earnings of $260, the market is trading at 21.5x forward earnings. This is nearly four "turns" higher than the 10-year average of 18x. This valuation expansion represents a significant risk premium for investors entering the market at these levels.
Strategic Conclusion: Navigating High Multiples
Investors adding exposure here under the assumption that trade risks or inflationary pressures have subsided should exercise extreme caution. Sustainable V-shaped recoveries are rarely organic; they almost always require a massive monetary stimulus from the Federal Reserve.
Currently, that "Fed Put" is absent. The central bank has adopted a reactive posture, waiting for more definitive data on the impact of trade policy. Without a proactive monetary tailwind, the sustainability of recent technical bounces is questionable.
From a technical perspective, we anticipated a rally toward the 5700 zone (the 35-week EMA), but this area now represents formidable resistance. There are two primary reasons for this outlook:
- Fundamental Friction: At 5700, the market is historically expensive. Paying 22x forward earnings in a decelerating growth environment lacks a sufficient margin of safety.
- Technical Resistance: In a "risk-off" regime, the 35-week EMA typically acts as a ceiling where short-term traders take profits and institutional exposure is reduced.
For patient, quality-oriented investors, the optimal entry point remains closer to a 18x multiple or below. While most of the Magnificent Seven are trading below their five-year average multiples, few could be described as "cheap."
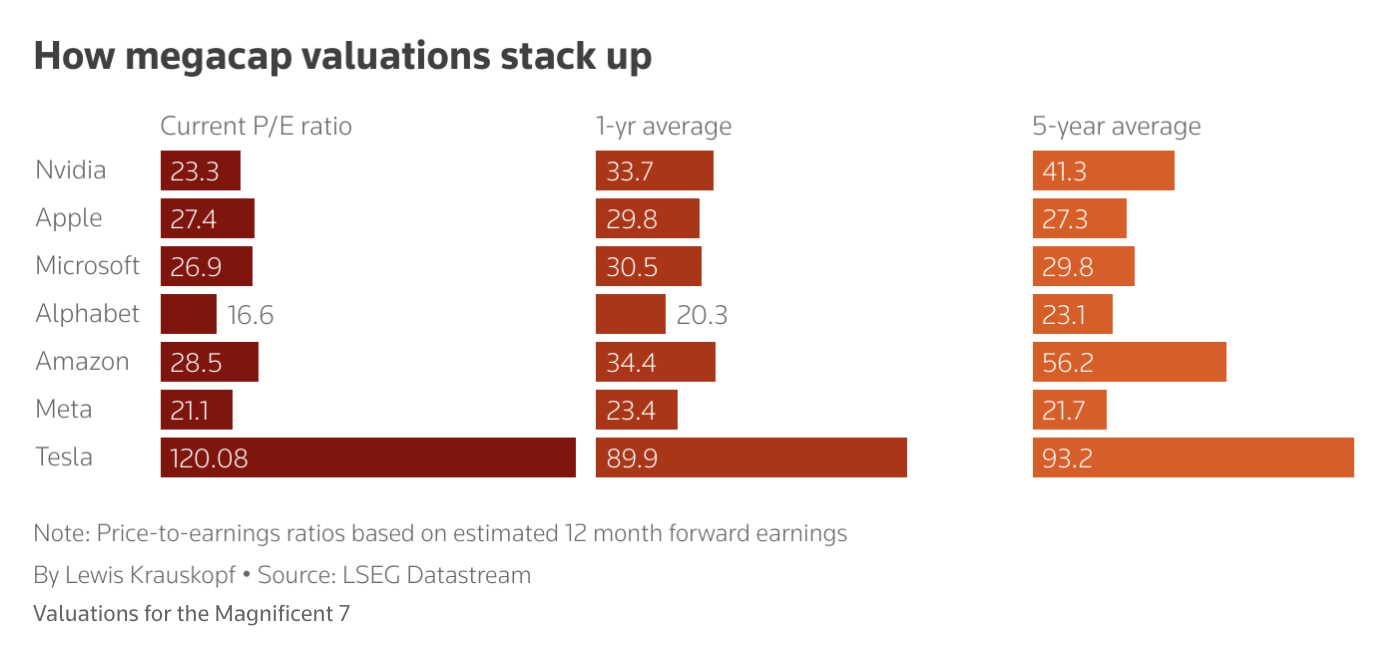
The notable exception is Alphabet (Google). Trading at approximately 16.6x forward earnings, the search leader offers compelling value relative to its quality metrics—specifically its high free cash flow (FCF) generation and a Return on Invested Capital (ROIC) exceeding 20%.
At 16.6x, Alphabet is significantly discounted relative to the broader market"s 21x, despite possessing superior fundamental quality. Meta also remains reasonably priced at roughly 21x forward earnings, aligning more closely with market averages.
That said, a more robust valuation framework should prioritize Price-to-Free Cash Flow (P/FCF) or EV/EBIT over headline earnings, which are often subject to accounting adjustments. (See more on Simplifying Quality and Value).
In closing, if aggregate earnings fall short of the $260–$270 consensus, the market will undergo a painful mean reversion. If the S&P 500 were to return to its historical 18x multiple on $260 in earnings, we would see the index trade back toward the 4800 level. Always calibrate your investment decisions by first calculating the potential downside.