The AI Red Queen Race: Why Massive Capex and Market Cycles Signal a Rotation to Value
- Secular booms typically end in long, stagnant "dead money"
- Let"s talk about the asymmetric downside risks to tech
- The "Red Queen" AI race forces expensive capex that could cannibalise ROIC
From an index perspective, it has been a lackluster start to the year.
At the time of writing, markets have made very little ground over the first 6 weeks.
The good news – it"s still early.
However, given the incredible gains we"ve enjoyed over the past few years, a pause is a healthy development.
For example, we must allow companies to actually "grow" into their (lofty) valuations.
To understand why this is important – let"s add perspective using the monthly chart of the S&P 500 for the past 26 years.
This helps us remove the noise associated with weekly and daily charts:
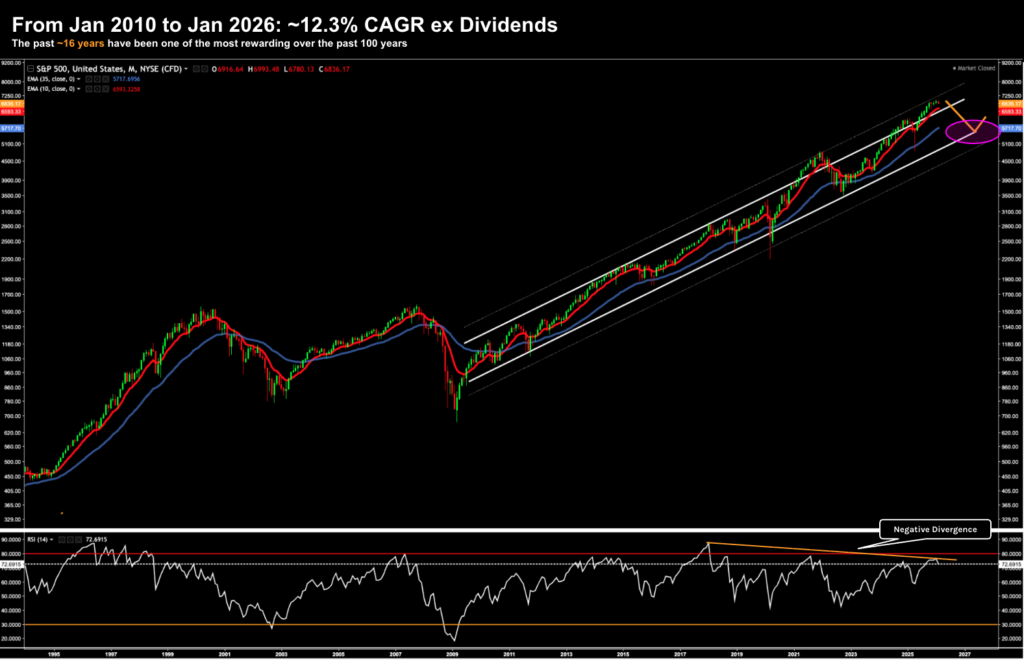
If you have only been investing for the past ~18 years, you have been conditioned by a market that effectively goes straight "up and to the right."
Anytime we have seen the market dip to test the 35-month EMA (blue line) — you have been rewarded.
For example, buying the 2020 COVID flash crash and the 2022 tech wobble paid off.
But rarely in our history have we seen an expansion of this velocity and duration.
Some quick math:
From January 2010 to today, the S&P 500 has delivered a CAGR of 12.3% (exclusive of dividends).
That"s extraordinary.
To appreciate how rare this is, we have to look back over a century of data – where only two other periods in American history compare:
- The Post-War Boom (1950–1966): An annualized price appreciation of ~10.2%.
- The Secular Bull (1982–2000): The era of the "PC Revolution," where price returns hit a staggering 13.5% CAGR.
These are indeed very rare times.
But….
For every secular boom – there is a bust. No exceptions.
What history cautions us with is following every decade-plus expansion – the market not only sheds around half of its value – it stays dead for a long time.
| Era | Peak Year | Drawdown % | Years to Reach Nominal Highs |
| Post-WWII Boom | 1966 | -45% | 16Years (1982) |
| Dot.com | 2000 | -49% | 7 Years (Nominal) / 13 Years (Real) |
| Global Financial Crisis | 2007 | -57% | 6 years (2013) |
I"m fortunate to have experienced both the busts of 2000 and 2007.
I say "fortunate" because of the investing lessons you learn.
So here"s a question:
What if 2026 is actually 1966 or 2000?
Of course we have no way of knowing – only time will tell.
But I can tell you in the 1960s and 1990s – the market "generals" appeared invincible (e.g., the "Googles" and "Nvidias" of their day)
History shows that the opportunity cost of staying "all-in" rises exponentially as prices outpace earnings (i.e., multiple expansion)
For example, when you pay for 15 years of future growth upfront, the market often forces you to wait a decade just to break even.
From mine, today"s expansion bears some similar hallmarks as the late 90s and the "Nifty Fifty" of the 60s; i.e.,
- Heavy concentration in a few names;
- Excessive valuations (e.g., 30x EV/EBIT; 40x P/FCF); and
- Investor psychology of a fear of missing out
No one understands this better than Warren Buffett.
He has successfully navigated these cycles for over 60 years by ruthlessly sticking to his circle of competence.
For example:
- In 1968 he told his partners he was "out of step" with the market.
- He refused to speculate, and eventually closed his partnership.
- He waited until 1974 to swoop on quality stocks at less than 10x earnings.
And we saw something similar in 1998:
- He was ridiculed as "washed up" for refusing to buy tech.
- By 2000, he sat on a mountain of cash while the Nasdaq began its 80% collapse.
Today the Oracle of Omaha sits in his largest percentage cash position ever (over 35%).
But Buffett isn"t predicting the future.
He will admit stocks could rise another 10-20% over the next two or three years.
And that"s more than fine.
What he is reacting to is the math of the present and what we could potentially lose.
That"s how he wins.
Money is Mercenary
When we look at the market"s performance throughout history – it typically begins and ends with its leaders.
In the 1960s it was the so-called "Nifty Fifty" (Amex, Coke, Dow Chemical)
In the 1990s, it was the tech stocks building out the Internet (Microsoft, GE, Cisco, Intel)
Today, the widely popular Mag 7 dominate the news flow:
Microsoft (MSFT), Meta (META), Amazon (AMZN), Apple (AAPL), Nvidia (NVDA), Alphabet (GOOGL), and Tesla (TSLA).
These seven names have carried the broad index to record highs, pulling the rest of the market"s valuation upward in their wake.
At the time of writing, they command somewhere between 35% and 40% of the total market"s weight.
Now investors who have stayed loyal to these names have been handsomely rewarded.
Buffett is included in this list – with his largest position being Apple – despite selling 66% of the iPhone maker the past 12 months.
However, are cracks appearing in investor"s enthusiasm?
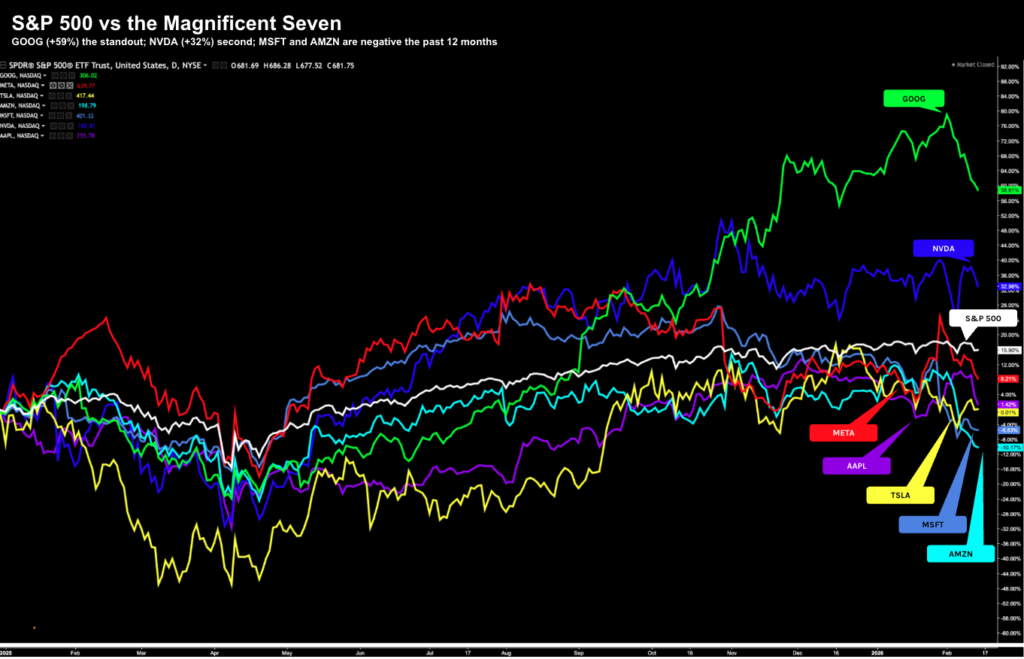
Above is their performance (vs the S&P 500 – white) over the past 12 months.
The Mag 7 price appreciation has stalled—with the notable exceptions of Nvidia and Google.
In fact, names like Microsoft and Amazon are actually trading lower than they were this time last year as investors begin to baulk at the staggering capital expenditure (capex) planned for AI.
But it"s not the stalling of the Mag 7 which has my attention.
What I have been paying more attention to is the opportunity cost of the "other 490."
There is a quiet rotation happening.
Money is moving out of tech giants and into areas where there is both:
- Far better value; and
- Far less risk.
For example, if an investor pays a modest ~15x EV/EBIT for a "boring" company with stable growth and a strong moat – we are looking at a 5-7% yield.
Paying this kind of multiple means less things have to go right for your bet to potentially pay off.
You have a greater margin of safety (as Buffett would say).
At 15x – money is becoming more rational.
Just on this, Bloomberg Opinion"s John Authers shared a chart last week:

Growth is out and value is in.
Now I don"t think this is simply investors suffering from a temporary "mood swing" on the Mag 7.
This rotation into value (at a reasonable multiple) is earned.
For example, for the first time in four years, 8 out of 11 sectors are showing positive growth.

This is a large departure from the last few years when it felt like the only place you could put money was tech.
Not today…
It may surprise you to learn that half of the companies in the S&P 500 are growing their profits by double digits.

Again, it"s not at all surprising to see money lose its "loyalty" to tech.
In that sense, money is mercenary. It goes where it is treated best.
And right now – potential cash furnaces face warranted scrutiny.
Gold Mine or Cash Furnace?
The prevailing narrative in the market today is this:
"AI is the future, therefore you must own the companies building it."
Sure. I get that.
The same logic held for Cisco (CSCO) in the 1990s.
At one point – the switches and routers company building the backbone of the web – was the market"s largest company.
The stock ended up losing 90% of its value in a single year (despite being highly profitable).
Here we need to invert our thinking:
"Who is being forced to spend a fortune just to keep their head above water?"
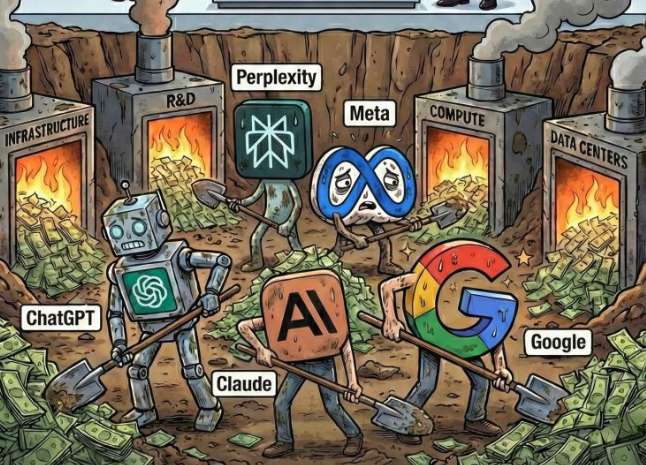
This clever graphic illustrates what the "AI arms race" has become.
The Mag 7— the notable exception of Apple—are being forced to commit hundreds of billions of dollars to infrastructure just to ensure they don"t fall behind.
It is a classic "Red Queen"s Race," famously described in Lewis Carroll"s Alice in Wonderland:
"Well, in our country," said Alice, still panting a little, "you"d generally get to somewhere else — if you run very fast for a long time, as we"ve been doing."
"A slow sort of country!" said the Queen. "Now, here, you see, it takes all the running you can do, to keep in the same place. If you want to get somewhere else, you must run at least twice as fast as that!"
Consider the math:
- If every major tech company spends $50 billion on AI to become 10% more efficient, the competitive landscape doesn"t actually change.
- No one gets ahead; they all just have $50 billion less in the bank.
This isn"t just a strategic business decision – it"s a "psychological lollapalooza".
Charlie Munger would say these (AI) CEO"s visceral fear of losing their dominant position in AI is far stronger than the rational desire to protect their ROIC.
For example, when a company with a 30% ROIC starts funneling half its FCF into an infrastructure war where the outcome is merely "staying competitive," that marginal ROIC on new capital inevitably begins to look like a commodity business, not a software business.
This creates a feedback loop of social proof; i.e., if everyone is spending $50B a quarter, the collective ego assumes it must be the right thing to do.
Meanwhile, those "boring" companies we spoke of —the ones that sell gravel, canned soup, or electricity—are quietly making money.
And whilst they might invest in AI to explore internal efficiencies (improving their ROE and ROIC) – they aren"t the ones funding the hundreds of billions in infrastructure.
This leaves the tech giants locked in a brutal and expensive war of cash burn.
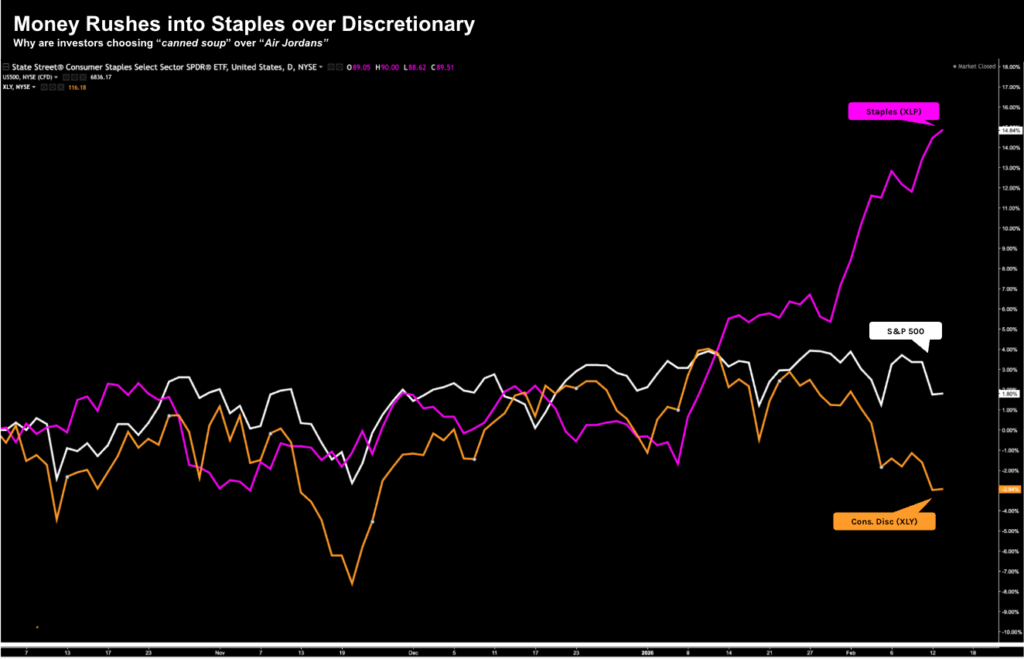
Staples Up = Risk Off?
To conclude this post – it"s been interesting to observe the sharp downturn in consumer discretionary stocks.
This sector typically benefits from a thriving economy — however they are notably lagging consumer staples.
Again, the question is why?
Let me summarise the (loose) market narrative:
- The economy is strong – with Real GDP at 3.7% (Atlanta Fed forecast)
- Corporate profits are near record highs.
- CY 2026, analysts project earnings growth of 14.4% and revenue growth of 7.5%
That"s a great set of numbers?
Therefore, why are investors so keen to buy stocks selling "smokes and soda"?
Four possible reasons (and not intended to be exhaustive):
1. Labor Market Cracks
While unemployment is low – it was a mixed January jobs report.
US job openings have hit five-year lows, and job growth in late 2025 was the slowest non-recessionary pace since 2003.
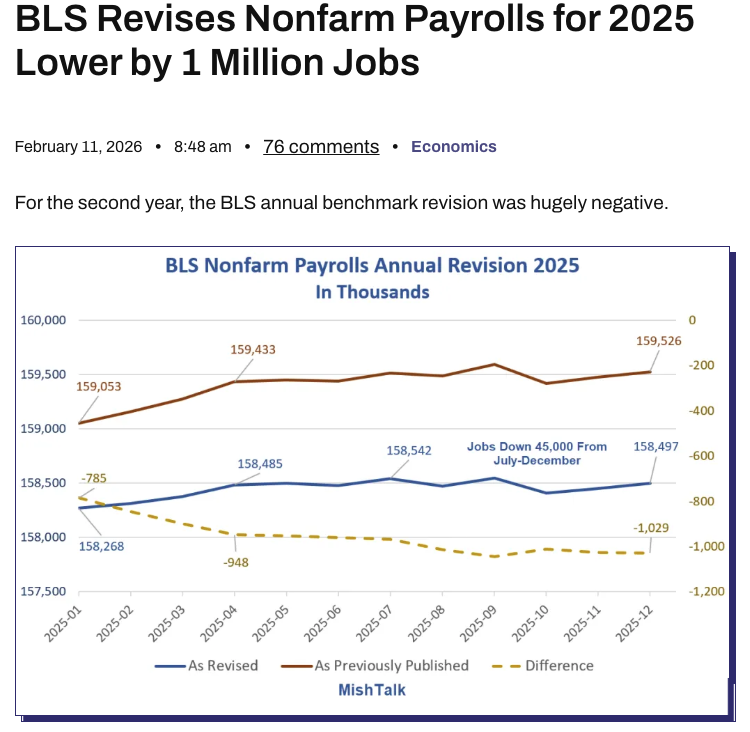
Mike Shedlock does a great job of reading beyond the headline number:
2. "Bottom K" Stress
Credit card delinquencies have risen to their highest levels since 2011.
This suggests that while the "top-line economy" (GDP) looks solid – the average consumer"s disposable income is being squeezed by sticky inflation (hovering around 3%).
Therefore, it"s feasible that investors might be reacting to the "downshifting" in consumption growth.
Here"s Morning Star on why the US" "K-Shaped" economy poses a risk for growth.
- Higher-income households have seen their wealth and confidence surge thanks to strong stock market returns, while lower-income households have struggled.
- That divide means the outlook for the economy is more precarious.
- The US economy is looking lopsided. High-earning households are propping up consumer spending while lower earners are pinching pennies.
As an aside, perhaps some "wealthy investors" assume because their portfolio is up, the economy is fine.
But the "K-Shaped" data is a warning.
While the "top" of the K is enjoying the 12.3% CAGR, the "bottom" of the K is facing credit card rates of 22% and "sticky" inflation (around 3%).
For the market to do well – it needs the "bottom" K in a good place too.
3. Structural Staple Tailwinds
The "One Big Beautiful Bill Act" fiscal stimulus is expected to boost middle-income disposable income via tax refunds (estimated by $1,000 for the year).
Therefore, it"s possible investors are betting the $1,000 average refund will flow directly into "premium" staple brands.
For example, Robert Moskow (TD Cowen) noted, a consumer with a fresh tax refund is more likely to pay a premium for a "name brand" at the grocery store, boosting the margins of companies like Procter & Gamble and PepsiCo.
4. Valuations
Consumer staples entered 2026 at relatively depressed levels compared to the market average of ~22x forward earnings (higher for the Mag 7).
For example, many moated staples (such as Philip Morris or Coca-Cola) are trading closer to the 15x-20x EV/EBIT – which includes dividend yields of 3-4%.
Putting it All Together
None of this should be taken to mean the market will crash anytime soon.
As I mentioned earlier – the market could be another 10% to 20% higher in a year or two.
Momentum is a powerful force.
However, I look at things from the perspective of not what I am missing out on… but what I could lose.
For me, I don"t think the risk/reward is attractive at this point.
Put another way, it"s not a "fat pitch" (as Buffett would say).
Some of the large cap tech names are looking a little more interesting (e.g., Microsoft and Amazon) – but they still have room to fall (especially on a P/FCF basis).
What I"ve been looking at the past few months are "boring" names.
For example, some names in energy, health-care and staples were attractive.
Most of these are not going to grow their "top-line by 20%"… but nor do I need them to.
The strength and sustainability of any long-term compounding returns will always be more function of what I pay.