Will We See a Santa Rally?
- $1.9 Trillion "Build Back Better" is dead (in its current form)
- Defensive shift continues as Goldman slash their growth outlook
- Stocks lose momentum on a cloudy outlook
Historically the second half of December is said to be a strong time of year…
And it still might be…
The "Santa Rally" is said to take place on the last five trading days of December and the first two of January.
We have six trading days remaining for 2021… so there"s still time.
Markets have mostly traded sideways the past three to four months – as we see bifurcation between value and growth.
For example, more defensive names with strong predictable cash flows are catching a bid.
And this makes sense given the following unknowns:
- The timing (and number) of Fed rate hikes to combat high inflation
- The ongoing threat(s) of Omicron and resultant government policy; and now
- Questions on what government fiscal stimulus we will see.
Today it was renewed Omicron fears and the "death" of Biden"s 2,466 page "Build Back Better (BBB)" Act.
With respect to the latter – $1.9 Trillion was effectively taken away from the punch-bowl.
The "good" news?
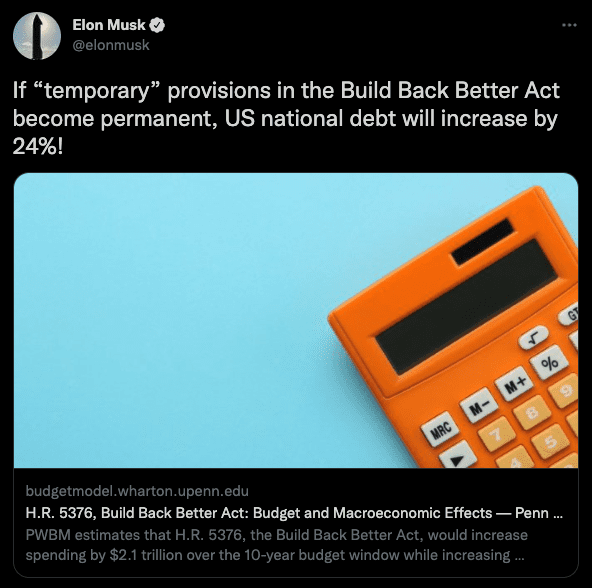
The US is no longer looking to increase the national debt by 24% (i.e., an estimated $2.1 Trillion over 10 years – according to budget analysis from Wharton School of the University of Pennsylvania).
Here"s a tweet from Elon Musk – who expressed his disapproval of the bill – despite a govt $12K subsidy for any new electric vehicle purchase)
I wondered what an extra $2.1 Trillion over 10 years would look like with far higher rates?
Build back broke maybe?
In addition, does trillions in extra money help or hinder the outlook for inflation?
After all, inflation is simply excess money chasing fewer goods. It"s hard to see how an extra couple of trillion would be disinflationary?
All that said, BBB isn"t dead…
Congress will find new ways to confiscate more wealth and redistribute it in other ways.
But if BBB is to pass – the aggregate amount of spend (and it"s far reaching scope) will likely be less.
That"s a good thing from my lens… as we don"t need a significantly higher debt burden (at higher rates) to stifle long-term growth.
4-Month Sideways Grind
As we wrap up 2021 – it"s becoming clear that the bulk of the gains (if not all) were made in the first 8 months.
For example, from late August ("A") stocks have essentially moved sideways:
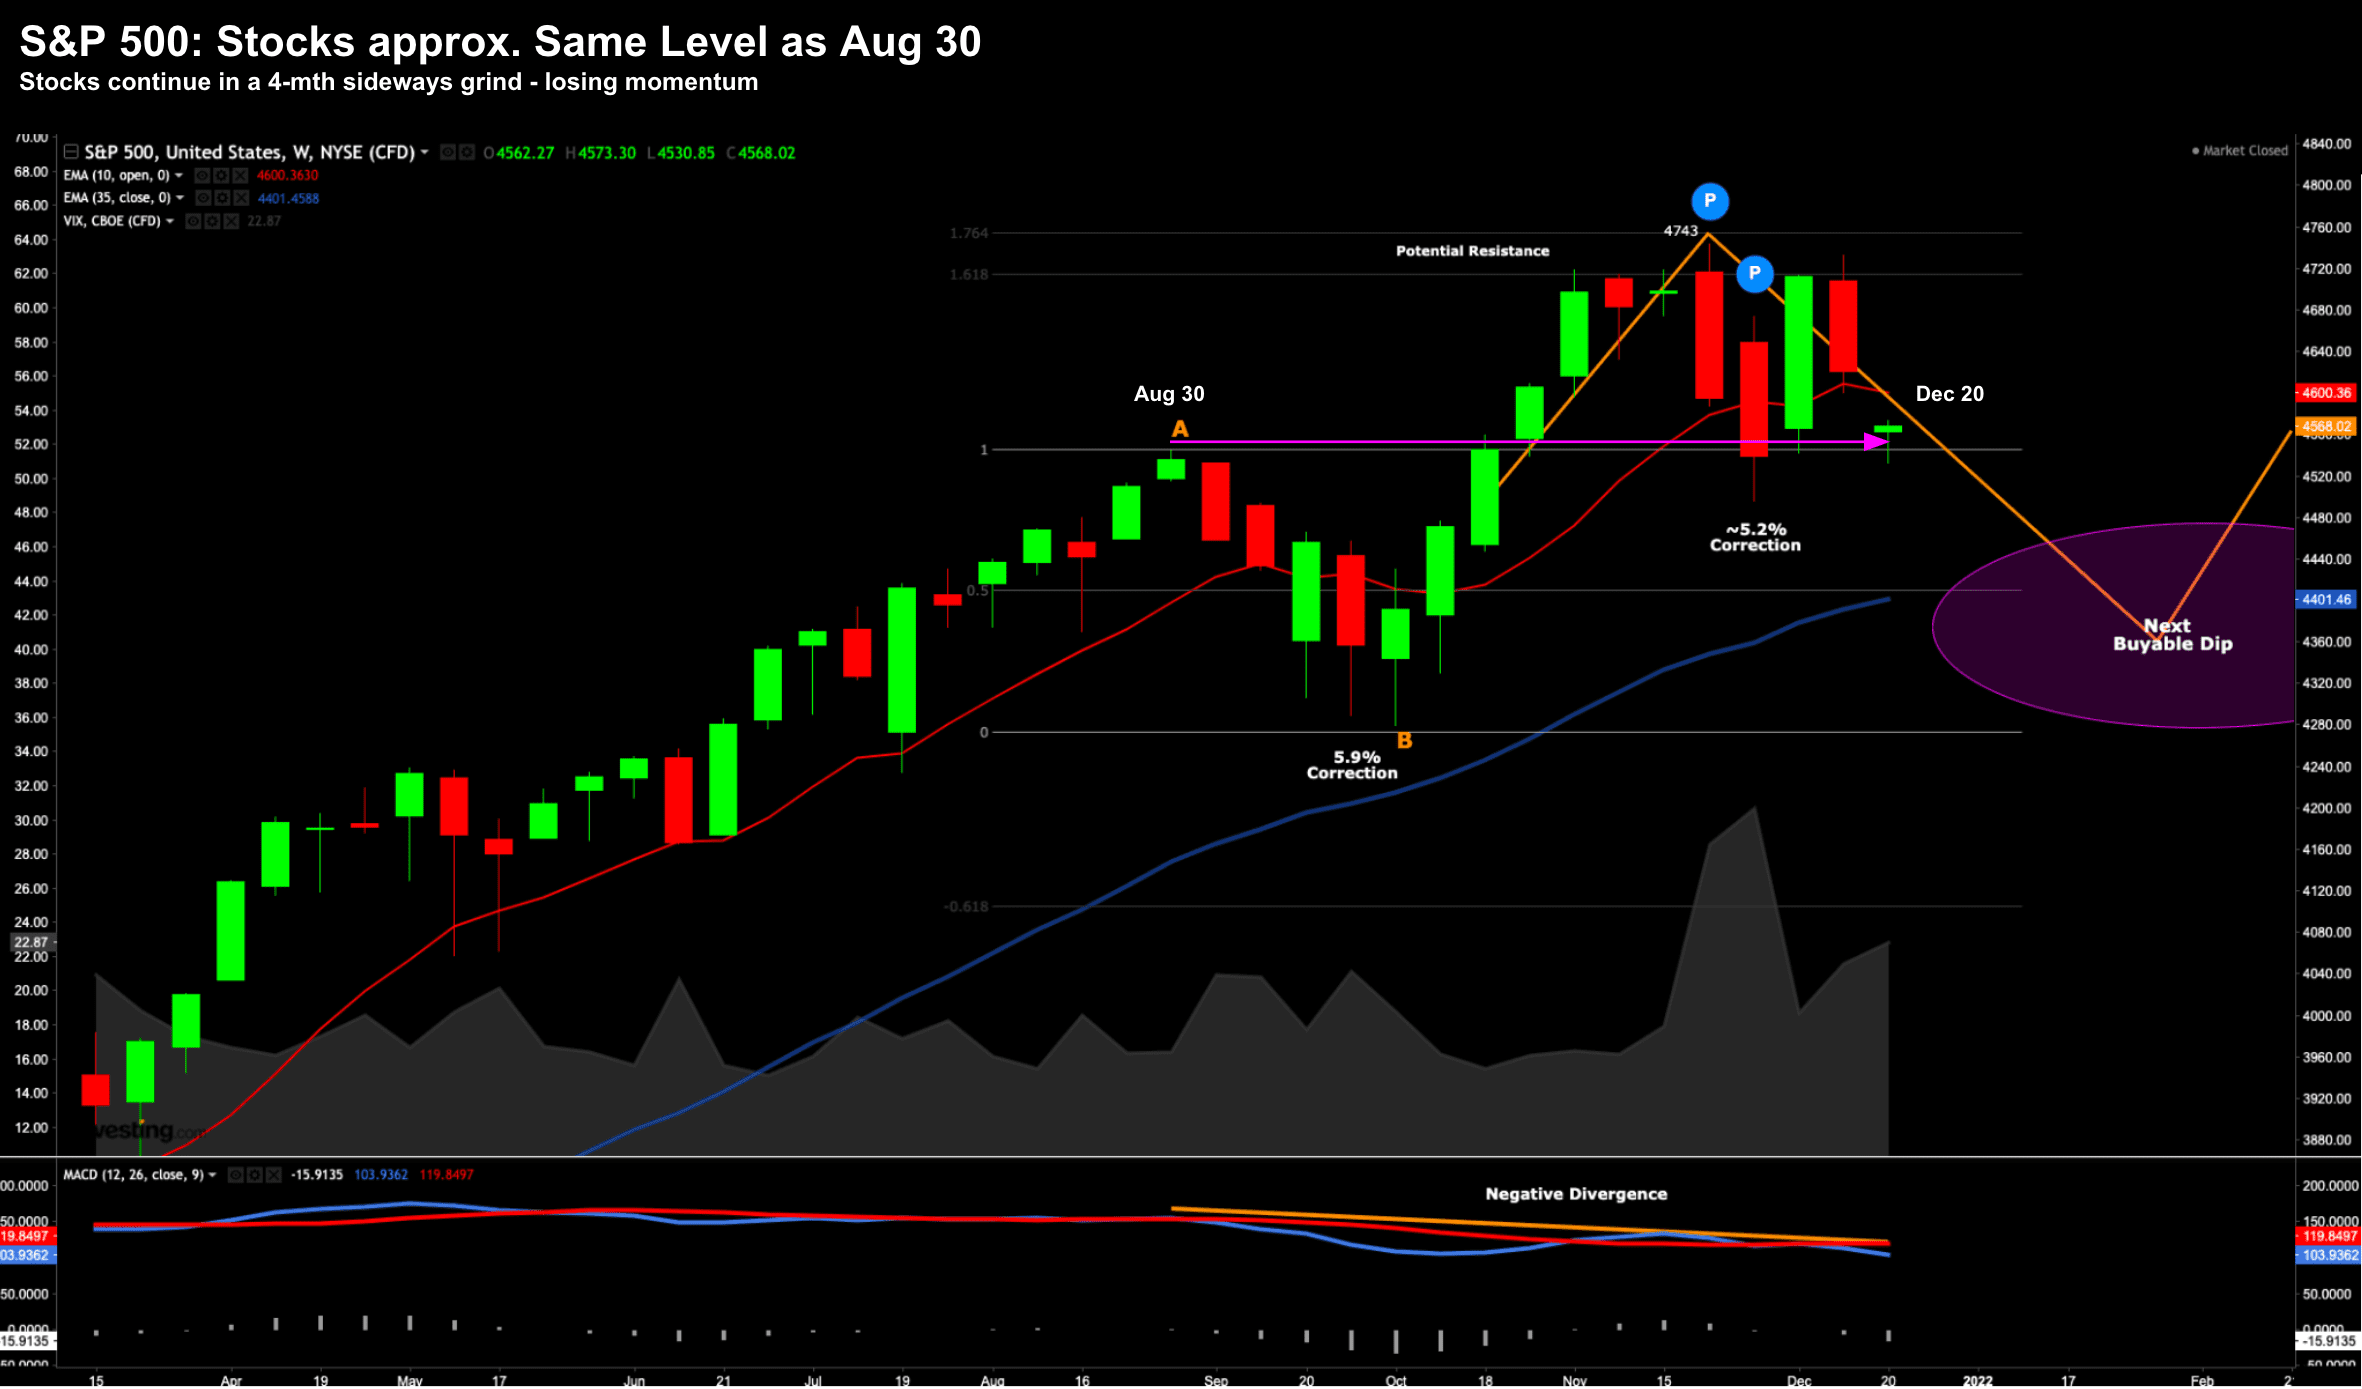
Dec 20 2021
This is the market pricing in a first rate hike in March (and three for 2022); in addition to the likelihood of less (new) liquidity.
Prices are adjusting.
And whilst I don"t think three rate hikes (and far less QE) will be devastating for either stocks or the economy… it"s clear the market is reacting to fundamentals.
This has not been the case the past 24+ months.
Lower-multiple names (i.e., value) are being bid… as higher-multiple names fall sharply.
Take a look at the QQQ ETF (as a proxy for high-growth)
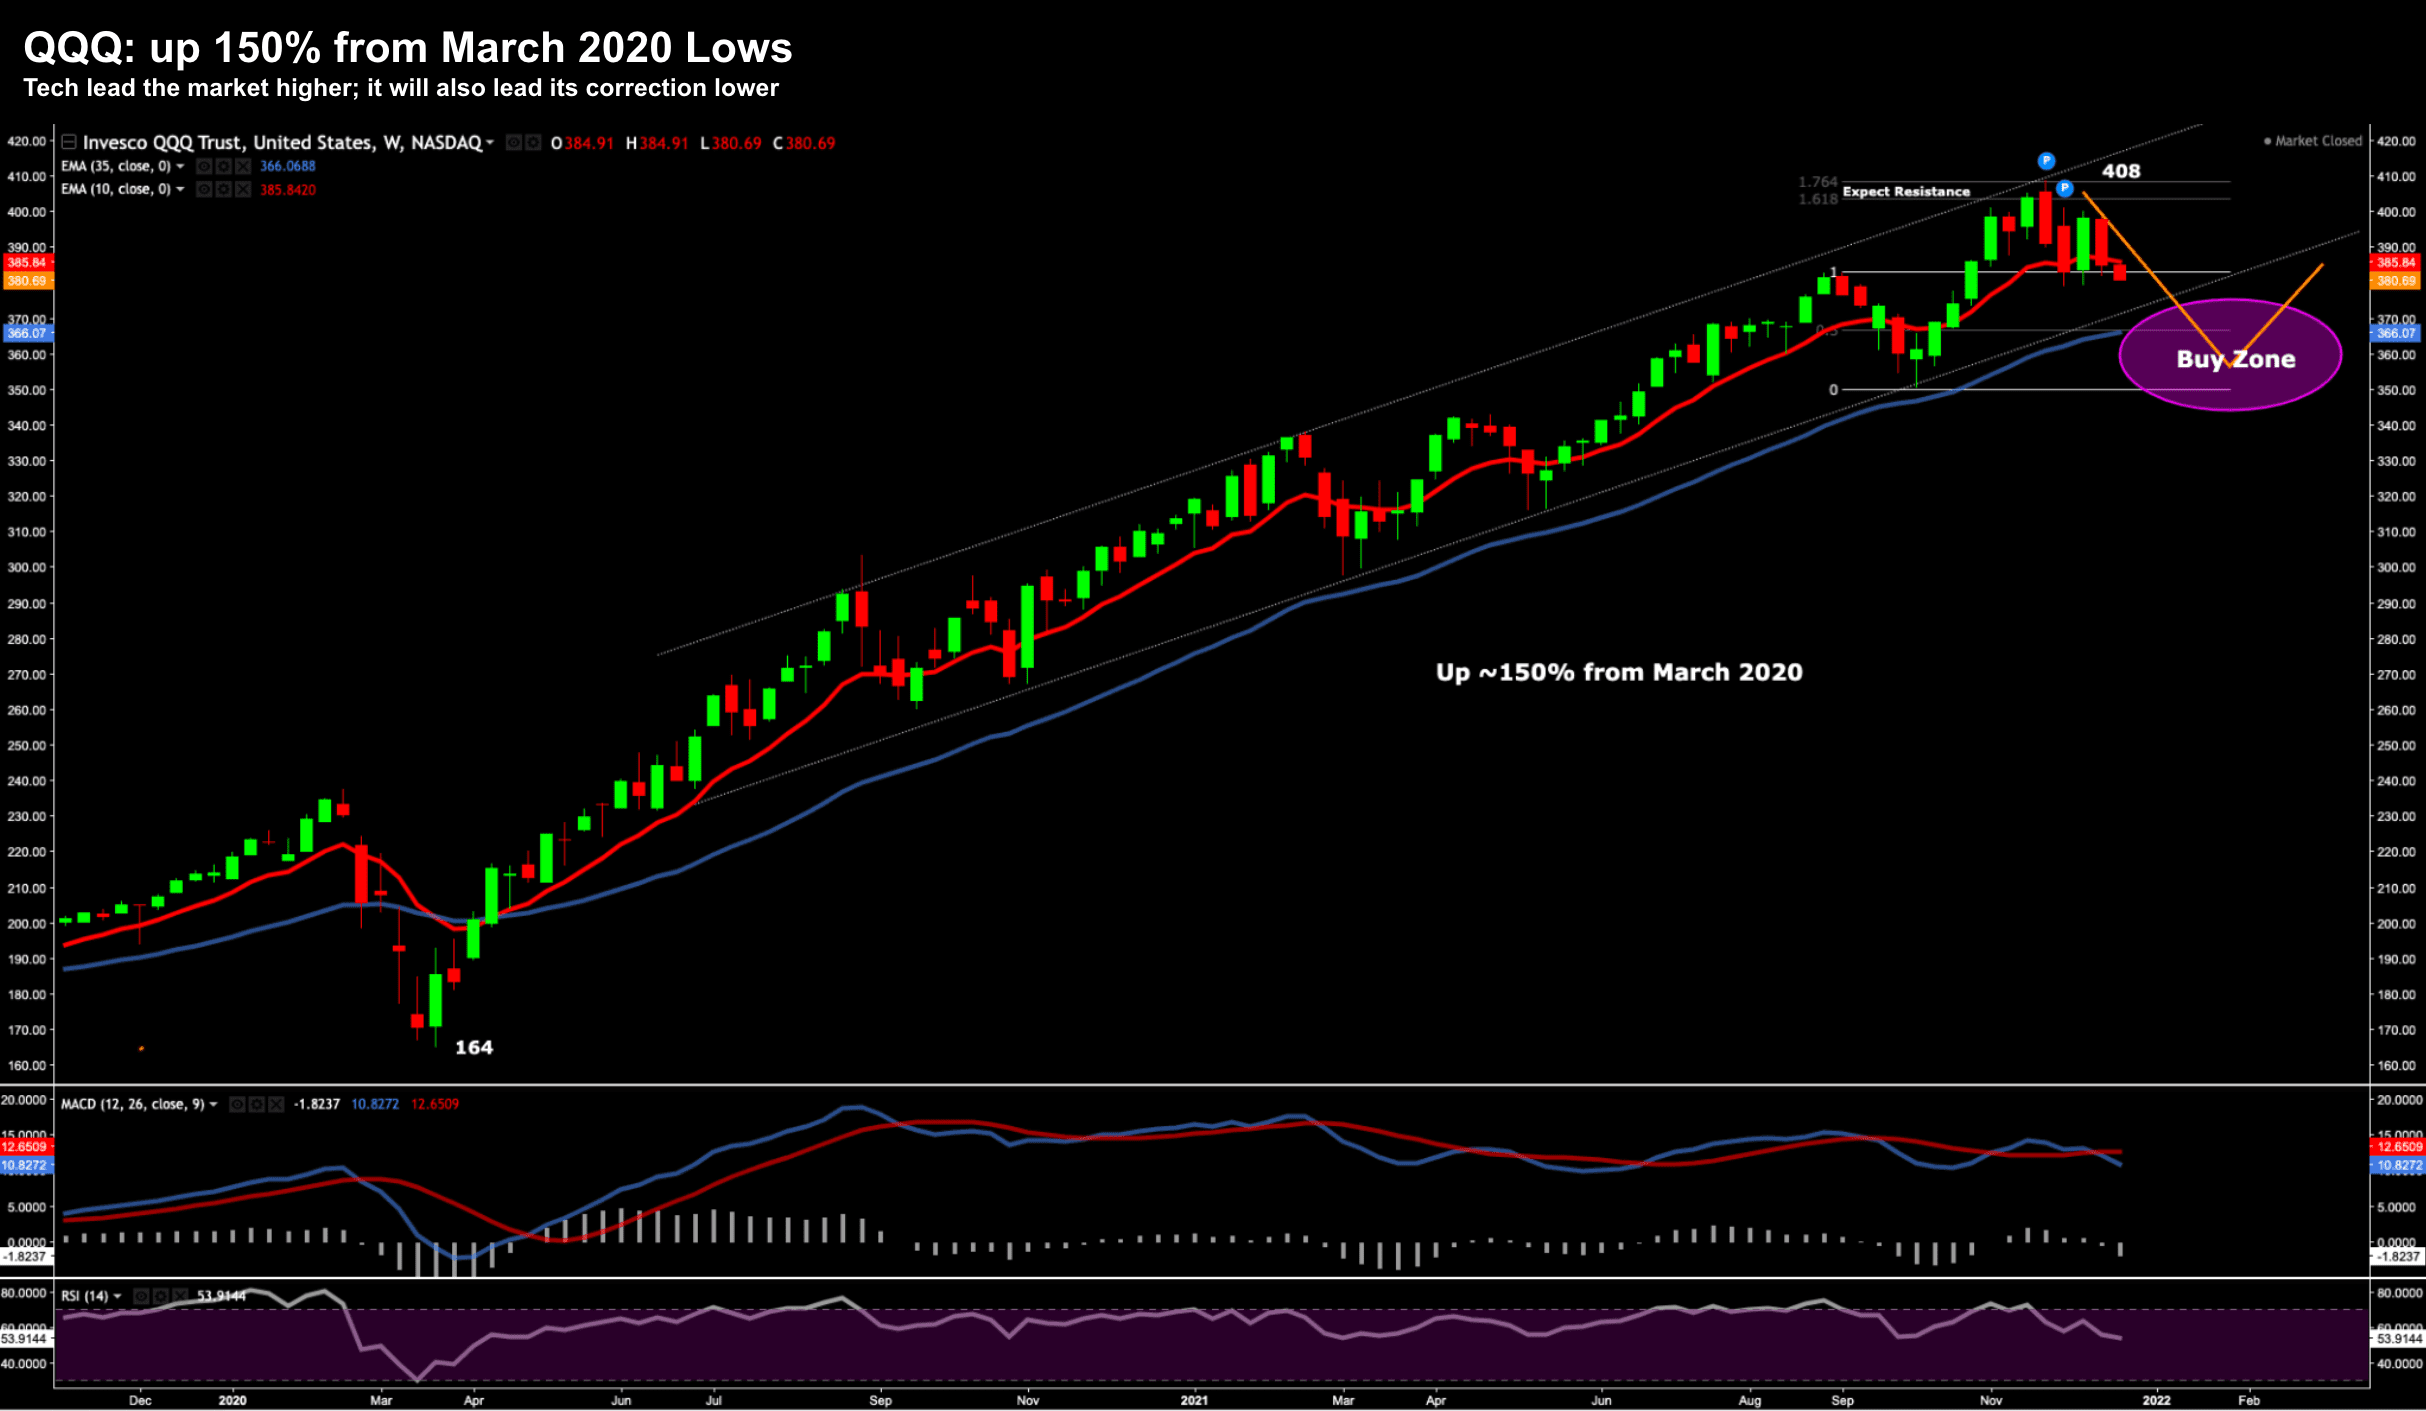
Dec 20 2021
This ETF has rallied an incredible 150% from the March 2020 lows.
However, the past four months has seen this ETF stall for the reasons above.
In this environment, the ability for companies to grow income streams will be critically important.
To that extent, those companies which have strong cash flows today will likely outperform stocks that "promise" cash flows in the future.
This will be the theme next year (and potentially beyond pending rates).
More speculative companies which have cash flows weighted to the future will come under a higher level of scrutiny; and from mine, many of these names still have a long way to fall.
10-Year Yields are not Optimistic
Today, we saw these longer-duration yields rally a few basis points… which is good news.
Higher yields indicate a more optimistic outlook.
That said, they still trade about 10 bps below 1.50% (which is incredibly low from an historical context)
For example, below is the monthly chart for the all-important 10-year yield from 2009:
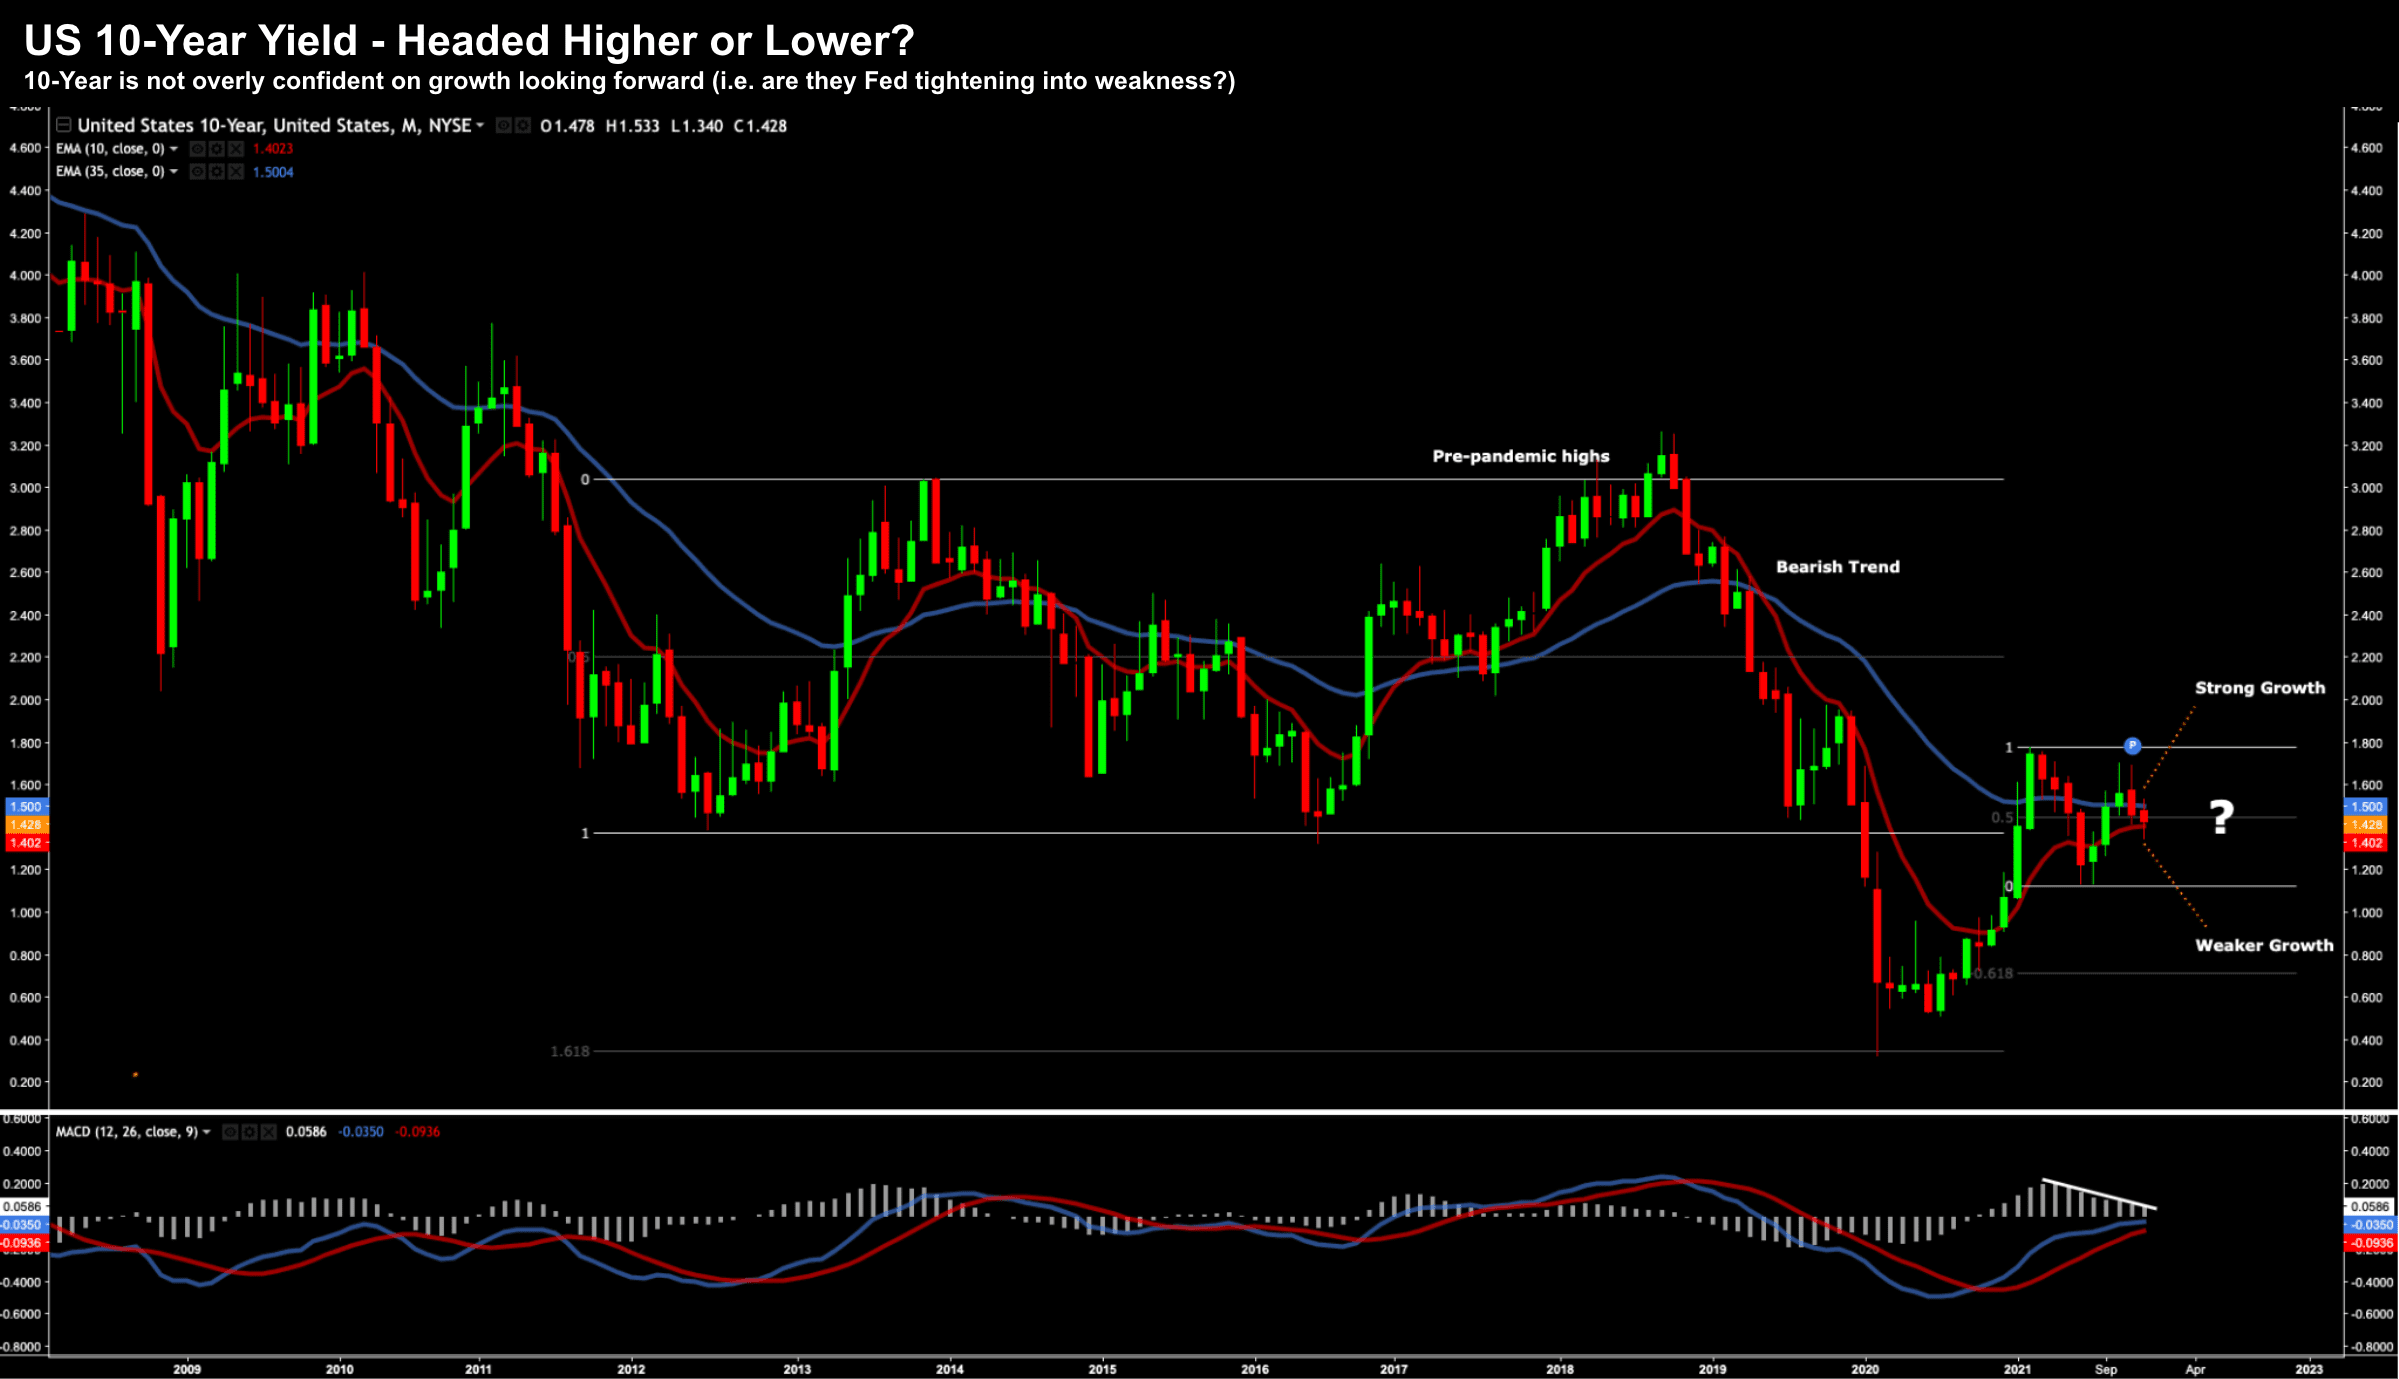
Dec 20 2021
Question is:
Which way from here?
I"m leaning lower (technically and fundamentally).
For example, the monthly trend is down – with the 10-month exponential moving average (EMA) well below the 35-month EMA.
In fact, this trend tuned negative around 2.50% (June 2019)
We saw a sharp rally from April 2020 after the Fed rushed in with its massive (new) QE program – where they bought all forms of debt (public and private).
Now that debt-binge is coming to an end (in my view 6-9 months too late – hence the inflation problem).
We also have short-term rate rises to combat higher-than-expected inflation (for longer); and uncertainty on any fiscal stimulus.
As an aside, Goldman Sachs" GDP growth outlook for 2022 is around ~2.5% to 3.0% – falling to ~2.5% in 2023.
GS took an axe to their previous 4% growth target once they saw "BBB" was dead.
To me, this view feels consistent with the 10-year yield below 1.50%… i.e. anaemic growth.
Lower yields are a bearish sign – let"s hope they pick up.
Putting it All Together…
The S&P 500 dropped ~3% over the past three days – marking the worst decline over a three-day span since September.
I feel we are working through the early stages of a decent (buyable) correction.
However, it won"t be in a straight line.
Tomorrow it"s likely we add "1.5%" to major indices… it"s that kind of market.
In any case, equities will post a banner year.
And if we finish anywhere near 20% gains at year end – few people will be complaining.
Amazing what a few trillion with zero rates does for risk assets.
I remain bullish on quality names heading into 2022… especially with credit spreads low and corporate profits strong.
This market still has legs… it just won"t be at the same velocity as 2021.