Your Cash Really is ‘Trash’ the next 12+ Months
- Cash to return negative 5%+ the next 12+ months
- Expect plenty of volatility the next few weeks
- Is buying the market today a lower probability (long-term) bet?
September has a reputation for being volatile…
And last week didn"t disappoint!
Markets were ~5% off their all-time highs after Tuesday however rallied Wednesday and Thursday.
My guess is volatility is likely to continue well into October.
For example, based on the Stock Almanac – October"s volatility is 36% higher than the average of the other 11 months of the year.
And there are plenty of catalysts to pull stocks in both directions.
This week the Fed is back on stage with Chairman Jerome Powell testifying before Congress.
We also have data including durable goods, PCE inflation and ISM manufacturing.
On the Hill, Congress must address an appropriations bill in the coming week or the government could shut down by Friday.
And of course, there is the growing concern with earnings and any impact on both sales (due to supply-chain issues) and margins (with inflationary pressure).
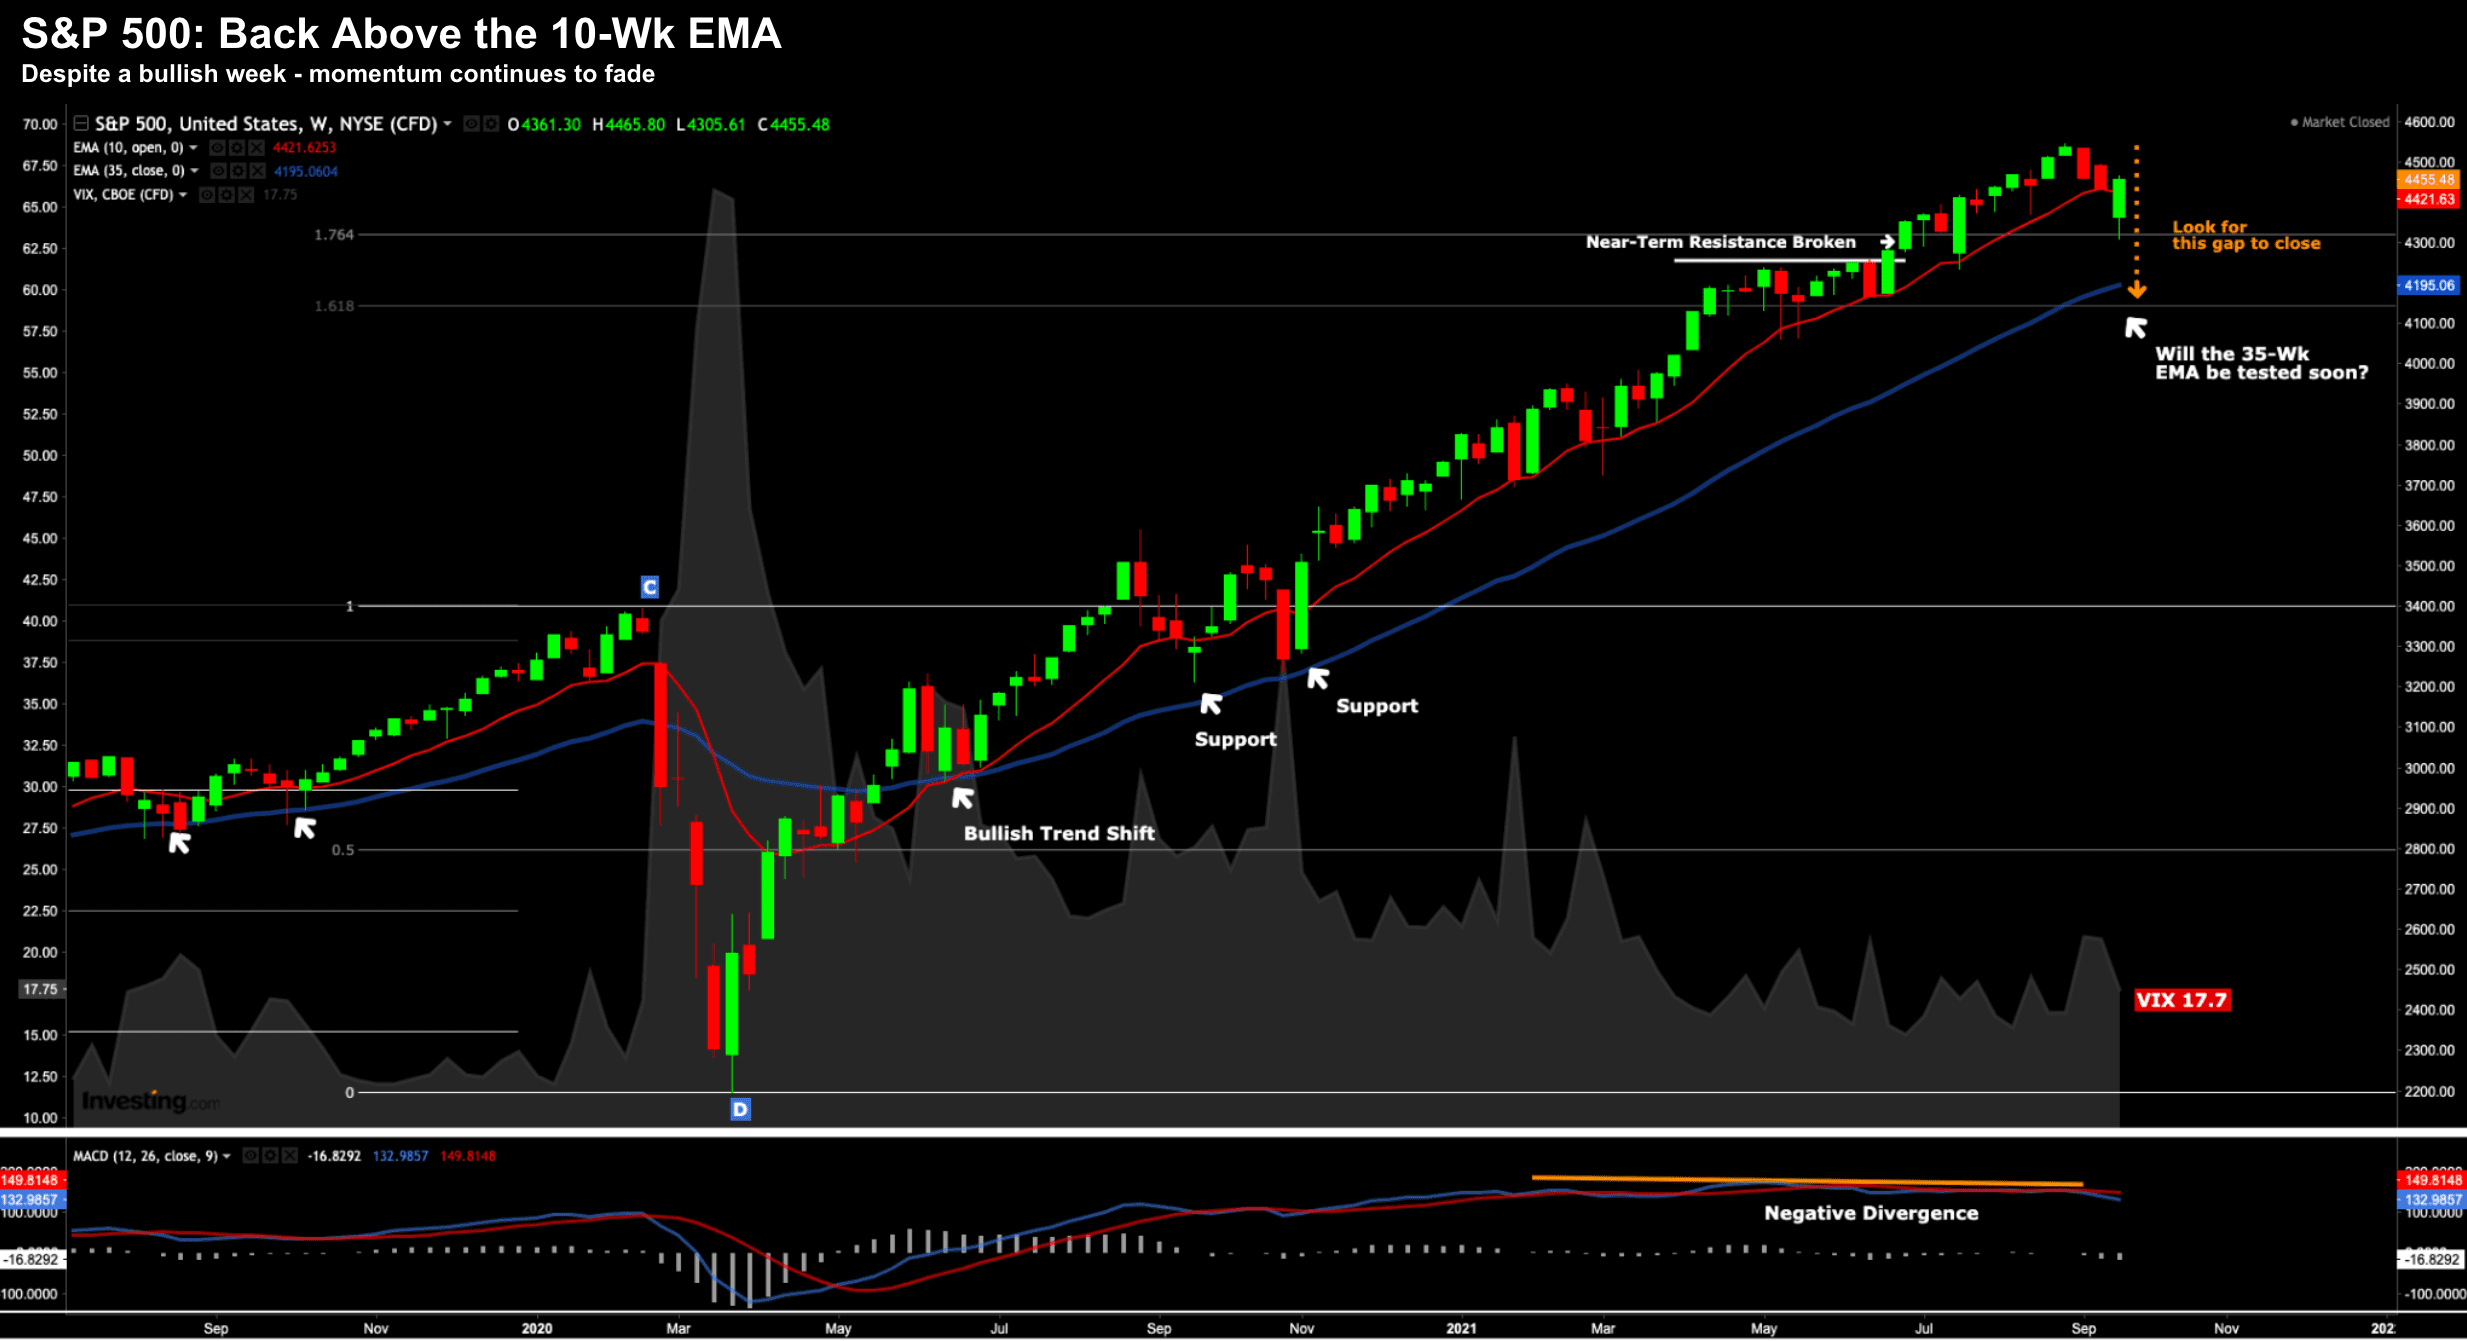
First I will start with the weekly chart for the S&P 500…
S&P 500 Recovers from a 5% Dip
Whilst markets recovered some lost ground – my view is the S&P 500 is likely to test the 35-week EMA zone over the coming weeks…
Whether that plays out or not… who knows?
As I say – there are a number of potentially market moving events over the coming weeks – most notably Q3 earnings.
Now the ~7% to 10% correction I am looking for was starting to take shape earlier this week – however dovish language from the Fed changed that.
What do you mean "dovish" some readers might ask? Aren"t the Fed planning to taper and possibly raise rates as early as late 2022 – isn"t that "hawkish"?
Well.. not in my book.
For example, someone needs to explain to me what"s hawkish with:
(a) QE continuing well into 2022 (e.g. monthly purchases of $120B through to at least December); and
(b) real rates (i.e., the short-term rate adjusted for inflation) remaining deeply negative for at least 12 months?
That"s as dovish as you can get given GDP is growing well north of 4%.
Now what we see with interest rates are especially important (as I will talk to shortly)
For example, with inflation still likely to exceed short term rates for at least all of 2022 (and possibly longer) – this means real rates will remain negative. In other words, your cash will lose money over the next 12+ months (and as much as 5%).
But let"s first look at the weekly chart… as market"s reacted positively to Jay Powell"s non-commitment to taper asset purchases.
Sept 26 2021ngs.
Technically it was a win for the bulls this week as the sellers could not keep the price below the 10-week EMA.
For example, as we"ve seen since April 2020 (i.e. almost 18 months) – this has been the trading theme.
That is, as soon as the market dips below the 10-week EMA (or tests this level) – the bulls rush in to buy stocks.
Perhaps the one exception was the week of October 26 2020 – where markets tested the 35-week EMA – however they were snapped up the following week. And since then – the 35-week EMA has not been threatened once.
However, look at what we see with the weekly-MACD in the lower window. The negative divergence continues which (for me) remains a risk to the price action continuing higher.
The other observation I had this week was the VIX.
It spiked to almost 30 after Tuesday – however quickly fell back to levels of around 17 to end the week. That"s an extreme swing for the VIX but highlights to me how quickly things can change.
You only need to blink.
For those who are interested – I maintained my (above average) 50% cash position – with the balance staying "long the market".
Your Cash is Trash!
Okay… back to my comment "your cash will lose money over the next 12+ months"
Now whilst we would never use these works, Fed Chair Jay Powell has told you "your cash is trash"
And he (and the FOMC) are quite happy with that… as they hold a (monetary) gun to savers (and retirees) heads.
As an aside, when the question of the negative impact to retirees was put to Janet Yellen years ago (with rates essentially negative in real terms)…
Her response was effectively "sometimes there are trade-offs"
Hmm mmm.
However, when Yellen was Chair, that trade-off was closer to 1%, versus today"s loss of at least 5%
So let"s explain why your cash is likely to lose money…
If we assume the first Fed rate hike of 25 basis points (i.e. 0.25%) around Dec 2022 (as the market now expects) and the rate of inflation slows over the next 12 months to 5% (from well above 5% today) – there is your loss.
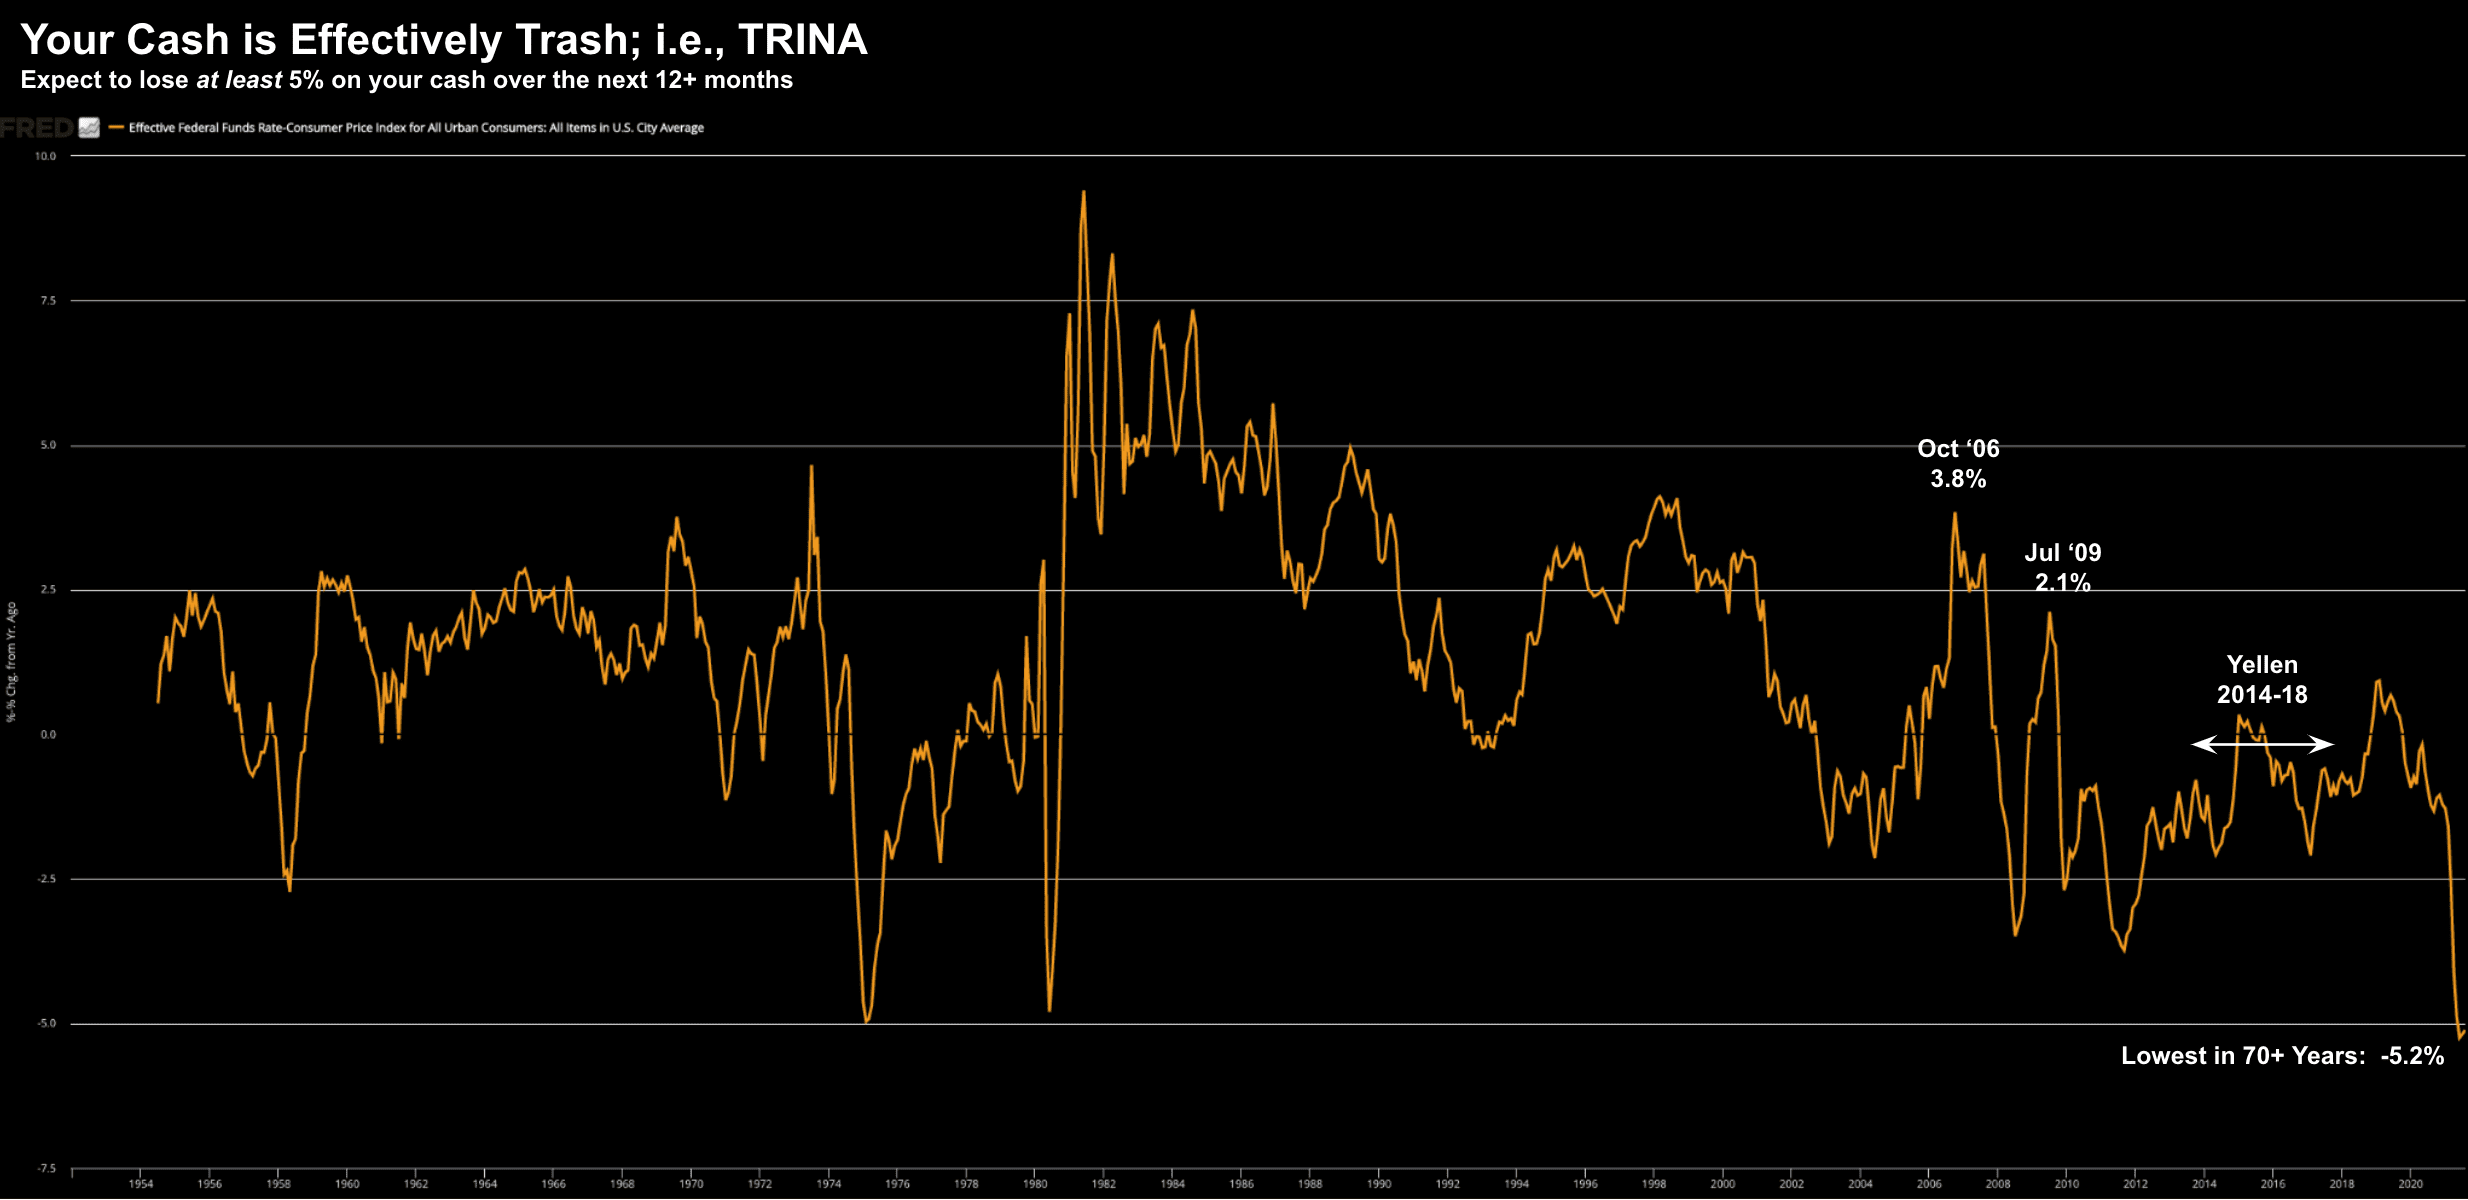
To dimension the erosion of your cash – take a look at real rates going back some 70+ years.
Sept 26 2021
From mine, this says it all.
What"s TRINA you ask: "There Really is No Alternative"
There have only been two episodes in "recent" history where the loss on cash was this great: (1) -4.96% 1975; and (2) -4.8% June 1980
Let"s now look at what happened with rates shortly after those periods – starting with 1975:
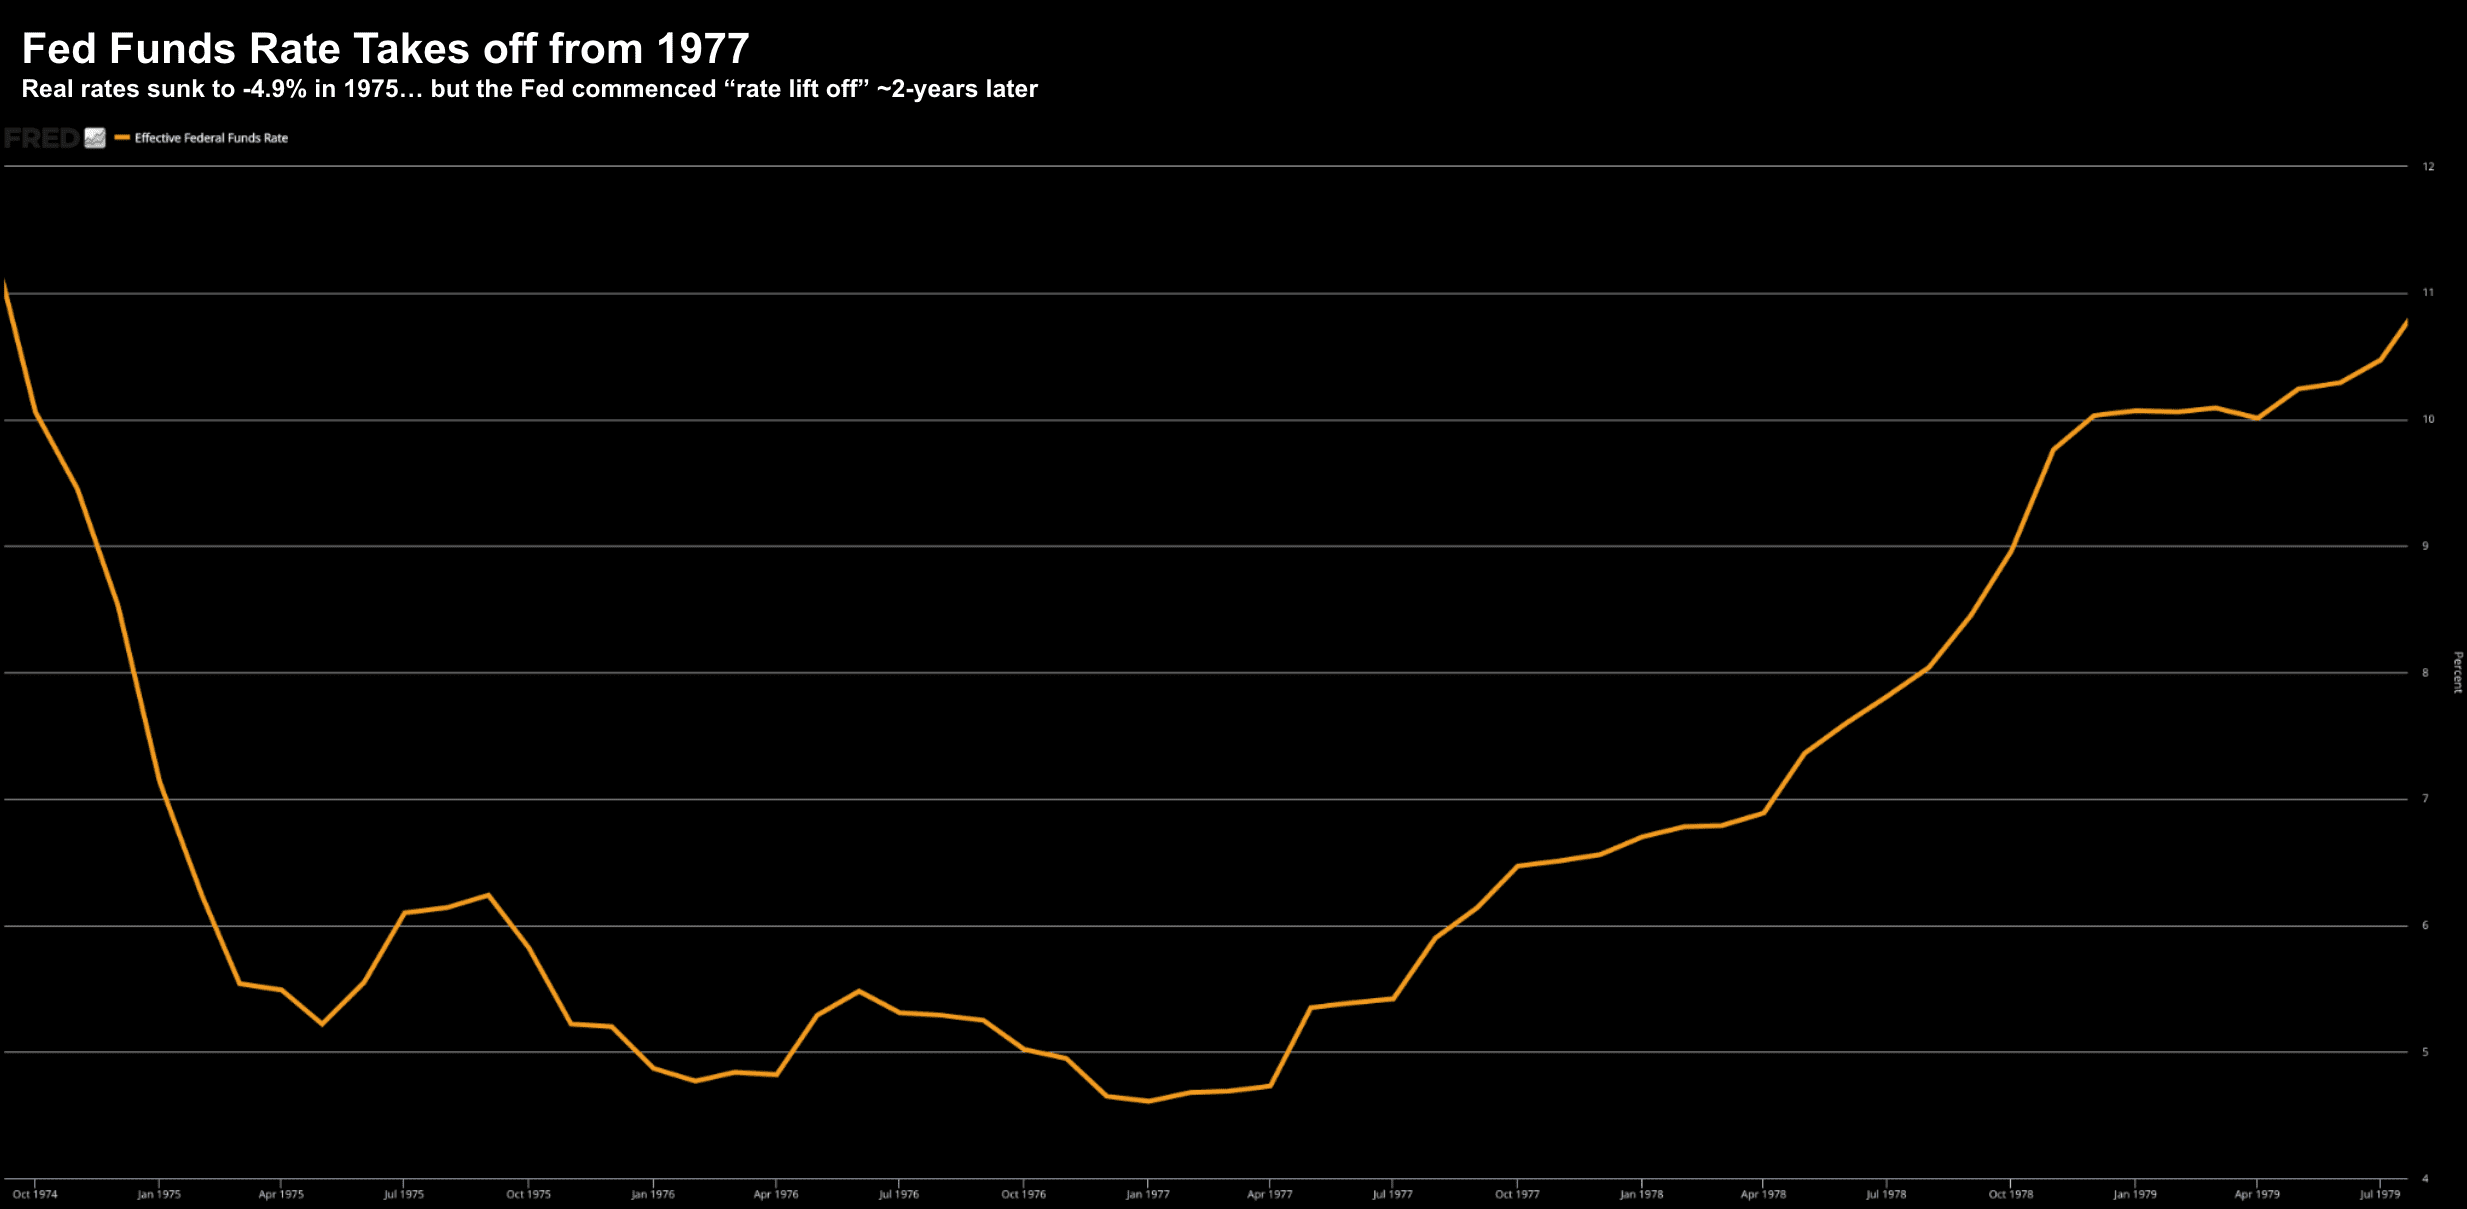
The Fed commenced rate lift-off early 1977 after savers were crushed with higher inflation.
The effective Fed funds rate rose from 4.6% to over 10% in just two years…. as growth slumped (i.e. stagflation)
Now in 1980 – extremely high inflation gripped the market again as the real rate of interest plunged to -4.8% in June.
Let"s look at what happened in subsequent months (and years) with the effective Fed funds rate:
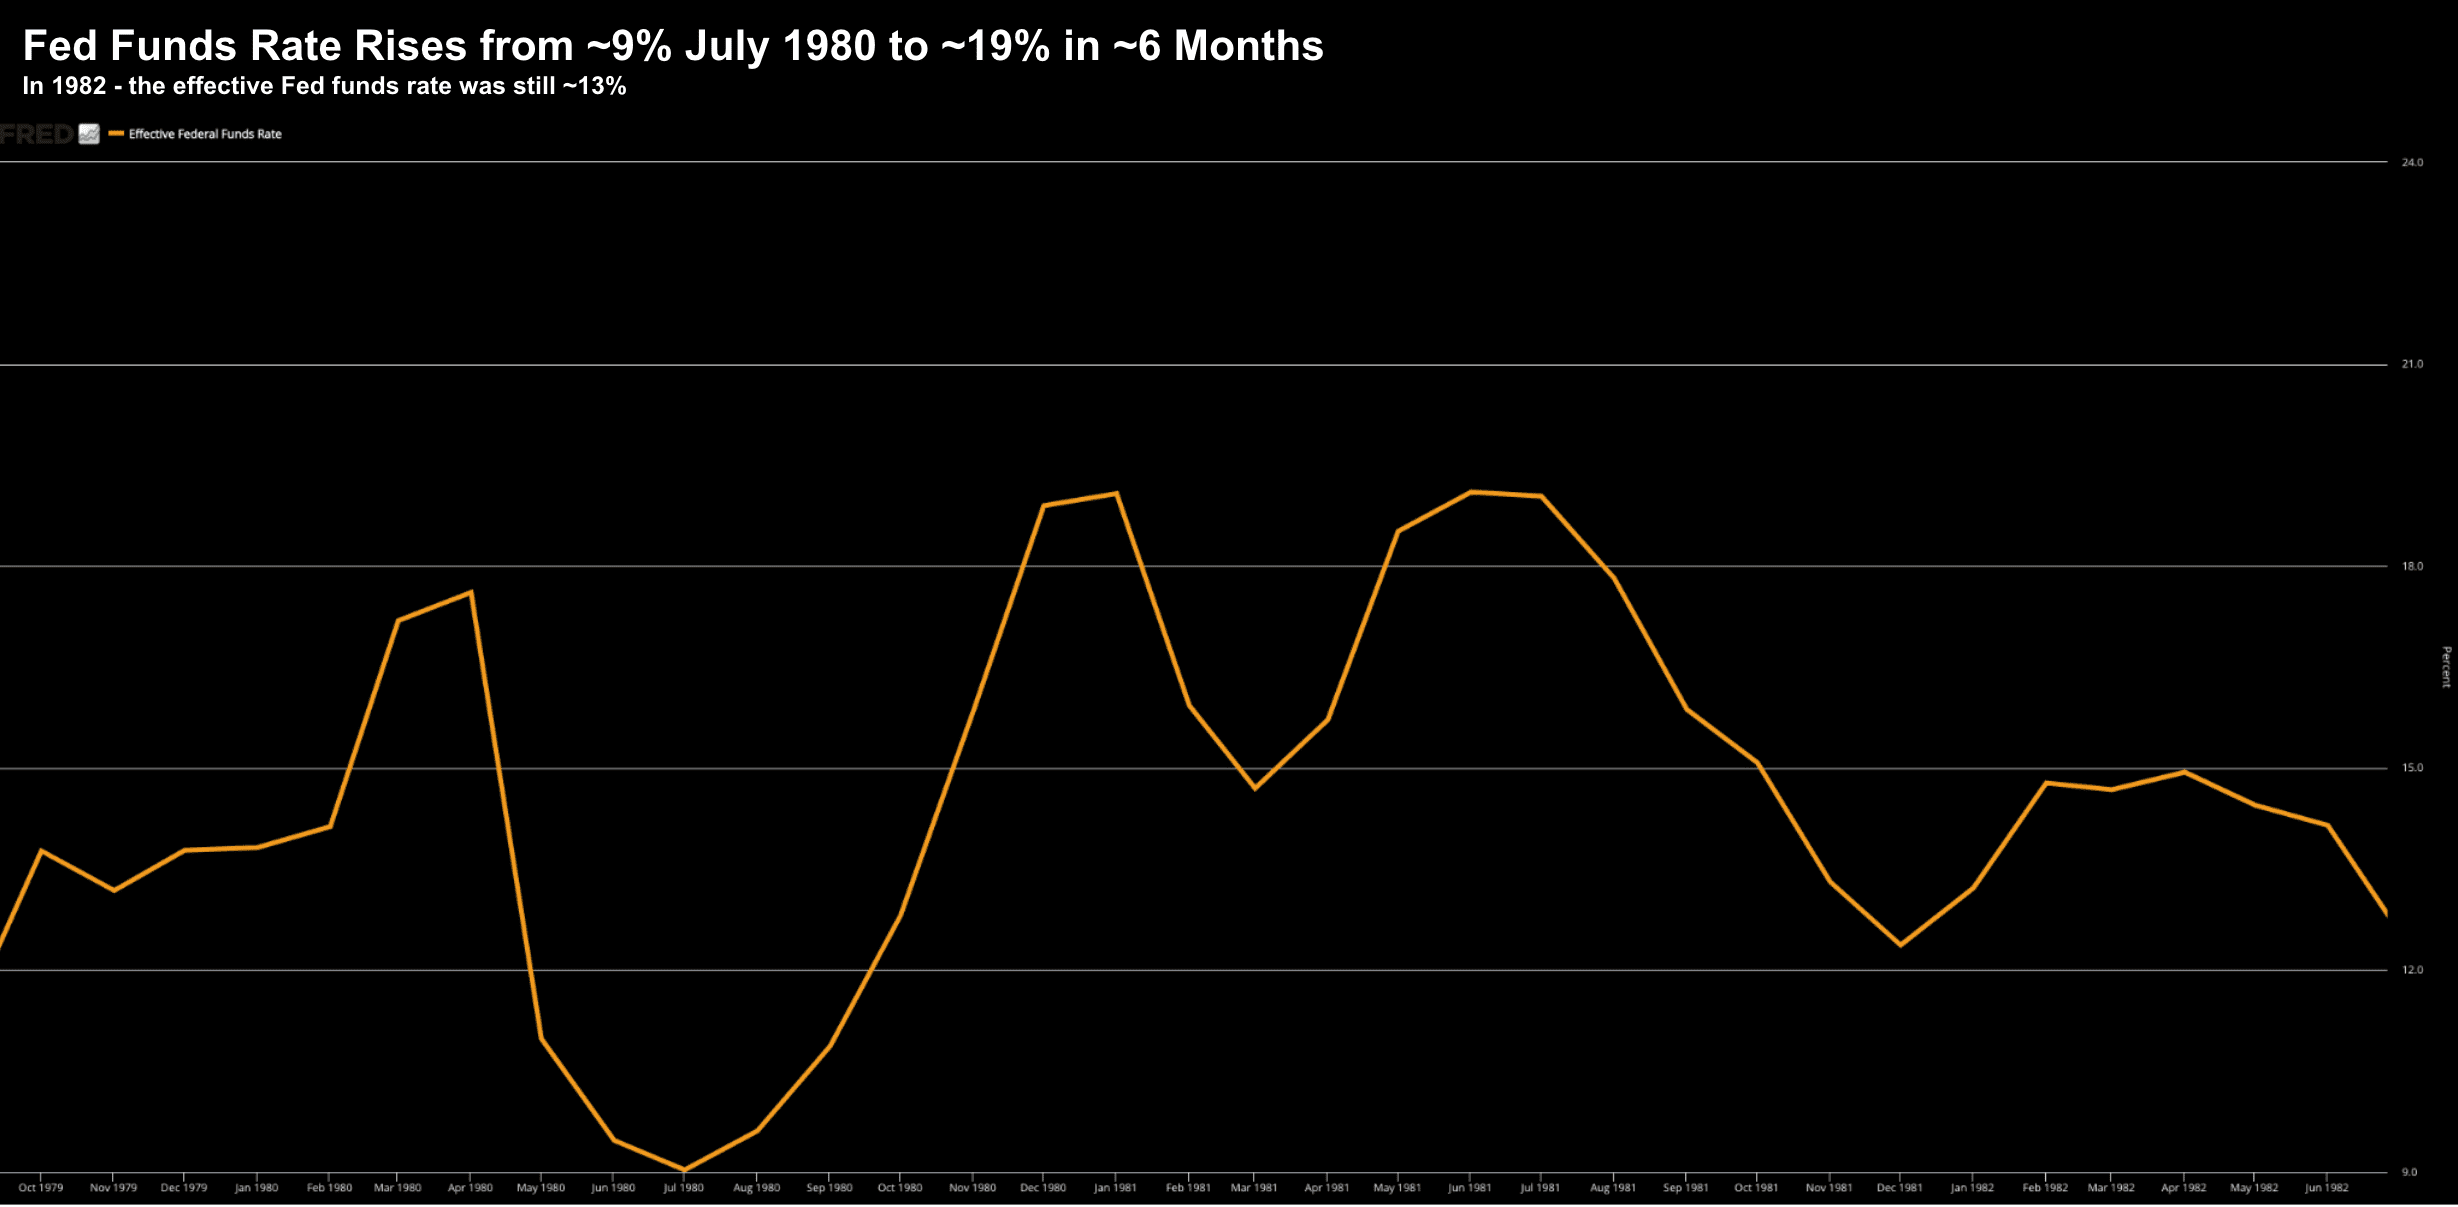
Rates "bottomed" briefly in July around 9%… soaring to above 19% just 6 months later.
That said, two years later they were still trading above 13% as Paul Volcker used his only weapon to tame unwanted inflation.
In summary, today"s negative real rate of return of over 5% is as bad as we have seen in 70+ years (perhaps a lot more?)
Expect this to continue for at least 12 months…
And whilst inflation should come down to some extent next year (more on this below) – it"s very likely the real rate of return will remain deeply negative.
But more than this, I think we should expect sharply higher rates beyond 2022.
Now on the subject of inflationary pressure – let"s now turn to what I think is a worrying (early) theme with earnings.
Inflation: A Worrying Theme
As part of my most recent post… I said I was looking forward to NIKE"s latest report.
Specifically I said "whilst I"m sure revenue will show double-digit growth… I"m most interested to hear their commentary on their challenges with supply-chain (and any impact to Q4 (holiday) sales)"
Sure enough – NIKE delivered double-digit growth.
That"s expected – they are a well run company with a strong (cult-like) brand. Consumers like wearing their logo (and will pay to do that!)
However, post earnings their stock was slammed 6% on not only their (poor) earnings results and but more so their forward outlook.
"The sportswear giant has warned that it has been hit by supply chain problems — caused globally by the Covid-19 pandemic — that will impact production and delivery of its goods around the world through next spring.
Nike is grappling with issues ranging from shipping container shortages to a dearth of workers, the company said Thursday, adding that it is also facing manufacturing problems due to local lockdowns at its factories in Vietnam and Indonesia.
We are not immune to the global supply chain headwinds that are challenging the [manufacturing] and movement of product around the world," Chief Financial Officer Matthew Friend said on an earnings call. "We expect all geographies to be impacted by these factors."
The issues forced Nike to cut its full-year sales outlook on Thursday, despite Friend saying that "consumer demand has never been higher."
As I said, holiday season sales are not simply delayed for NIKE… they are denied.
For what it"s worth, I don"t own NIKE and nor am I looking to buy it and any dip. The valuation for me is far too high.
Let"s now turn to Costco… and what they are seeing with supply-chain, inflation and wage pressure.
Here"s progressivegrocer.com
Despite all of this good news, the retailer said it is putting limits "on key items like bath tissues, roll towels, Kirkland Signature water, [and] high-demand cleaning-related SKUs related to the uptick in Delta-related demand," said Richard Galanti, CFO of Costco, during an earnings call.
"[W]e"re ordering as much as we can and getting it in earlier, and I think, as evidenced by the most recent sales results, we"re doing okay with this," Galanti said.
Costco said it is experiencing port delays, higher labor and freight costs, and shortages on everything from shipping containers, trucks, and drivers to various components, raw materials, and ingredients, causing most of its general items to sell out within two weeks.
Galanti also said fresh food inflation "is up in the mid to high single digits, with meat leading the way, up high single to low double digits due to feed, labor and transportation costs."
"It"s a lot of fun right now," Galanti joked.
Now if someone like Costco or Nike are not able to shield the consumer from sharply higher costs… who can?
As I said the other day when talking to FedEx raising its shipping charges 5.9% (on average) from January 2022 – this is a worrying trend we will need to watch closely.
Let"s see if things like supply chain constraints, growing wage pressures and inflation continue – as we hear from more US companies over the next few weeks.
So What Do You Do?
Here"s today"s exam question:
Faced with a negative return of at least 5% over the next 12 months on your cash – what are you going to do?
For example:
- Do you increase your exposure to stocks at record high valuations – hoping they don"t correct 20%+ on any Fed tightening (or other event)?
- Do you buy gold – which competes with higher bond yields as a safe-haven asset?
- Do you buy (ultra speculative) crypto – and hope governments around the world don"t follow China"s lead?
- Do you buy property at stretched valuations – known to perform poorly in a rising rate environment? or
- Do you buy bonds at a negative real rate of return (where bond prices fall as yields rise)?
Choose your poison folks… but choose carefully.
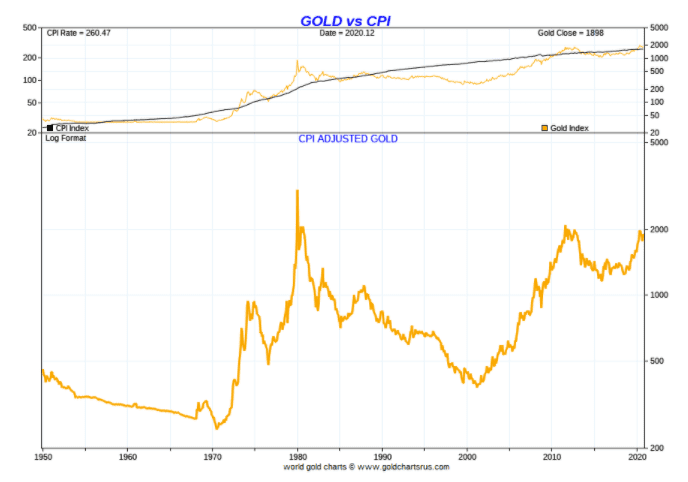
For me, we can rule out both gold and bonds.
For example, with the Fed set to raise rates late next year (and perhaps multiple times throughout 2023) – gold is likely to struggle against bond yields (and the dollar) as investors bet on inflation risks coming down (vs the inflation risk the time last year).
What"s more, if we inflation adjust the price of gold… it"s already trading near record highs and certainly "no bargain".
Crypto might be a good bet but I would keep that bet small (e.g., no more than 5% of your portfolio). To be clear, I think crypto is here to stay in some form. However, the more successful it is, the bigger threat it becomes to both governments and central banks (again, look at what we saw from China this year). And that doesn"t sit well for me.
With respect to property – higher-interest rates are going to put pressure on (already extended) house prices – with annualized returns (at best) in the low single digits.
Which brings me to stocks… and the "TRINA" principle.
From mine, over the long-term, stocks are your best bet over every other market.
However, I can"t emphasize enough how important it is to buy at a reasonable level.
To illustrate my point, consider the S&P 500 Compounded Annual Growth Returns (CAGR) over the past few decades:
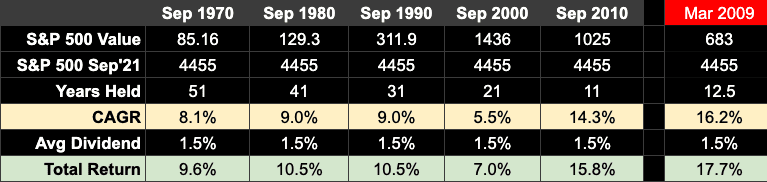
To avoid cherry picking dates (as many do) – here we see CAGR from 11 years (2010) through to 51 years (1970).
But there is a standout with this table… and that"s if you bought the Index in September 2000.
That proved to be a poor entry.
For example, buying the market just after the peak of the dot.com bubble would have only realized a CAGR of 5.5% (plus any dividend) over 21 years.
Terrible!!
Heck, even property would go close to beating an average 5.5% capital return (and that"s saying something!)
However, if you bought the S&P 500 Sept 2010 (i.e., which was well after the market bottomed) – your CAGR is 14.3% plus dividends.
As an aside – if you picked the market bottom in March 2009 (near impossible to do) – and held through to today – the S&P 500 CAGR would be 16.2% plus any dividend.
Putting it All Together…
My concern (today) is buying the Index at the current levels is more likely to lead to a CAGR of closer to 5-6% than say the average (long-term) return of above 9-10%.
To be clear, I fully expect the market to possible rally a little further yet.
And I am not bearish.
That said, should we see the market meaningfully correct (e.g. 10-20%) – your probabilities of stronger long-term returns are far greater.
Again, I like quality stocks... but not at these prices.
For now, I will continue to keep a close eye on the tape, inflationary risks and what US companies have to see about Q4 (and 2022) guidance.
I think each of these could be catalysts for the Fed moving sooner in 2022 on any tightening than what"s priced in.
And that might be your long-term "opportunity window".