S&P 500 +10.1% for Q1 – Can it Continue?
- A banner quarter – but can it continue?
- Only 5 times since 1926 has the S&P 500 returned more than 40%
- China horribly underperforms… but now looking cheap
If you asked me at the end of December whether I thought the S&P 500 would be up ~10% at the end of the first quarter this year – I would have said "unlikely"
And yet here we are.
With the promise of (coming) interest rate cuts and continued strong economic growth (implying growth in earnings) – US equities have arguably exceeded most analysts full year targets.
For example, below are 18 forecasts from early January – when the S&P 500 traded ~4700
| Company | S&P 500 2024 F"Cast |
|---|---|
| BCA Research | 3300 |
| Cantor Fitzgerald | 4400 |
| Scotia Bank | 4425 |
| Wells Fargo | 4700 |
| Raymond James | 4650 |
| JP Morgan | 4200 |
| Morgan Stanley | 4500 |
| Stiffel | 4650 |
| Ned Davis | 4900 |
| BoA | 5000 |
| RBC | 5000 |
| Federated Hermes | 5000 |
| Goldman Sachs | 5100 |
| Deutsche Bank | 5100 |
| BMO | 5100 |
| Fundstrat | 5200 |
| Oppenheimer | 5200 |
| Yardeni | 5400 |
Ed Yardeni at 5400 remains the only forecast yet to be met (with the S&P 500 closing the quarter at 5254).
The median (or middle value) of these 18 forecasts is 4950. The average value is 4768
Naturally, this has most analysts ratcheting up their forecasts.
As an aside, that"s the thing about forecasts (they"re most useless). See this post "The Folly of Forecasting"
Today"s exam question is can the velocity in equities continue?
If I were to guess – I would argue no.
Then again, I didn"t expect us to be up 10% in the first quarter either – so what do I know?
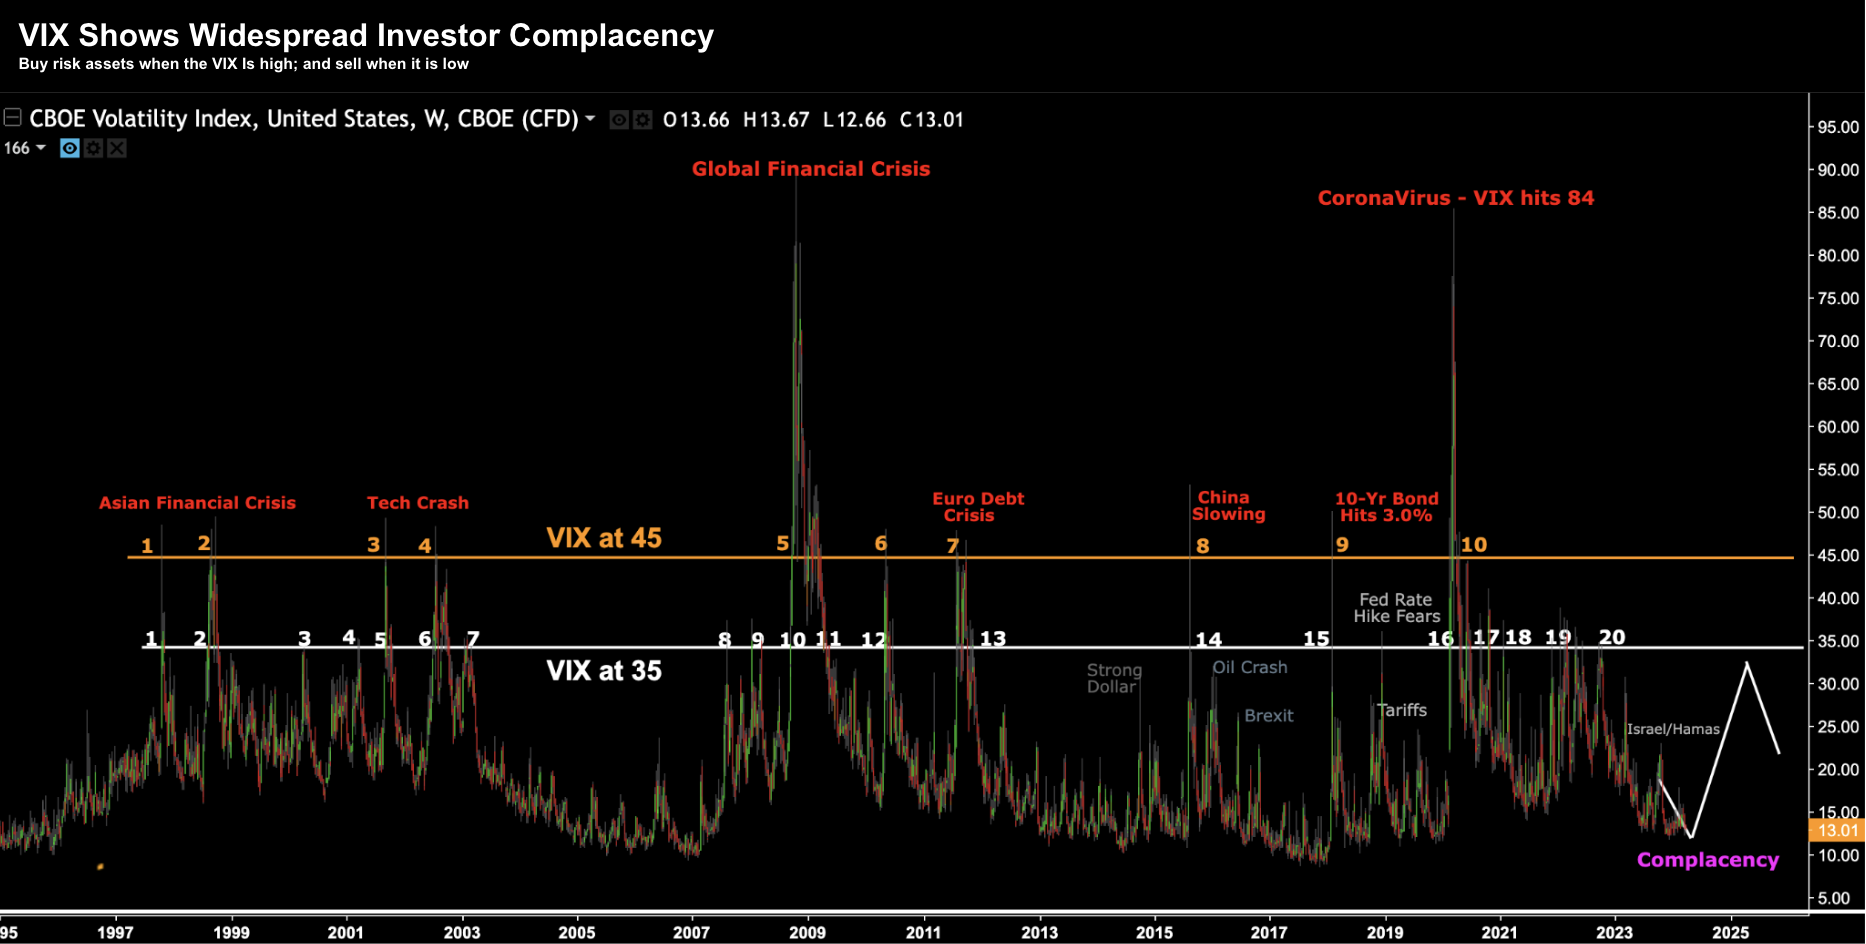
Complacency…
If I was to use one word to describe investor sentiment today – it would be complacent.
If nothing else, the VIX is a good representation, trading around 13 at the time of writing.
Below is a long-term chart for the (poorly named) "fear index" I"ve often shared over the years:
Regardless, the market is being driven higher by a number of factors… which has the bears capitulating.
But perhaps the primary driver is the assumption the U.S. economy will avoid a recession.
And any "soft landing" will see a meaningful cut in rates (e.g. 75 basis points) by year"s end.
Strong growth with rate cuts… what"s not to like?
However, the question I asked yesterday is whether those assumptions are reasonable?
I agree that the outlook for U.S. growth appears modest however it"s not void of risk (contrary to a complacent VIX)
And if I were to bet, I think the probability of a downside surprise(s) (vs an upside shock) is greater (especially given the recent surge in valuations).
For example, three rate cuts are now priced in.
But what would cause Powell to cut? And it is possible market participants could be disappointed?
For example, should the U.S. fall into recession or face some kind of credit event – yes – then rates will need to be cut. However, that will see earnings revised lower.
But in the absence of those events – rates could remain higher for longer (i.e., a downside risk).
What"s more, 2024 is an election year. Therefore, would the Fed be motivated to meaningfully cut rates into an election?
If so, could that be seen as potentially influencing the result?
For clarity, it is reasonable to assume that interest rates will fall modestly over the next two to three years, given the existing disinflationary trends.
However, we"re not going back to "zero rates."
If anything, the effective federal funds rate is likely to sit somewhere between 2.0% and 4.0% over the coming years.
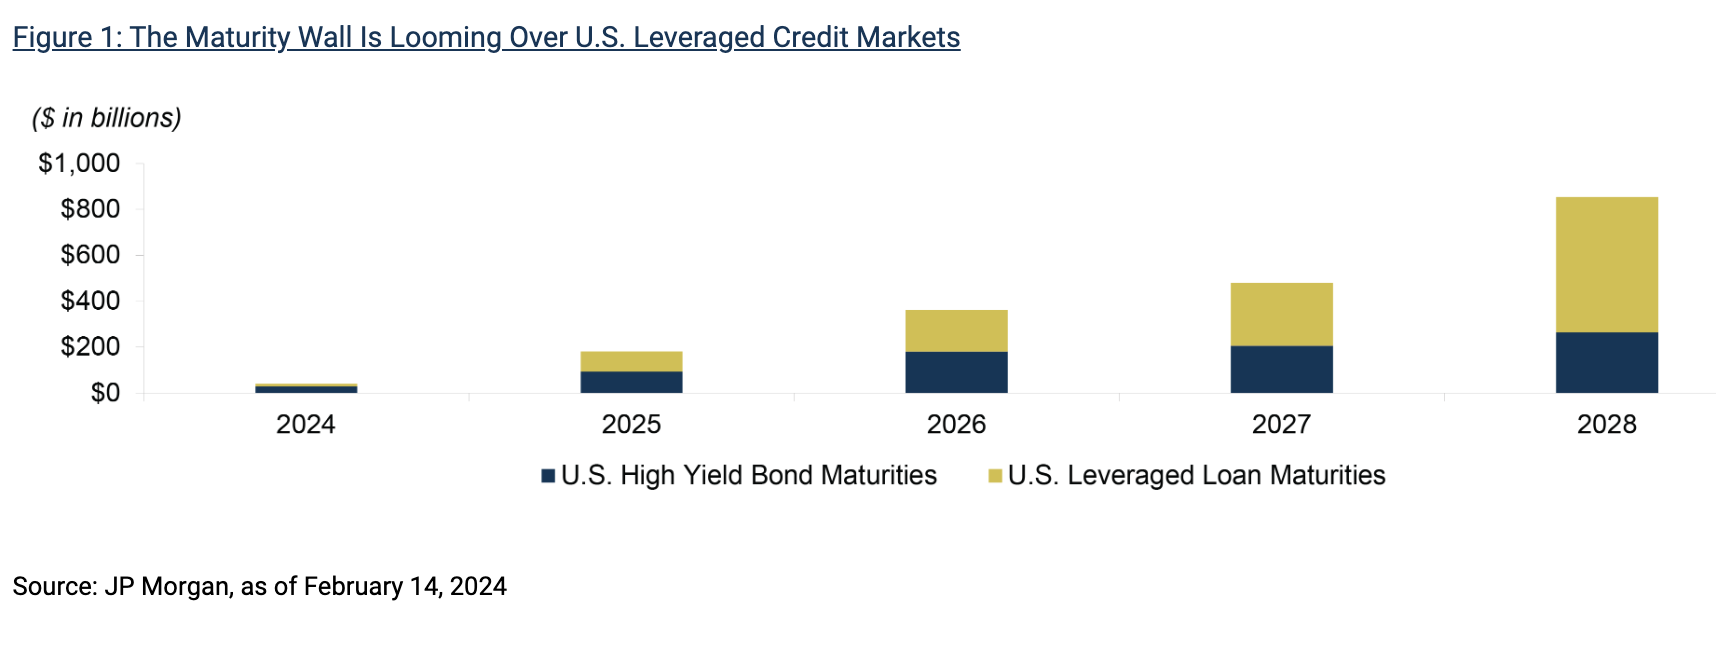
Therefore, one should ask what risks this potentially represents in credit markets.
As Oaktree highlight in their quarterly summary – the "maturity wall" looms large for many companies who remain excessively leveraged:
A Sustainable Rally?
But let"s come back to the question raised in my preface – is this pace sustainable?
In short, my guess is no.
For example, consider the annualized returns for each of the major indices after Q1:
| Index | Annualized Return |
|---|---|
| S&P 500 | 40.6% |
| Nasdaq 100 | 34.7% |
| S&P TSX 60 | 22.3% |
| Euro Stoxx 50 | 50.1% |
| FTSE 100 | 12.0% |
| CAC 40 | 35.4% |
| DAX | 41.7% |
| Nikkei 225 | 80.1% |
| Hang Seng | -11.9% |
| CSI 300 | 10.5% |
| S&P ASX 200 | 16.1% |
Let"s apply some back-of-the-envelope math:
First, let"s assume the S&P 500 were to sustain this pace and deliver a 40% return.
This would see the Index finish at a level of 6,676
Now let"s also assume companies are able to grow their earnings by 11-12% (given economic growth prospects remain sound) to finish at $245 per share.
That would represent a forward PE ratio in the realm of 27x (or higher should earnings disappoint)
6,676 / $245 = 27.3x
Possible? Sure.
Probable? No.
For example, consider the annual returns for the S&P 500 from 1926 through to 2023:
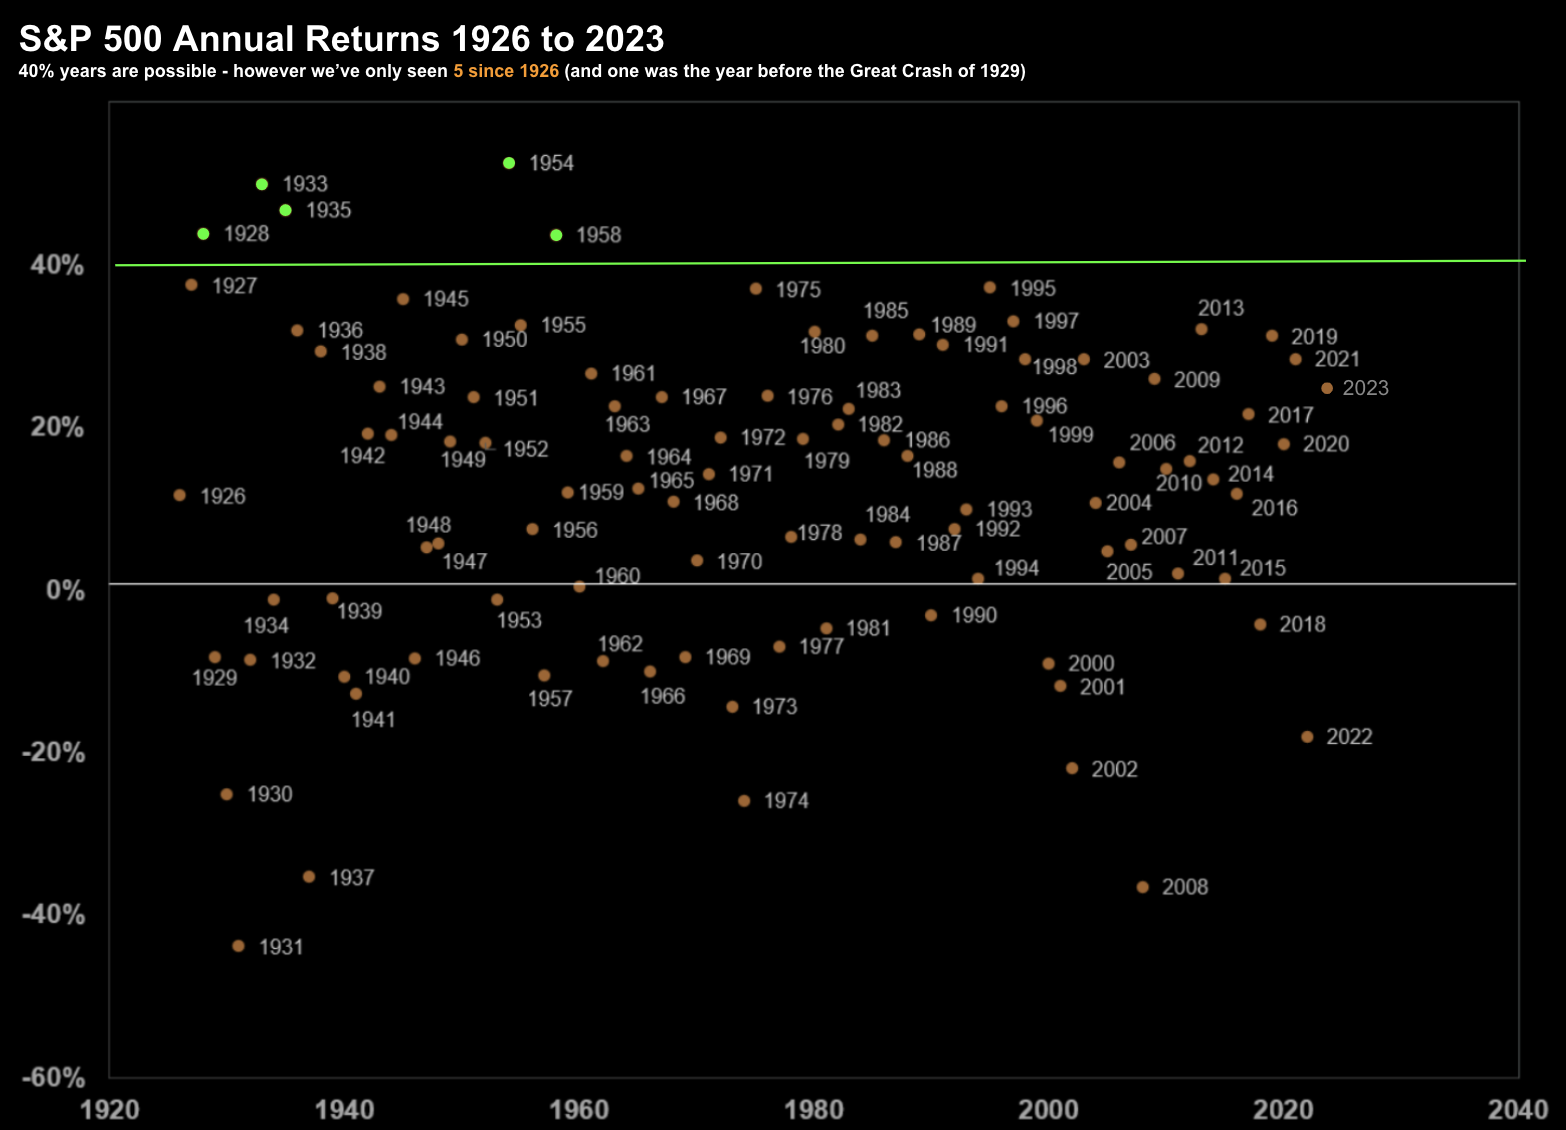
A couple of things standout on this chart:
- The number of positive return years far outweigh those which are negative (73% positive years vs 27% negative)
- There have only been 5 years since 1926 which posted returns above 40% (highlighted in green) – with the last year to do it being 1958
Based on this, you might say there is an approx. 5% chance the current pace is maintained (i.e. 5 times over 98 years where 40% annualized gains were made).
Probabilities (if nothing else) suggests the direction from here is likely either sideways or more likely a correction.
The problem of course is forecasting when the correction will occur is impossible.
It could be next week, next month or 6 months from now? I don"t pretend to guess (and why I have no short positions and/or puts)
However, when (not if) it comes, that will be the time to shop around for quality.
Putting it All Together
Before I close, take another look at the annualized returns for global indices.
I call your attention to the Hang Seng at -11.9%
Chinese equities are perhaps the most disliked (and under-owned) stocks today.
And for many good reasons. Their economy is in trouble and there"s no easy "stimulus" fix (which has given the impression of working the past few years).
That said, their market is trading at a record-low 8.2x fwd PE.
That"s cheap by any measure.
And considerably cheaper than the S&P 500 at near 21.4x (assuming 12% EPS YoY growth at $245 per share)
And whilst sentiment towards all Chinese stocks could not be worse given the broader macro concerns – I have noticed the fundamentals of many quality companies improving.
For example, net cash positions at the Top 15 Chinese companies in the MSCI Emerging Markets Index have risen from negative $19 billion in 2019 to $113 billion in 2023.
These names include (not limited to) Tencent Holdings, Alibaba, PDD Holdings and China Construction.
However, investors are not looking at this, instead focusing on the broader macro impediments (which are not insignificant).
For those with a longer-term (5+ year) time horizon – the risk/reward for quality (i.e., low debt / strong free cash flow) companies is now looking attractive.
It"s harder to make the same case for some U.S. stocks at current valuations.