How to Identify High-Quality Stocks: A Simple Framework for Quality, Value, and ROIC
Words: 3,720 Time: 15 Minutes
- The "15/15 Rule": My preferred quality metrics and why they matter
- Using EV/EBIT and P/FCF as a superior way to determine intrinsic value
- Navigating high-valuation markets by focusing on lasting unit economics
"When you have eliminated the impossible, whatever remains, however improbable, must be the truth"
—Sir Arthur Conan Doyle
A fundamental principle of successful long-term compounding is "Inverting Your Investing Mindset." Instead of asking how to win, we must first ask how to avoid losing. As the late Charlie Munger often noted, the goal should be to find where one might "die" and simply never go there.
Investing is often framed as a complex mathematical riddle, but the arithmetic is actually quite basic: addition, subtraction, division, and multiplication. The real difficulty lies in mastering your own character. Success in the markets is far more about EQ (Emotional Quotient) than IQ. It is a test of temperament—your ability to remain rational when greed or fear dictates the actions of others (read this post on investor psychology).
This framework is designed to simplify the selection process, helping you avoid the "cash furnaces" that incinerate capital and instead focus on the durable machines that build it. Specifically, we will explore:
- The 15/15 Rule: How to identify elite, high-quality businesses; and
- The Value Pillars: Two methods for determining worth that go beyond simplistic price-to-earnings multiples.
To establish a rigorous "Circle of Competence," I calculate 26 distinct metrics for every S&P 500 company on a quarterly and annual basis. These metrics are categorized into three pillars:
- Valuation (7 metrics);
- Growth, Profitability, and Effectiveness (10 metrics); and
- Capital Structure, Interest Coverage, and Liquidity (9 metrics)
By analyzing these factors on a rolling 10-year basis, we can strip away the noise of quarterly "earnings beats" and reveal the true structural health of a business. Here is how to filter for excellence.
The Search for Quality: Filtering the Noise
When faced with a matrix of 13,000 data points, complexity is the enemy. We need a system that highlights businesses with a consistent record of strong free cash flow, high profit margins, and disciplined capital structures with minimal debt.
While the "Magnificent 7" dominate the headlines, there are several high-quality enterprises that exhibit world-class metrics but often fly under the radar of the average retail investor:
- KLA Corporation (KLAC)
- NVR Inc (NVR)
- Applied Materials (AMAT)
- Lennox International (LII)
- MSCI (MSCI)
- Ulta Beauty (ULTA)
- Paycom (PAYC)
- Arista Networks (ANET)
In identifying these, I prioritize what I call the 15/15 Rule. This rule acts as a quality filter, requiring a company to maintain a Return on Equity (ROE) of 15% or higher and a Return on Invested Capital (ROIC) of 15% or higher. These numbers ensure the company isn"t just growing, but is compounding shareholder wealth efficiently. Specifically, the names above often exhibit:
- 10-year Free Cash Flow (FCF) Compound Annual Growth Rates (CAGR) above 15%; and
- 10-year average Return on Invested Capital (ROIC) above 30%.
These are elite figures. To provide context, within the S&P 500:
- Only 87 of 500 (~17%) satisfy an FCF CAGR of 15%+ over 10 years; and
- Only 52 of 500 (~10%) have achieved an average ROIC of 30%+ over that period.
When a business produces consistent cash flow and high returns on capital, the share price eventually reflects that reality:
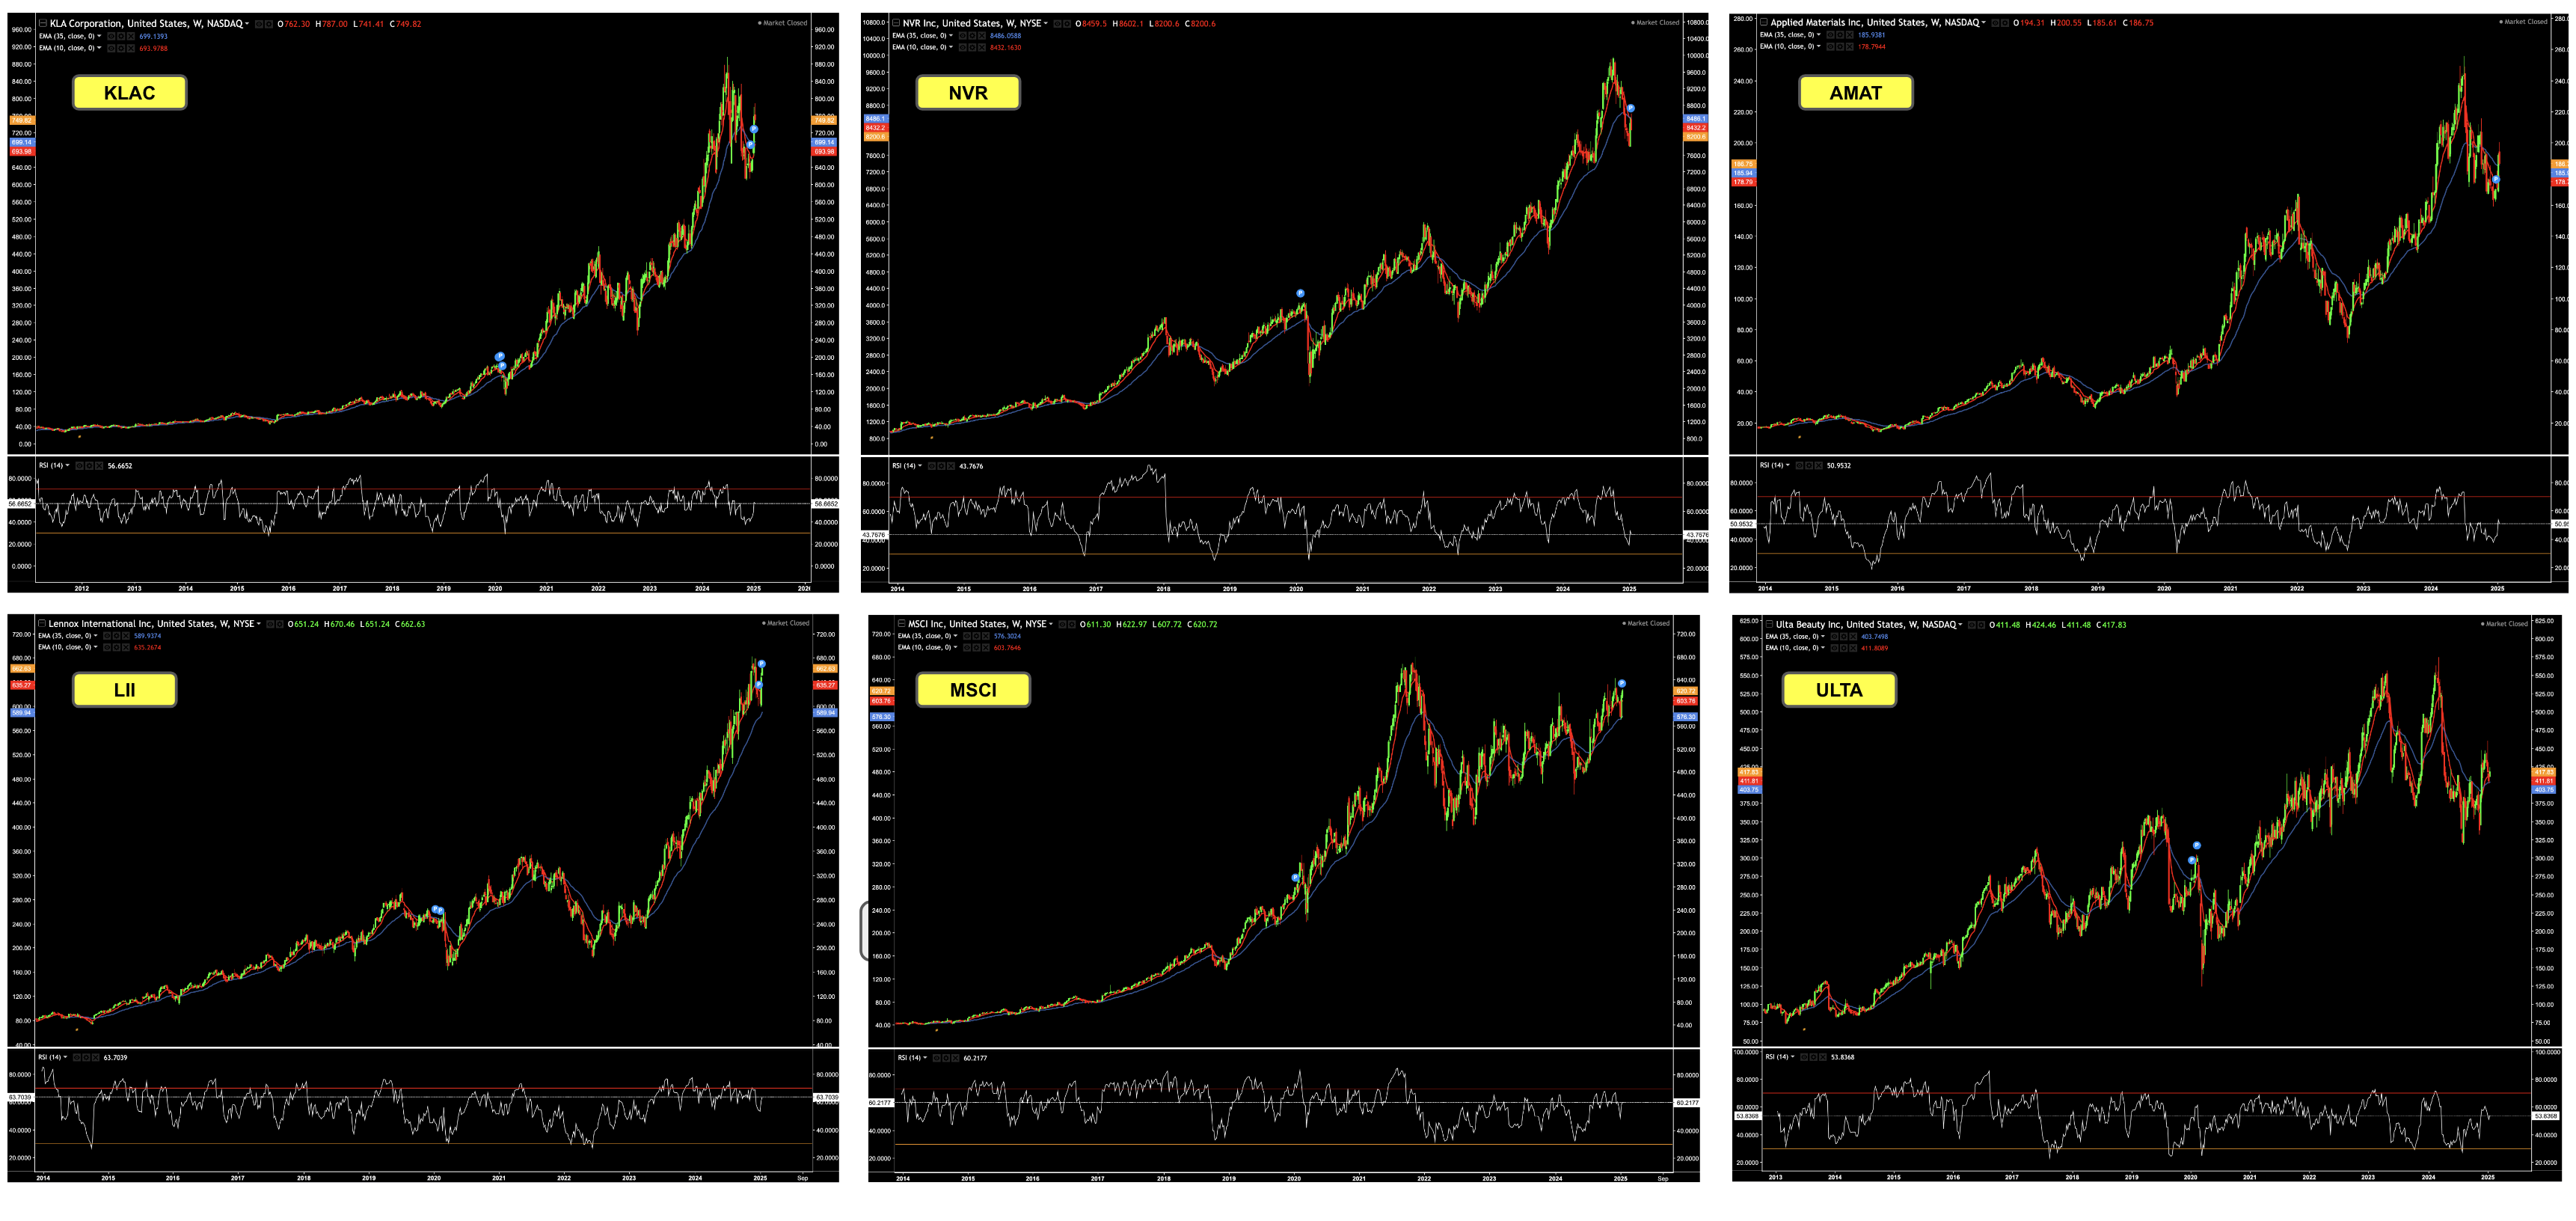
There are two key takeaways here:
- Significant capital appreciation is available far beyond the biggest tech names; and
- Consistent FCF and ROIC, paired with solid profit margins, act as an immutable law for share price growth over the long term.
However, we must also apply Inversion to these findings to eliminate blind spots. Ask yourself:
Question: What if the current high ROIC is a result of a temporary cyclical peak rather than a durable moat? Is this company simply over-earning today because of a supply chain anomaly or a temporary lack of competition?
Focusing on the top 10% to 20% of companies allows us to reduce the odds of a "costly mistake." Many investors are lured into "cash furnaces" by social media hype or CNBC pundits. While some high-risk bets do eventually succeed, the probability of failure is significantly higher. If you choose to speculate on these, manage your Opportunity Cost—perhaps allocate 0.50% of your capital rather than 5.0%. If it fails, your portfolio remains intact. If it wins, the upside remains meaningful.
Ultimately, quality investing is about identifying sustainable competitive advantages. You should be able to articulate three to four core strengths and weaknesses for every business you own. If you find yourself adding layers of complexity to justify an investment (e.g., "it will disrupt X if Y happens in Z years"), you are clearing 7-foot hurdles instead of stepping over 1-foot bars.
The Meaning of Value
Finding a quality business is the first step. The second is determining a "Fair Price." Even a world-class company can be a poor investment if the entry price is too high. To evaluate this, we can look at the 55/30/25 Model as a benchmark for operational efficiency: we want to see Gross Margins near 55%, SG&A around 30%, and EBITDA margins at 25%. If a company hits these, it has significant pricing power.
While many use Discounted Cash Flow (DCF) models, these rely on too many assumptions (growth rates, terminal values, and discount rates projected over 10 years). Forecasting technology or economic conditions a decade out is nearly impossible. For a more "Reason-Respecting" approach, I prefer two metrics:
- EV/EBIT (Enterprise Value / Earnings Before Interest and Taxes); and
- P/FCF (Price to Free Cash Flow)
#1. EV/EBIT: The Acquirer"s Multiple
I prefer EV/EBIT because it incorporates the balance sheet. Enterprise Value (EV) includes both cash and debt, giving a much clearer picture of what the business actually costs compared to simple market capitalization.
EBIT allows us to see the operational strength before interest and taxes. As a conservative investor, I seek companies with low or no debt, meaning interest expenses should be minimal. Additionally, if a company has an unusually low tax rate compared to its peers without a valid explanation, it serves as a red flag for potential accounting gimmickry.
Consider KLAC. Its current EV/EBIT is roughly 26.5x. Historically, its average is closer to 16x. While it is a high-quality semiconductor name, the current valuation reflects significant "AI hype." To determine if 26.5x is "fair," we must ask:
Question #2: If the market is pricing this at a significant premium to its 5-year average, what specific growth catalyst must occur just to break even, and how likely is that catalyst to fail?
In general, fair value ranges for EV/EBIT vary by sector:
- Tech/Software: 20x to 50x
- Consumer Discretionary: 15x to 30x
- Industrials: 10x to 20x
- Utilities: 8x to 15x
KLAC"s current 26x multiple is 60% higher than its 5-year average. While the quality is there, the value is currently missing.
#2. P/FCF: The Cash Flow Yardstick
Price to Free Cash Flow (P/FCF) tells us exactly what we are paying for every dollar of cash the business generates for its owners. Free Cash Flow is simply Operating Cash Flow minus Capital Expenditures (the money needed to keep the lights on).
Using the KLAC example again, its P/FCF is 36.8x, which translates to an FCF Yield of 2.7% (calculated by inverting the multiple: 1 / 36.8). In a high-quality growth business, I generally look for multiples of 15x to 17x, which equates to a much healthier 6% to 7% yield.
Paying 36.8x means you are banking on massive, uninterrupted future growth. If that growth slows even slightly, the "re-rating" of the stock price to a lower multiple can be devastating to your capital.
Determining the Margin of Safety
The math is straightforward, but the judgement is where the profit is made. Deciding that "17x" is a fair multiple for a tech company but "13x" is fair for a cyclical industrial company requires an understanding of the business"s durability. To stop "Availability-Misweighing"—the tendency to rely on the most recent or flashy information—we use checklists and historical data to stay grounded.
High ROIC is our best friend, as it shows how efficiently a company uses the funds invested in its core business. As Warren Buffett famously said:
"The primary test of managerial economic performance is the achievement of a high earnings rate on equity capital employed (without undue leverage, accounting gimmickry, etc.) and not the achievement of consistent gains in earnings per share".
EPS can be manipulated through share buybacks or accounting tricks. ROIC and ROE (the 15/15 Rule components) are much harder to fake.
Capital Allocation and Defense
Knowing we cannot predict the future, sufficient diversification is your best defense. I generally maintain a portfolio of 10 to 20 stocks. Fewer than 10 creates excessive concentration risk; more than 30 effectively turns your portfolio into a high-fee index fund. If you find yourself wanting to own 50 stocks, you are likely better off simply buying an S&P 500 Index fund.
My average time horizon is four to five years. I often look for quality companies that are "out of favor"—perhaps trading at 52-week lows due to temporary market pessimism. This is like buying a winter coat in the middle of summer; it"s on sale because nobody wants it *right now*, even though its utility remains unchanged.
Question #3: What specific event would have to occur for this "cash machine" to become a "cash furnace" in the next 24 months? If the answer is "a 10% drop in consumer spending," the moat may be shallower than you think.
Putting it All Together
In an age of instant news and market noise, your focus must remain on lasting value. You don"t need a Bloomberg terminal to do this; services like WiseSheets API can pull the raw data for a nominal fee, allowing you to script your own quality and valuation summaries.
By filtering for the 15/15 Rule and then narrowing the field based on Net Profit Margins and Valuation (EV/EBIT and P/FCF), you focus your energy on the top 20% of the market. This process provides downside protection. Rarely do stocks with massive cash generation and low debt "blow up" entirely. The primary risk is simply what you pay for them.
Develop your system. Stick to your Circle of Competence. Step over the 1-foot bars. The compounding will take care of the rest.