S&P 500: Late-Cycle Rally or Start of a New Bull Market?
- Rapid rally from overbought conditions limits upside
- Valuations high, liquidity tightening, risks rising
- Narrow leadership signals fragile market structure
Despite the ongoing war in Iran, equities are behaving as if little has changed.
The S&P 500 has gained just over 10% in 12 trading days—a surge that has occurred only 23 times since 1962.
Measured from the intra-day low to today"s intra-day high, the rally is closer to 11.6%.
Below is the daily chart:

The speed of the move is notable.
Based on the Relative Strength Index (RSI), the market has gone from oversold to overbought in a matter of days—a classic V-shaped recovery.
Historically, these moves tend to produce only modest short-term follow-through:
- ~1% median return after one week
- ~2% after one month
But over longer horizons, outcomes improve materially:
- ~12% after six months
- ~20% after one year
- ~35% after two years
At first glance, that seems encouraging. However, there is a critical caveat.
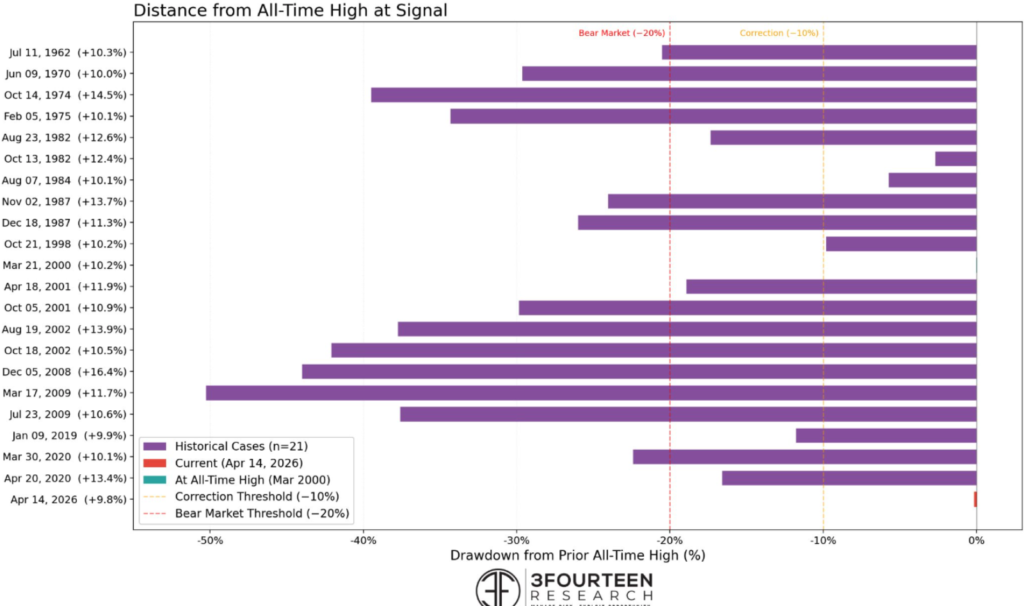
Most prior instances of these rapid 10%+ rallies did not begin with the S&P 500 near a 52-week high.
They typically emerged from deeply depressed levels—during recovery phases when markets were climbing out of major drawdowns.

The contrast is stark:
- 1982 and 2020: Early-cycle recoveries → strong forward returns
- 2000: Late-cycle peak → severe drawdown
Investors buying the 2000 signal lost more than half their capital over the next two years (I was one of them!) — and waited until 2007 to break even, only to endure another ~50% collapse in 2008.
As Warren Pies from 3Fourteen Research shows below – these rallies are far more common at the end of bear markets than near the top of bull markets
Which leads to the key point:
The signal itself is not the edge — the starting conditions are.
In other words, it"s what you pay that matters most when it comes to your ultimate returns.
A 10% rally from oversold, undervalued conditions (1982, 2009, 2020) is structurally different from a 10% rally near highs with elevated valuations (2000).
Today looks much closer to the latter.
Valuation Risks Remain Elevated
By almost any measure, the market remains expensive.
The S&P 500 is trading at ~21.5x forward earnings, while the 10-year Treasury yield sits around 4.3%—a combination not seen at any point during the post-GFC bull market.
- Earnings yield ≈ 4.7%
- Bond yield ≈ 4.3%
- Excess yield ≈ 0.4%
Using Robert Shiller"s excess CAPE yield framework:

With this ratio near historical lows, investors have very little margin for error.
Historically, when this measure turns negative (e.g., 1929, 2000), subsequent long-term returns have been poor.
Now, if bond yields rise toward 4.75–5.0%—a plausible outcome given persistent inflation pressures and elevated oil prices—the excess CAPE yield would likely turn negative again.
The implication for investors is straightforward:
Starting valuations remain a powerful determinant of longer-term returns—and today"s starting point is demanding.
Therefore, the long-term risk reward is not in investor"s favour at current levels.
Liquidity Assumptions
Liquidity is the market"s oxygen. Reduce it and the patient suffers.
Today, the market is behaving as if liquidity is abundant—however the backdrop suggests caution:
- Real rates remain restrictive (due to inflationary risks)
- Treasury issuance is rising (draining liquidity)
- Central bank balance sheets are no longer expanding meaningfully (QE)
This is arguably more important than the impact from the war – as it creates a divergence.
Strong price action is occurring alongside tightening financial conditions.
I shared this chart last week:
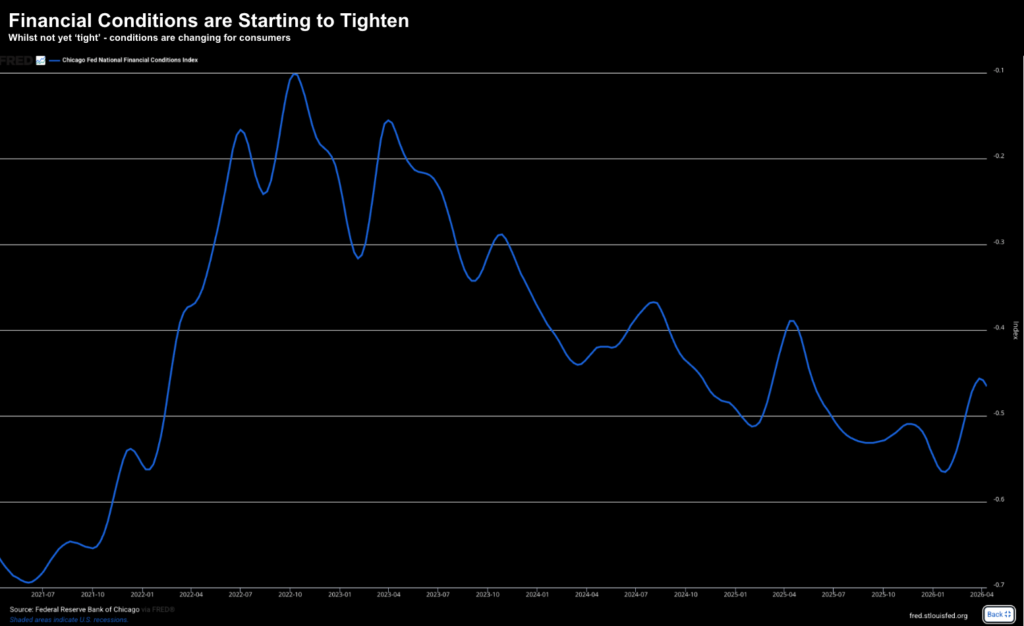
Historically, that combination is more typical of late-cycle environments than the beginning of a durable bull market.
Earnings Optimism — Narrow and Softening
The bullish case for higher prices rests on ~12–13% expected earnings growth.
But beneath the surface, the picture is less convincing.
While the "Magnificent 7" may deliver strong (double digit) growth, the remaining 493 companies are far less robust.
Recent data shows:
- Earnings estimates have been revised lower since the war began
- More companies are issuing negative guidance
- Growth expectations remain concentrated in a handful of names (i.e., the Mag 7)
Below is a chart from Bloomberg"s Earnings Estimates service – which shows that forecasts for S&P 500 first-quarter earnings are easing.
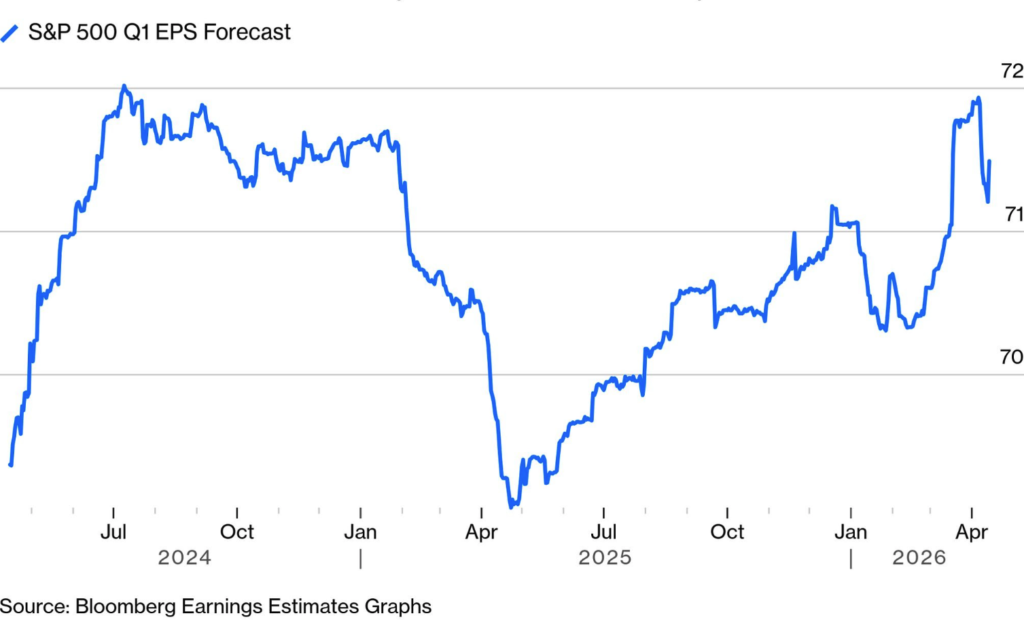
The risk is the market is pricing broad-based earnings strength that may not materialize.
For example, if we examine the rally of the past two weeks – it has been:
- Highly concentrated;
- Driven by large-cap leadership; and
- Less supported by broad participation
Measures such as equal-weight vs cap-weight performance, or the percentage of stocks above key moving averages, suggest that breadth remains uneven.
That matters.
Narrow rallies are inherently more fragile than broad-based ones.
What Explains the Rally?
As John Authers from Bloomberg notes in his latest missive — investor behaviour has been shaped by recent experience (i.e., "recency bias")—particularly the sharp reversal following last year"s tariff scare.
Investors who hesitated then were punished.
This time, they were quicker to buy. From Authers:
"This rally probably wouldn"t have unfolded as it did without the experience of Liberation Day last year, when stocks sold much harder than they did last month and then started a big rally as soon as the president announced his first "TACO" (Trump Always Chickens Out) by postponing his tariffs. Many missed out. That made traders more reluctantthis time to sell, even though the Iran crisis was arguably more threatening than a trade war. They were primed to buy at the first hint of a TACO.
This dynamic is reinforced by multiple forces:
- "Buy the dip" conditioning post-2020
- Momentum and CTA trend-following strategies
- Dealer positioning and short gamma effects
- Passive and systematic flows
Auther"s article references Victor Haghani – who suggests markets are no longer driven solely by fundamentals and technicals—but by a broader mix of participants, including passive allocators and reflexive retail flows (i.e. "buy the dip")
This is not just psychology. It is systematic behaviour embedded in market structure.
Is This 1982 or 2000?
The key question is whether this rally marks the beginning of a new leg higher—or the late stages of an extended cycle.
| Scenario | Description | Likely Outcome |
|---|---|---|
| 1982-style | Early cycle, low valuations, strong earnings expansion | Sustained multi-year gains |
| 2000-style | Late cycle, elevated valuations, peak sentiment | Sharp drawdown |
| Mid-cycle | Earnings hold, multiples compress | Flat, volatile returns |
Given current valuations, liquidity conditions, and narrow breadth — the balance of evidence leans closer to a late-cycle setup than an early-cycle recovery.
What would prove this thesis wrong?
A cautious view should always be testable. Key signals that would invalidate it:
- Earnings revisions re-accelerate meaningfully higher;
- Market breadth expands materially;
- Bond yields fall without a growth scare; and
- Excess CAPE yield moves decisively positive
Absent these, the current setup remains challenging.
Putting It All Together
The market is pricing resilience.
History suggests that when strong price action meets weak starting conditions, the outcome is rarely symmetrical.
This rally is real. We should never discount momentum and investor psychology (e.g., recency bias and FOMO).
The question is whether it is sustainable.
Probabilities suggest it isn"t.